

Summary
Adolescence is a period of increased autonomy over decision‐making, including food choices, and increased exposure to influences outside the home, including the food environment. This review aims to synthesize the evidence for the influence of community nutrition environments, spatial access to food outlets, and consumer nutrition environments, environments inside food outlets, on adolescent food purchasing and dietary behaviors in high‐income countries. Six databases were searched for articles published before January 2023. Results were synthesized using a vote‐counting technique and effect direction plots that record the direction of the effect in relation to the anticipated relationship with health. Thirty‐four observational and two intervention studies met the inclusion criteria. In the 13 studies assessing adolescent exposure to healthy community nutrition environments, results did not show clear associations with dietary and purchasing outcomes. Thirty studies assessed adolescents' exposure to unhealthy community nutrition environments with the majority (n = 17/30, 57%) reporting results showing that greater exposure to food outlets classified as unhealthy was associated with less healthy food purchases and dietary intakes. Inconsistent results were observed across the seven studies investigating associations with the consumer environment. Further research in these areas, including more high‐quality intervention studies, may help to develop policy strategies to improve adolescents' dietary behaviors.
Keywords: adolescents, community nutrition environment, consumer nutrition environment, diet
Abbreviations
- PRISMA
Preferred Reporting Items for Systematic Reviews and Meta‐Analyses
- GIS
Geographic Information System
- GPS
Global Positioning System
1. INTRODUCTION
Adolescents have been shown to have poorer quality diets compared with other age groups, and dietary behaviors in this age group have been shown to worsen in the approach to adulthood. 1 , 2 Health behaviors established during adolescence have been shown to track into adulthood. 3 , 4 Consuming an unhealthy diet during this period of life, therefore, has the potential to negatively impact not only the immediate and future health of the individual but also the health of their future offspring. 5 During adolescence, individuals become less dependent on family and experience increased exposure to, and influence from, environments outside of the home. Increased levels of independence also mean they have greater ability to make their own decisions about the food they eat. 6
According to Glanz et al., the food environment consists of four different environment types, two of which are the community nutrition environment and the consumer nutrition environment. 7 The community nutrition environment (henceforth referred to as community environment) refers to the location and accessibility of food outlets, while the consumer nutrition environment (henceforth referred to as consumer environment) refers to factors that consumers may encounter within food outlets such as food availability, price, promotions, and placement. 7 Previous research has shown that adolescents consume the majority of their food in the home and at school; 8 , 9 however, when outside of their home and school environments, adolescents are more likely to consume foods that are high in fat, salt, and sugar. 10 , 11 Stimuli present in the community and consumer environments where food decisions are occurring are therefore likely to be playing a considerable role in influencing the independent food choices of this age group.
A number of systematic reviews have aimed to understand the influence these environments have on child and adolescent obesity, but few have examined their influence on the dietary behaviors of adolescents. Previous systematic reviews investigating the presence of food outlets around schools, mainly fast‐food outlets, convenience stores, and supermarkets, have shown little evidence for an association between outlet density or proximity and food consumption, 12 and weak evidence of a link with body weight and obesity. 12 , 13 Systematic reviews investigating exposure to supermarkets and convenience stores beyond the school vicinity have also shown mixed results for an association with child and adolescent obesity. 14 , 15 , 16 One systematic review, published in 2014, collated the evidence from studies investigating relationships between community and consumer environment exposures and the diets of children aged up to 18 years. 17 The review findings showed there is moderate evidence for community and consumer environments affecting children's diets. However, it is not possible to distinguish the influence of these two nutrition environments on the diets of adolescents separately from their impact on younger children. Adolescents are likely to use these environments in different ways to that of young children because they have greater autonomy, independence of movement, and financial decision‐making. There is limited understanding about adolescents' independent food purchasing decisions, yet these autonomous food choices may play an important role in their overall dietary intake. Greater understanding of how community and consumer environments affect adolescents' food purchasing decisions could help to identify target points for future interventions to support this age group make more healthful food choices.
This systematic review aims to synthesize the evidence for relationships between community and consumer environment exposures and adolescents' diet and food purchasing behaviors. By doing so, this review will provide a better understanding of adolescents' interaction with these nutrition environments during this key life stage.
This systematic review aimed to answer two research questions:
How do the community and consumer nutrition environments influence adolescents' dietary behaviors?
How do the community and consumer nutrition environments influence adolescents' food purchasing behaviors?
2. METHODS
This systematic review was conducted in accordance with the 2020 guidelines from the Preferred Reporting Items for Systematic Reviews and Meta‐Analyses (PRISMA) group. 18 The PRISMA checklist can be found in Supplementary Table 1. This systematic review was registered with the Prospective Register for Systematic Reviews (PROSPERO): CRD42019156500.
2.1. Search strategy
The search strategy was developed in consultation with a trained medical research librarian at the University of Southampton, UK. Six electronic databases were searched (Medline (Ovid), PsycINFO (EbscoHost), CINAHL (EbscoHost), Econlit (EbscoHost), Scopus, and GEOBASE). These databases were selected as they cover health, consumer, and geographic marketing/economic literature. The search was modified for each database to include controlled vocabulary but remained similar across databases. The search included a combination of medical subject headings (MeSH) and free‐text terms relating to “diet”, “food purchasing”, “adolescents”, “food outlets”, and “food environments”. The full search strategy can be found in Supplementary Table 2. Databases were searched for studies published in English between January 1995 and August 2021. The search was later updated to capture studies published between August 2021 and January 2023. The year 1995 was chosen as the cut‐point for the search strategy to correspond with the 2014 systematic review by Engler‐Stinger et al., which noted that most evidence in this field was collected after this time point. 17 In 2005, Glanz and colleagues were among the first to describe the relationships between different types of food environments, diet, and health. 7 The search strategy for this study is, therefore, likely to capture the majority of published literature in this area.
All titles and abstracts were screened independently by two authors (SS and MB) using Rayyan systematic review software 19 against the study inclusion/exclusion criteria (Table 1). Observational and intervention studies were included if they involved adolescent participants (mean age between 11 and 18 years reflecting the age of adolescents in secondary education in the UK and other high‐income countries 20 , 21 ), were conducted in high‐income countries, included an exposure/intervention that investigated either the community or consumer environments, and had an outcome relating to food purchasing or dietary intake. If it was not clear whether a study should be included from reading the title and abstract, the full paper was assessed for eligibility.
TABLE 1.
Inclusion/exclusion criteria for the systematic review.
| Inclusion | Exclusion | |
|---|---|---|
| Population |
|
|
| Setting |
|
|
| Study Design |
|
|
| Publication Dates |
|
|
| Exposure |
|
|
| Outcomes |
|
|
| Language |
|
Abbreviations: GIS, Geographic Information System; GPS, Global Positioning System.
2.2. Data extraction and risk of bias assessment
Data extraction forms were created to capture relevant information to address the research questions. Two researchers reviewed each article included in the full‐text screening and subsequently completed data extraction (if applicable). During this stage, SS reviewed all papers, and MB and CS each reviewed 50% of the papers. When conflicts occurred, a third author was consulted, and agreement was reached. Details about the study design, setting, participant details, exposures/intervention, outcomes, results, and funding sources were extracted for each study. Forward and backward reference searching was conducted on the articles included in the full‐text screening stage to identify potentially relevant studies not included in the database search. When an article was considered to include inadequate detail to be included in the review, the authors were contacted to provide more information; however, none of the contacted authors responded to this request.
Concurrent with the data extraction process, each study was assessed for its risk of bias in relation to the research questions. Prior to the screening process, assessment criteria were developed specifically for this review to ensure criteria relevant to the review's research question were assessed, and were based on guidance from the Centre for Reviews and Dissemination. 22 Risk of bias criteria were developed to assess elements of study design, participant recruitment and retention, exposure/intervention and outcome methodologies, statistical analyses, and handling of confounding. Separate criteria were created for observational (Supplementary Table 3) and intervention studies (Supplementary Table 4). A risk of bias score of +1 (low risk of bias/high quality), 0 (medium risk of bias/moderate quality), or −1 (high risk of bias/low quality) was allocated for each domain. Overall, risk of bias summaries were created for each study based on the number of “−1” ratings a study received. Studies with 5 or more, “−1” ratings were classed as having a high overall risk of bias. If the number of “−1” scores was 1 or less, the overall risk of bias was classified as low. Studies with “−1” ratings between these scores were considered to have moderate risk of bias. Reviewers compared their risk of bias ratings to ensure consistency. Any discrepancies were discussed in depth until a quality score was agreed. Final risk of bias scores for each study can be found in Supplementary Tables 5 & 6. No studies were excluded from the data synthesis based on the risk of bias rating in order to provide a complete overview of the current published research in this field.
2.3. Data synthesis
Because of the heterogeneity of the exposure and outcome variables used in studies included in this review, it was not possible to synthesize results using meta‐analysis. To provide a quantitative summary of the evidence for this field of research, results were synthesized using a “vote‐counting” technique based on the direction of the effect according to the expected association with health. As recommended by Cochrane for accurate vote‐counting, each study's effect estimates were categorized according to their direction in terms of showing a health benefit or harm, therefore, producing a standardized binary scoring metric. 23 To enable this vote‐counting process, all food outlets considered to be part of the community environment in the included studies were classified as: 1) having a positive effect on diet/health, 2) having a negative effect on diet/health, or 3) a neutral effect on diet/health. These classifications were based on the ratings provided as part of two Australian‐based Delphi studies wherein participants classified the healthfulness of a wide range of food outlets. 24 , 25 The food outlets categorized as healthy (supermarkets) and unhealthy (fast‐food outlets, takeaways, convenience stores, petrol stores, specialty stores for discretionary foods, and variety stores) have been consistently categorized in a similar way in previous research conducted across high‐income countries 26 , 27 , 28 and was, therefore, considered an appropriate approach to synthesizing existing evidence in this field. Food outlet definitions varied between studies, each outlet type was, therefore, classified according to the details provided in the text. For example, if a study had a category called “restaurants”, which they stated included fast‐food outlets, this group was categorized under fast‐food outlets for this review. Some studies assessed the exposure to a combination of healthy and unhealthy food environments as a single variable. For these studies, the combined exposure was classified as an unhealthy environment for data synthesis. This approach was adopted because previous research conducted with 839 women in the UK found that 99% lived in areas that were classified as having an unhealthy community environment when a range of food outlets were considered. 29 For studies assessing the consumer environment, exposures relating to healthy food items (e.g., availability of fruit and vegetables) were classified as having a positive effect on diet/health, while factors relating to unhealthy food items (e.g., reduced price of fast food) were classified as having a negative effect on diet/health.
Results that were relevant to the review's research questions and had an exposure judged as having a positive or negative effect on diet/health were subsequently rated as either being “in the expected direction” or “not in the expected direction” for health benefit (Supplementary Tables 9 and 10). Expected directions could not be assigned to the studies with neutral exposures. Some studies had multiple results relevant to the review's research questions, and all results were rated separately. Results were classified as “in the expected direction” if:
A food environment (community or consumer) classified to be healthy was associated with the purchase or consumption of healthy food, and
A food environment (community or consumer) classified to be unhealthy was associated with the purchase or consumption of unhealthy food.
Results were classified as “not in the expected direction” if:
A food environment (community or consumer) classified to be healthy was associated with the purchase or consumption of unhealthy food, and
A food environment (community or consumer) classified to be unhealthy was associated with the purchase or consumption of healthy food.
Each result was further classified according to the significance level (significant p ≤ 0.05 or non‐significant p > 0.05).
These results were summarized visually using bar charts, with the details collated into effect direction plots, as recommended by Cochrane. 23 Effect direction plots visualize the overall direction of the findings from each study. Following published instructions from Boon et al., 30 results that had similar exposures (community or consumer) and outcomes (diet or purchasing) were combined to demonstrate the overall direction of findings that were similar in nature. Arrows were used in the effect direction plots to represent the combined direction of results for each study. The method of combining results was based on the following criteria 30 , 31 :
When ≥70% of outcomes (a clear majority) reported similar directions, the arrows (▲ (positive) or ▼ (negative)) were used to represent the overall direction of effects.
When <70% of outcomes reported similar direction, a two‐way arrow (↔) was used to represent inconsistent results.
Separate effect direction plots were created for community and consumer environment exposures. For studies that presented sub‐analysis results (e.g., boys vs girls) alongside results for the combined population, only the results for the combined population were included in the vote‐counting analyses and effect direction plots. In line with most recent guidance for generating effect direction plots, statistical significance was not included in the plots. 30 The vote‐counting exercise was completed by the lead author (SS) and check by another author (MB or CS) who had complete the data extraction for that included study.
3. RESULTS
3.1. Search results
Figure 1 presents the PRISMA Diagram that outlines the study selection process. Following duplicate removal, 5,828 articles of potential relevance to the research questions were identified. After all titles and abstracts were screened, 82 full‐text articles were reviewed for eligibility. Thirty‐six articles met the inclusion criteria.
FIGURE 1.
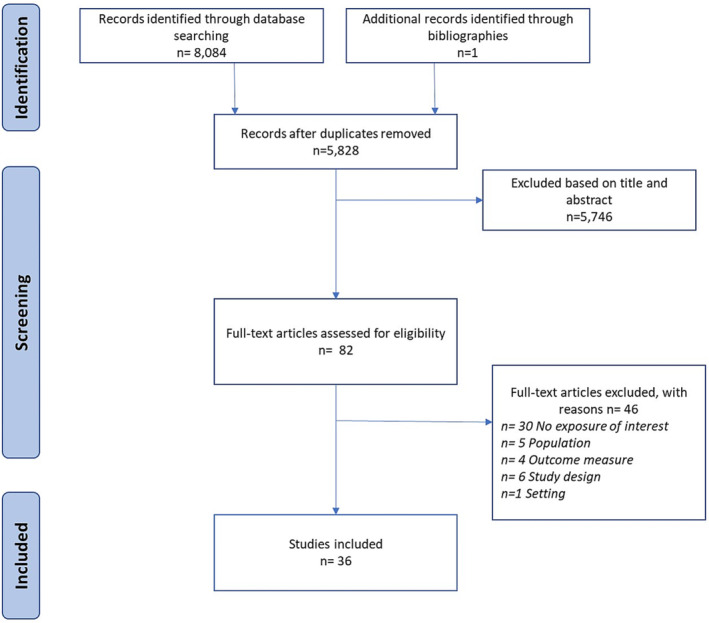
PRISMA diagram.
3.2. Study characteristics
Almost all studies meeting the inclusion criteria adopted an observational study design, with the majority using a cross‐sectional design (n = 31, 91%) and three having a longitudinal design (n = 3, 9%). Two intervention studies met the inclusion criteria.
The included studies were published between 2001 and 2022. Most studies included both boys and girls; one study only had girl participants and two studies recruited only boys. Almost half of all included studies were conducted in the USA (n = 17, 47%) and Canada (n = 8, 24%). Table 2 summarizes the exposures/interventions and outcomes for each study. More in‐depth details on study design, setting, participant demographics, exposures, and outcomes for each study can be found in Supplementary Tables 7 and 8.
TABLE 2.
Exposures and outcomes for included studies.
| Author, year, country | Exposure/intervention | Outcome |
|---|---|---|
| Intervention (Consumer) | ||
| Lawman et al., 2015 32 USA | 12‐month CS intervention to increase availability of 4 new healthy foods (2 new products from 2 different groups: fresh F&V, canned/dried F&V, low fat diary, lean meats, whole grains) plus staff training and a marketing campaign consisting of window, door, and in‐store banners, shelf labels, and recipe cards. |
Change in energy content (kcal) of foods purchased. Data collected through bag audits at store exit. |
| Shin et al., 2015 33 USA | 8‐month intervention aiming to increase the availability of healthy foods (healthy beverages, breakfasts, lunches, snacks, and takeaway foods) in CS and takeaways within 0.5 miles of the study recreation centers |
Self‐reported change in frequency of healthful food purchases and unhealthful food purchases |
| Observational (Community) | ||
| An and Sturm, 2012 34 ;USA | Number of FF outlets, CS, small food stores, grocery stores, and large supermarkets within 0.5‐mile radial buffer of home and school | Self‐reported consumption of F&V, 100% juice, SSBs, high‐sugar food, and FF in previous day |
| Berge et al., 2014 35 ; USA |
1) Presence of FF outlets within 1200 m from home; 2) High density of FF outlets (5+) within 1600 m from home, 3) Presence of CS within 1200 m from home;4) Presence of supermarket within 2400 m from home; 5) Unsupportive built food environment (high density (5+) of FF outlets, presence of FF outlets and CS within 1200 m, and no nearby supermarket) |
Mean consumption of FF and F&V per week |
| Clark et al., 2014 36 ; New Zealand | 1) Density of food outlets within 800 m or 1500 m radial buffer around schools; 2) Distance to nearest food outlet from school | Diet Quality Index. Higher scores reflecting greater adherence to healthy eating guidelines |
| Cutumisu et al., 2016 37 ; Canada | Number of FF outlets within a 750 m radius street network distance buffer around school | Self‐reported “junk food” consumption at lunchtime during the previous school week |
| Davis and Carpenter, 2009 38 ; USA | Presence (Yes/No) of a FF outlet within half a mile of school |
Self‐reported consumption in the last 24 h of F&V, juice, SSBs, and fried potato. Self‐reported servings in the last 24 h of F&V, juice, SSBs, and fried potato |
| Forsyth et al., 2012 39 ; USA | Number of FF outlets within 1600 m buffer from home and 800 m buffer from school | Frequency of eating from five categories of FF outlets: burgers and fries, fried chicken, Mexican, pizza, and sandwich restaurant |
| Godin et al., 2018 40 ; Canada | Presence of 1 + restaurant/FF outlet, variety store, food store within 1 km circular buffer around school | Self‐reported consumption of SSBs during a usual school week (Monday–Friday) |
| Grier and Davis, 2013 41 ; USA | Distance from school to nearest FF outlets | Self‐reported consumption of SSBs in previous day |
| Hager et al., 2017 42 ; USA |
Home located in an area with no supermarket (or healthy supermarket alternatives) within 0.4 km combined with low‐income SES factors. Home located in an area with >4 CS within 0.4 km |
Self‐reported daily consumption of foods high in fat, salt and sugar |
| He et al., 2012a 43 ; Canada |
Density of “junk food” outlets: number of FF outlets and CS within 1 km buffer of home and school. Proximity of “junk food” outlet from home and school: shortest distance to nearest FF outlets and CS |
FF purchasing when alone or with friends FF purchasing with parents CS purchasing when alone or with friends CS purchasing with parents |
| He et al., 2012b 44 ; Canada |
Distance from home/school to nearest CS, FF outlets, and supermarket. Number of FF outlets in 1 km buffer from home/school |
Diet quality assessed using modified Healthy Eating Index‐2005 score |
| Jago et al., 2007 45 ; USA | Distance from participants home to nearest FF outlets and small food stores | Consumption of fruit and fruit juice; low‐fat vegetables; high‐fat vegetables (fried potatoes, coleslaw, potato salad) |
| Kelly et al., 2019 46 ; Ireland | High FF outlet density: 10% or more of food outlets in 1 km radius of school are FF outlets | Self‐reported daily consumption of F&V, sweets, SSBs, and chips |
| Laska et al., 2010 47 ; USA | Distance to and density (number of stores within a specified buffer) of food outlets around the participants' homes and schools. | Self‐reported daily consumption of SSBs |
| Laxer and Janssen, 2013 48 ; Canada | Density (per km2) of FF outlets in 1 km circular buffer from school |
Non‐excessive consumption of FF = < 2 times per week Excessive FF consumption = 2 + times per week |
| Loh et al., 2022 49 ; Australia | 4 neighborhood typologies surrounding home identified through Latent Class Analysis: 1): Limited variety/low number of food outlets, 2) Some variety/low number of food outlets, 3) High variety/medium number of outlets, 4) High variety/high number of food outlets | Purchasing snack foods on journey to and from school (once a week or more, less than once a week) |
| Longacre et al., 2012 50 ; USA | Number of FF outlets in participants town | Self‐reported consumption of FF in the previous 7 days (Yes/No) |
| Powell and Han, 2011 51 ; USA | Availability of food outlets (FF outlets, full‐service restaurants, supermarkets, and grocery stores, CS) per 10,000 capita per 10 mile2 | Number of days in previous week, when consumption of 7 food groups occurred: fruit and fruit juice, vegetables, meat, non‐meat protein, dairy, grains, sweets, or desserts |
| Sadler et al., 2016 52 ; Canada | Time (minutes) exposed (within 50 m) to FF outlets, variety stores, pizza outlets, or ice cream shops on journeys to and from school | Self‐reported junk food purchasing during journey to or from school |
| Seliske et al., 2013 53 ; Canada | Number of food retailers within 1 km of school | Regular purchasing of lunch from snack bar, FF outlet, or café on school days |
| Shareck et al., 2017 54 ; UK |
Total number of FF outlets and CS around home and/or school Proportion of all food outlets that are FF outlets and CS around home and/or school |
Self‐reported weekly frequency of FF intake Daily SSB consumption |
| Shearer et al., 2015 55 ; Canada | Average distance to each type of food outlet from home and school | Self‐reported caloric intake; diet quality; F&V consumption; frequency of FF consumption; frequency of ready‐made food consumption |
| Shier et al., 2016 56 ; USA | Number FF outlets, CS, restaurants, small grocery stores, and supermarkets within 2‐mile radius of home address | Self‐reported weekly consumption of foods high in fat, salt, and sugar |
| Smith et al., 2013 57 ; UK |
Total number of food outlets within 400 m and 800 m road network buffer from school; Median distance to grocery store or takeaway within 400 m and 800 m buffer; Minimum distance to a grocery store or takeaway |
Healthy diet score: consumption of breakfast, fruit, and vegetables. Unhealthy diet score: daily consumption of crisps and savory snacks, sweets and chocolate, biscuits; fried foods and fizzy drinks |
| Svastisalee et al., 2012 58 ; Denmark | Number of supermarkets or FF outlets divided by total road segments within 300 m from school | Self‐reported frequency of F&V consumption |
| Svastisalee et al., 2015 59 ; Denmark | Number of FF outlets within 500 m radius of school | Self‐reported weekly consumption of FF |
| Timperio et al., 2018 60 ; Australia | Neighborhood typologies surrounding home identified through Latent Class Analysis. Typologies describe area consisting mainly of 1) a variety of outlets including staple/fresh food; 2) café, restaurants, takeaways, and CS; 3) very few outlets |
Healthful dietary pattern: higher consumption of fruit, dried fruit, vegetables, reduced fat milk, and water as well as lower consumption of unhealthy items Energy‐dense pattern: higher consumption of energy dense sweet and savory food, and energy‐dense beverages |
| Trapp et al., 2022. 61 Australia | Total number of 6 food outlet categories within 400 m, 800 m, and 1 km radial buffer of school | Frequency of purchasing snack foods (soft drinks, energy drinks, cakes/biscuits, chocolate, crisps/chips, hot chips, burgers, sausage rolls, pies) |
| van der Horst et al., 2008 62 ;The Netherlands | Availability (total number) of FF outlets, supermarkets, CS, bakeries, and F&V and vegetable stores in 500 m radius from school; distance to nearest food store | Self‐reported liters of SSB consumed per day |
| Virtanen et al., 2015 63 ; Finland | Shortest straight‐line distance to a FFO outlet or supermarket from school | Self‐reported purchasing of snacks (not main meals) from outside school |
| Observational (Consumer) | ||
| Edmonds et al., 2001 64 ; USA | Mean availability of F&V, and 100% fruit juice in census tract. Assessed by store audits. | Mean consumption of F&V, and 100% fruit juice for participants living in census tract |
| Gustafson et al., 2017 65 ; USA | Combined Nutrition Environment Measure Survey (NEMS) scores assessing the quality, availability, and price of healthy foods in the three most frequently visited food outlets. Higher scores = healthier environments | Self‐reported daily intake of F&V, added sugar, and SSBs |
| Khan et al., 2012 66 ; USA | Index of FF price computed for closest zip code using three food items in the American Chambers of Commerce Researchers Association | Self‐reported number of days in past week FF was consumed |
| Powell and Han, 2011 51 ; USA | Index of FF price computed for closest zip code using three food items in the American Chambers of Commerce Researchers Association | Number of days in previous week, when consumption of seven food groups occurred: fruit and fruit juice, vegetables, meat, non‐meat protein, dairy, grains, sweets, or desserts |
| Sturm and Datar, 2011 67 ; USA | Price indices (standardized) for F&V, dairy, and FF at metropolitan area | Consumption in the previous week of F&V, milk, soft drinks, and FF |
Abbreviations: CS, convenience stores; FF, fast food; F&V, fruits and vegetables; SSB, sugar‐sweetened beverages.
3.3. Exposures/interventions
3.3.1. Community nutrition environment
Thirty studies, all with observational designs, assessed the community environment. No intervention studies assessed the community environment.
Density, the number of food outlets in a specific geographic area, was assessed in 22 studies. 34 , 35 , 36 , 37 , 39 , 42 , 43 , 44 , 46 , 47 , 48 , 49 , 50 , 51 , 53 , 54 , 56 , 58 , 59 , 60 , 61 , 62 Proximity, the distance to food outlets, was assessed in 14 studies. 35 , 36 , 38 , 40 , 41 , 42 , 43 , 44 , 45 , 47 , 55 , 57 , 62 , 63 One study assessed the time spent exposed to unhealthy food outlets on the journey to and from school. 52
Geographic Information System (GIS) methods were used to assess either density or proximity measures of the food environment in 28 studies. The methods used in these GIS studies varied. Both Euclidean and street network distances were applied, with buffers ranging from 300 m to 3200 m, around either the participants' homes and/or schools. 56 Global Positioning System (GPS) methods were used in two studies to generate personalized activity spaces for study participants. 52 , 55 Ground‐truthing (on‐site, in‐person verification of food outlets) of fast‐food outlets in participants' towns was completed by one study, 50 and another used zip‐code data to consider the number of food outlets present per 10,000 capita per 10 mile2. 51
Food outlet data were gathered using government/local authority databases in 10 studies, business directories in 12 studies, and phone directories or online searches in seven studies. One study used food environment data collected by the Baltimore City Food Policy Initiative as part of a larger, citywide project. 42 Few studies validated the presence of the food outlet exposures. Of the eight that did, three conducted physical ground‐truthing 42 , 50 , 58 while five others used telephone calls, internet searches, and knowledge of local residents to verify the location or presence of food outlets. 36 , 43 , 44 , 55 , 59
The majority of studies that assessed the community environment used absolute measures, such as the total number of a particular food outlet in a given area. Four studies considered relative measures that combine more than one element of the food environment (e.g., different food outlet types). One study created an “unsupportive built food environment” variable for areas that contained a high density (5+) of fast‐food outlets within 1,600 m from home combined with no nearby supermarket and at least one fast‐food outlet and convenience store within 1,200 m of home. 35 Two studies assessed the proportion of fast‐food outlets 46 , 54 or convenience stores to the total number of food outlets around schools. 54 Two studies used Latent Class Analysis to identify typologies that best described the combination of food outlets in the neighborhoods surrounding participants' homes. 49 , 60
3.3.2. Consumer nutrition environment
Seven studies, five with observational and two with intervention designs, assessed aspects of the consumer environment in relation to adolescents' food purchases and dietary behaviors. Two observational studies assessed the availability of healthy food items in supermarkets, convenience stores, and restaurants. The Nutrition Environment Measure Survey (NEMS) tool was used in one of these studies to assess healthy food availability in the three food outlets most frequently visited by their adolescent participants. 65 The other study calculated the mean fruit and vegetable availability for each participant's local area by conducting in‐store audits in one randomly selected supermarket and one convenience store per census tract to determine the presence and shelf space in meters of fruit and vegetables. 64
Three observational studies assessed the price of food items in relation to adolescent food purchasing and dietary behaviors. Two of these studies created price indices for fast‐food in the participants' residential postcode areas by using the mean prices for three key indicator fast‐food items (a quarter‐pound burger with cheese, a thin crust regular cheese pizza, and a fried chicken thigh or drumstick from leading fast‐food outlet chains). 51 , 66 The third study created a price index using the United States Cost of Living Index data to reflect relative food prices for each participant's metropolitan area, which consisted of the average annual prices for fruit, vegetables, dairy, and fast‐food divided by the overall Cost of Living Index for the area. 67
Both intervention studies manipulated the consumer environment by increasing the availability of healthy foods and introducing a range of marketing materials and activities, such as taste testing, to promote the healthy items. 32 , 33
3.4. Outcomes
Most (n = 28, 78%) of the included studies considered a dietary variable as the outcome of interest while eight (22%) studies used a purchasing variable as the outcome. The majority of studies using dietary outcomes assessed the consumption of individual food groups, such as fruit, vegetables, sugar‐sweetened beverages (SSBs), fast‐food, and foods high in fat, salt, and sugar through self‐report questionnaires. Five studies used composite measures to assess adolescents' overall dietary intake. Diet quality was assessed in three of these studies using different tools including the validated New Zealand Diet Quality Index for Adolescents, 36 a modified version of the Healthy Eating Index 2005, 44 and the International Dietary Quality Index. 55 Two studies did not report validation details of the composite measures. One study derived a healthy diet score based on responses about breakfast and daily fruit and vegetable consumption, plus an unhealthy diet score based on the consumption of crisps and savory snacks, sweets or chocolate, biscuits, fried foods, and fizzy drinks. 57 Another study used principal component analysis to create a healthful and an energy‐dense dietary pattern score using food frequency questionnaire data from participants. 60
Eight studies, including the two intervention studies, assessed adolescent purchases. Each study used a different methodology and focused on the purchasing of different types of food. Seven studies collected self‐reported details about food purchasing; six used questionnaires 33 , 43 , 49 , 53 , 61 , 63 and one used daily activity diaries. 52 The final study directly observed customer purchases at convenience stores and calculated the total energy content of the purchases made. 32
3.5. Risk of bias
For the observational studies, the majority (n = 25, 74%) were considered to have an overall “moderate risk of bias” in relation to the research questions. Two observational studies (6%) were rated as having a “low risk of bias” and seven (22%) were rated as having a “high risk of bias”. The two intervention studies were considered to have a “high risk of bias’ in relation to the research question.
3.6. Key findings
Figure 2 summarizes the vote‐counting results for the studies that considered healthy community environment exposures and unhealthy community environment exposures as well as total consumer environment exposures. In total, 352 food purchasing and diet outcomes were recorded from studies with community environment exposure and 19 outcomes from studies with consumer environment exposures. For the community environment exposures, the results are presented separately for healthy and unhealthy community environments; with the majority (76%) falling in the unhealthy community environment.
FIGURE 2.
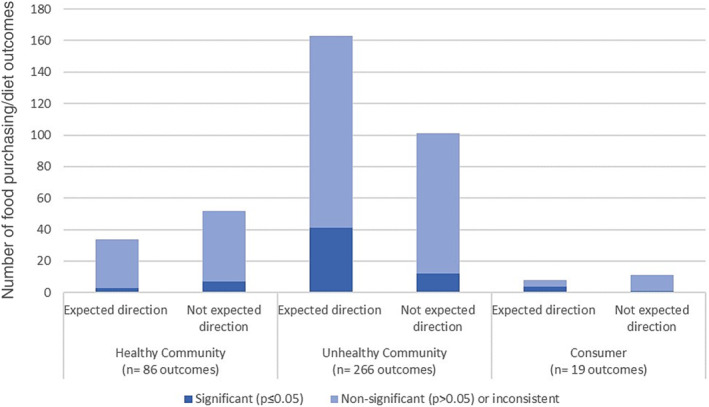
Graph showing the vote‐counting results for the associations between the community and consumer nutrition environments and diet‐related behaviors.
For vote‐counting results related to healthy community environment exposures, more than half (60%, n = 52/86) did not support the review hypothesis that exposure to healthy food outlets was associated with increased purchasing and consumption of healthy foods. A small majority of findings (62%, n = 165/266) relating to unhealthy community environments supported the review hypothesis that exposure to unhealthy food outlets was associated with increased purchasing and consumption of unhealthy foods. The majority of findings (82%, n = 287/352) relating to the community environment were not statistically significant.
For vote‐counting, the consumer environment results combined healthy and unhealthy consumer environments because the body of evidence investigating these exposures was small. Overall, 58% (n = 11/19) were not in the expected direction and did not support the review hypothesis that greater exposure to healthy environments in food outlets is associated with increased purchasing and consumption of healthy foods. Again, the majority (79%, n = 15/19) of findings relating to the consumer environment were not statistically significant (i.e., p > 0.05).
3.6.1. Community nutrition environments
Table 3 shows the effect direction plot for the studies that considered the community environment as an exposure. Healthy community environments (i.e., exposure to supermarkets) were considered in 13 studies, 12 with dietary outcomes and one with purchasing outcomes. Of the studies assessing diet, n = 4/12 (33%) reported combined results not in the expected direction, 44 , 55 , 57 , 62 indicating that greater exposure to supermarkets and grocery stores was associated with poorer dietary outcomes in adolescents. Three studies (n = 3/12, 25%) reported results in the expected direction. 56 , 58 Five studies (n = 5/12, 42%) reported inconsistent results between exposure to healthy food outlets around home and/or school and adolescents' dietary intakes. 34 , 36 , 42 , 47 In the single study that assessed purchasing, overall findings from that study were in the unexpected direction suggesting that greater exposure to more healthful environments was associated with increased unhealthy snack purchases. 61 Six of the studies assessing healthy community environments (6/13, 46%) were conducted in the USA, with two (n = 2/6, 33%) showing results in the expected direction 35 , 56 and four (n = 4/6, 67%) showing inconsistent findings. 34 , 42 , 47 , 51 In the two studies from Canada, both found results in the unexpected direction, showing greater access to supermarkets was associated with less healthy dietary behaviors. 44 , 55
TABLE 3.
Effect direction plot for community nutrition environment results.
| Author, year | Country | Study design | Sample size | Exposure to healthy food outlets | Exposure to unhealthy food outlets | Outcome | Risk of bias |
|---|---|---|---|---|---|---|---|
| An and Sturm, 2012 34 | USA | Obs (CS) | 5236 | ↔36 | ↔54 | Diet | Moderate |
| Berge et al., 2014 35 | USA | Obs (CS) | 2682 | ▲4 | ↔16 | Diet | Moderate |
| Clark et al., 2014 36 | New Zealand | Obs (CS) | 664 | ↔3 | ▼9 | Diet | Low |
| Cutumisu et al., 2016 37 | Canada | Obs (CS) | 26655 | ▲ | Diet | Moderate | |
| Davis and Carpenter, 2009 38 | USA | Obs (CS) | 529367 | ▲10 | Diet | High | |
| Forsyth et al., 2012 39 | USA | Obs (CS) | 2724 | ▲6 | Diet | High | |
| Godin et al., 2018 40 | Canada | Obs (CS) | 41829 | ▲3 | Diet | Moderate | |
| Grier and Davis, 2013 41 | USA | Obs (CS) | 100000 | ▲ | Diet | High | |
| Hager et al., 2017 42 | USA | Obs (CS) | 634 | ↔3 | ↔8 | Diet | Low |
| He et al., 2012b 44 | Canada | Obs (CS) | 580 | ▼2 | ▲8 | Diet | Moderate |
| Jago et al., 2007 45 | USA | Obs (CS) | 204 | ▼5 | Diet | Moderate | |
| Kelly et al., 2019 46 | Ireland | Obs (CS) | 5344 | ↔5 | Diet | Moderate | |
| Laska et al., 2010 47 | USA | Obs (CS) | 349 | ↔2 | ▲3 | Diet | Moderate |
| Laxer and Janssen, 2013 48 | Canada | Obs (CS) | 6099 | ▲3 | Diet | Moderate | |
| Longacre et al., 2012 50 | USA | Obs (CS) | 1547 | ▲2 | Diet | Moderate | |
| Powell and Han, 2011 51 | USA | Obs (CS) | 1134 | ↔3 | ↔6 | Diet | Moderate |
| Shareck et al., 2017 54 | UK | Obs (CS) | 3089 | ↔12 | Diet | Moderate | |
| Shearer et al., 2015 55 | Canada | Obs (CS) | 315 | ▼10 | ▲20 | Diet | Moderate |
| Shier et al., 2016 56 | USA | Obs (CS) | 941 | ▲6 | ↔18 | Diet | Moderate |
| Smith et al., 2013 57 | UK | Obs (LT) | 524 | ▼4 | ▲5 | Diet | Moderate |
| Svastisalee et al., 2012 58 | Denmark | Obs (CS) | 6034 | ▲6 | ↔24 | Diet | Moderate |
| Svastisalee et al., 2016 59 | Denmark | Obs (CS) | 4642 | ↔2 | Diet | Moderate | |
| Timperio et al., 2018 60 | Australia | Obs (CS & LT) | 439 | ▲8 | Diet | Moderate | |
| van der Horst et al., 2008 62 | The Netherlands | Obs (CS) | 1174 | ▼ | ▲5 | Diet | High |
| He et al., 2012a 43 | Canada | Obs (CS) | 782 | ▲5 | Purchase | Moderate | |
| Loh et al., 2022 49 | Australia | Obs (CS) | 410 | ▼6 | Purchase | Moderate | |
| Sadler et al., 2016 52 | Canada | Obs (CS) | 511 | ▲ | Purchase | High | |
| Seliske et al., 2013 53 | Canada | Obs (CS) | 6971 | ▲6 | Purchase | Moderate | |
| Trapp et al., 2021 61 | Australia | Ob (CS) | 2389 | ▼6 | ↔12 | Purchase | Moderate |
| Virtanen et al., 2015 63 | Finland | Obs (CS) | 23182 | ▲2 | Purchase | Moderate |
Effect direction: ▲ Positive result; ▼ Negative result; ↔ Inconsistent results. Number of outcomes within each category is 1 unless indicated in subscript beside effect direction.
Reported effect direction for multiple outcomes: All outcomes report effect in the same direction OR where direction of effect varies across multiple outcomes: ≥70% of outcomes report similar direction. Inconsistent findings = if <70% of outcomes report consistent direction of effect (↔).
Thirty studies assessed adolescents' exposure to unhealthy food environments in relation to their dietary and food purchasing behaviors. Majority of these studies (n = 17/30, 57%) reported results in the expected direction suggesting greater exposure to food outlets classified as unhealthy (i.e., fast food outlets, convenience stores, variety stores, unhealthy specialty stores) was associated with unhealthier food purchases and dietary intakes. 37 , 38 , 39 , 40 , 41 , 43 , 44 , 47 , 48 , 50 , 52 , 53 , 55 , 57 , 58 , 60 Diet was the primary outcome in 24 of these 30 studies. When findings were combined for studies with diet outcomes, 54% (n = 13/24) of studies showed results supporting the study hypothesis. 37 , 38 , 39 , 40 , 41 , 44 , 47 , 48 , 50 , 55 , 57 , 58 , 60 Inconsistent results were observed in 38% (n = 9/24) of studies with dietary outcomes. 34 , 35 , 36 , 42 , 46 , 51 , 54 , 56 , 59 , 62 Six studies investigated unhealthy community environment exposures in relation to food purchasing outcomes. The majority of studies with purchasing outcomes (n = 4/6, 67%) reported results in the expected direction, suggesting greater exposure to unhealthy outlets is associated with a larger number of unhealthy food purchases and fewer healthy food purchases among adolescents. 43 , 52 , 53 , 63 One study showed results in the unexpected direction 49 and one show inconsistent findings. 61 The majority of studies assessing unhealthy community environments were conducted in the USA and Canada. Findings from studies in the USA showed mixed findings with five (n = 5/11, 45%) showing results in the expected direction, 38 , 39 , 41 , 47 , 50 five (n = 5/11, 45%) showing inconsistent findings, 34 , 35 , 42 , 51 , 56 and 1 (n = 1/11, 9%) showing results in the unexpected direction. 45 Findings from studies conducted in Canada (n = 8) were consistent; all showed results in the expected direction indicating greater access to unhealthy food outlets was associated with less healthy food purchasing and dietary behaviors in adolescents. 37 , 40 , 43 , 44 , 48 , 52 , 53 , 55
Cafes and restaurants were considered in five studies but not included in the effect direction plot because they were classified as food outlets that have an overall neutral effect on health. 24 All of these studies considered diet variables as primary outcomes. Findings from these studies suggest that greater levels of exposure to cafes and restaurants associated with better dietary behaviors in adolescents (n = 15/25 outcomes, 60%).
3.6.2. Consumer nutrition environment
Inconsistent results were observed in five studies investigating associations between the consumer environment and adolescent dietary behaviors and the two intervention studies that assessed purchasing outcomes (Table 4). Findings of the two studies focused on increasing the availability of healthy foods were inconsistent; one found increased consumption of fruit but decreased consumption of vegetables, 64 and the other found decreased consumption of fruit, vegetables, and SSBs but increased consumption of added sugar. 65 One study investigated the influence that the price of healthy foods had on intake and found a relationship in the unexpected direction between the price of fruit and vegetables and the consumption fruit and vegetables, whereby higher prices were associated with higher intake. 67 In three studies investigating the price of unhealthy foods, 51 , 66 , 67 one (33%) showed results in the expected direction 66 ; the two other studies showed results in the unexpected direction suggesting higher prices on unhealthy food items were associated with greater consumption of those items. 51 , 67 No overall direction could be determined from the two intervention studies that aimed to improve the healthfulness of the in‐store consumer environment in convenience stores by increasing the availability of healthy foods and using signage and instore marketing strategies (taste tests, cooking demonstrations, and recipe cards) to promote these foods. One reported a non‐significant increase in the energy content of adolescent food purchases following the intervention. 32 The second study reported a non‐significant decrease in the purchasing of unhealthy food items but also observed a decrease in purchasing of healthy food items (non‐significant) following the intervention. 33
TABLE 4.
Effect direction plot for consumer nutrition environment results.
| Author, year | Country | Study design | Sample size | Exposure type | Healthy consumer environment | Unhealthy consumer environment | Outcome type | Risk of bias |
|---|---|---|---|---|---|---|---|---|
| Observational | ||||||||
| Edmonds et al., 2001 64 | USA | Obs (CS) | 90 | Availability | ↔6 | Diet | High | |
| Gustafson et al., 2017 65 | USA | Obs (CS) | 432 | Availability | ↔ 3 | Diet | Moderate | |
| Khan et al., 2012 66 | USA | Obs (LT) | 11700 | Price | ▲ | Diet | High | |
| Powell and Han, 2011 51 | USA | Obs (CS) | 1134 | Price | ▼3 | Diet | Moderate | |
| Sturm and Datar, 2011 67 | USA | Obs (CS) | 6034 | Price | ▲ | ▼2 | Diet | Moderate |
| Intervention | ||||||||
| Lawman et al., 2015 32 | USA | Intervention (repeated CS sample with no control) 12 months | 999 | Availability and social marketing campaign | ▼ | Purchases | High | |
| Shin et al., 2015 33 | USA | Cluster randomized intervention with control 8 months | 152 | Availability and in‐store promotion | ↔2 | Purchases | High | |
Effect direction: ▲ Positive result; ▼ Negative result; ↔ Inconsistent results. Number of outcomes within each category is 1 unless indicated in subscript beside effect direction.
Reported effect direction for multiple outcomes: All outcomes report effect in the same direction a OR where direction of effect varies across multiple outcomes: ≥70% of outcomes report similar direction. Inconsistent findings = if <70% of outcomes report consistent direction of effect (↔).
4. DISCUSSION
4.1. Summary of findings
This systematic review synthesized findings from available scientific literature and determined the overall direction of the associations between the community and consumer environments and adolescents' food purchasing and dietary behaviors. In recognition that unhealthy food environments play a role in obesity and non‐communicable disease risk, and the importance of adolescence as a key period of life to establish healthy dietary behaviors, this review highlights the need for further high‐quality intervention research. The observational evidence available summarized in this review suggests that increased adolescent exposure to unhealthy food outlets, such as fast‐food outlets and convenience stores, is associated with greater purchase and consumption of unhealthy foods. Conversely, and in contrast to one of the review's two hypotheses, exposure to food outlets categorized as healthy was not associated with greater consumption of healthy foods. Testing the relationship between exposure to healthy outlets and food purchasing/dietary outcomes may have been limited because supermarkets, the only outlets included in this review that fell in the healthy category, sell both healthy and unhealthy foods. This finding illustrates that supermarkets represent more of a mixed exposure in terms of healthfulness.
The evidence assessing the role of the consumer environment in adolescent food purchasing and dietary behaviors is limited, and further research is needed to address this evidence gap. Among the observational studies that assessed the consumer environment, no clear associations between price, availability, and adolescents' dietary intake could be determined. 51 , 64 , 65 , 66 , 67 Only two intervention studies, both with high risk of bias, have been conducted in this field. These two studies manipulated the in‐store environment of convenience stores to improve the availability and non‐price related promotion of healthy foods. No clear direction of effect was observed on the healthfulness of adolescent food purchases from these intervention studies. These studies are of particular interest as previous systematic reviews of literature among adults have shown that consumer environment factors, such as in‐store placement, price, and promotion strategies, have a stronger, more consistent influence on the food purchasing and dietary behaviors of adults. 31 , 68 , 69 , 70 , 71 However, evidence for the influence of consumer environment factors on adolescents' purchasing patterns is less clear, which might suggest that adolescents' food purchases are motivated by different factors than those of adults. Adults are generally purchasing food items for the household, to be consumed at home, whereas adolescents tend to purchase foods for immediate consumption, often in the presence of their friends. 72 , 73 A greater understanding of how consumer environments are influencing adolescents' food purchasing and dietary behavior is critical given the findings for the community environment found in this systematic review. If exposure to both healthy and unhealthy food outlet types is associated with less healthy food‐related behaviors among adolescents, understanding the factors inside these outlets that encourage these unhealthy choices would be important to inform effective public health interventions targeting this population.
This systematic review classified food outlets according to their “healthfulness” ratings from previous research 24 , 25 and is in line with how these food outlets are often considered in the food environment literature in terms of health. 26 , 27 , 28 This approach may be overly simplistic and result in some food outlets receiving a rating that does not reflect all the food items on sale. For example, supermarkets received a “healthy” rating; however, previous studies involving in‐store audits in supermarkets, assessing food availability, variety, price, and promotions have shown supermarkets have varying levels of overall “healthfulness”. 74 , 75 Additionally, other research has shown that ultra‐processed foods and foods high in fat, salt, and sugar are more frequently promoted by supermarkets in western countries than foods that are supportive of healthy eating guidelines. 76 , 77 This review did not find evidence to support one of the hypotheses that increased exposure to supermarkets is associated with better dietary behaviors among adolescents. Further research is required to provide accurate health ratings of food outlets, particularly supermarkets, and to understand how these are associated with adolescent food purchasing and diet.
Dietary outcomes have been assessed more often than food purchasing behaviors in studies assessing the influence of the community and consumer environments adolescents' diet‐related behaviors. Similar to findings from a previous systematic review, asking about consumption of single food items or short screener‐style questionnaires were the dietary data collection methods most often used in studies in this review. 78 The use of such methods may not be capturing the complex nature of dietary intake. Only five of the 28 included studies assessing diet (18%) considered diet as a whole by using diet quality indices and composite dietary pattern scores. 36 , 44 , 55 , 57 , 60 In addition, this review has highlighted the gap in research investigating adolescent food purchasing. The methods used varied, but only one such study collected information about specific food and drink purchases made by adolescents via bag audits when exiting the store 32 ; these data were converted into an outcome measure that described the energy content of all purchases in the shopping bag. No studies collected data about how often food purchases were made by adolescents. As a result, it was not possible to comment on the overall healthfulness of adolescent food purchases. Such evidence gaps make it difficult to assess how significant adolescent‐determined food purchases are in relation to their overall dietary intake, or whether this contribution varies with age or family socioeconomic status. Future research should explore the use of novel technologies to provide insight into the types of food purchases made by adolescents, using adolescent store loyalty cards or ecological momentary assessment, for example.
All but two of the studies in this review assessed community environment measures using GIS technology to examine participants' use of the area around the home and/or school demonstrating the growing popularity of applying GIS methodology to this field of research. 79 Methodological limitations of GIS have been highlighted previously, with concerns including the inability of GIS to account for daily movements of individuals leading to an overestimation of the importance of the home neighbourhood. 79 These concerns have drawn into question how best to identify the spatial exposures that accurately represents the environments important in shaping behavior. 79 , 80 The use of GPS to assess individuals' exposure to the food environment is thought to address some of these concerns because individualized activity spaces that reflect daily movement can be created. 79 Only two studies in this review used GPS methods. The lack of research using GPS to assess adolescents' community environment exposures highlights an area for future research.
4.2. Public health implications
Further high‐quality evidence is required to support the development of public health policies that encourages healthy eating behaviors among adolescents, especially their independent food choices outside of home and school. To combat childhood obesity, some local‐level governments have taken action towards creating healthier food environments by introducing zoning or planning limits on fast‐food outlets. Examples include in Detroit, USA, where zoning legislation has prohibited fast‐food outlets opening within 500 ft of schools, 81 and Wicklow, Ireland, where “no fry zones” limit fast‐food outlets and takeaways opening within 400 m of school sites and playgrounds. 82 A recent census of all 325 local governments in England found that roughly half had a policy specifically targeting takeaway food outlets. 83 Similar to the examples from Ireland and USA, the majority of the policies in England that focused on health included exclusion zones around areas relating to children and families such as schools, parks, and leisure facilities. The implementation rates and the effectiveness of these policies, however, were not reviewed. 83 While this is a logical starting point for such policies, further research is needed to understand how adolescents use their community nutrition environments and whether focusing on the traditional areas where children and families spend time is sufficient to have a positive role in altering adolescents' independent food behaviors. An expanded policy approach is likely to be particularly important for adolescents because of their increased levels of independence resulting in them being exposed to larger spatial areas outside of the home and school surrounds.
The UK government is the first country to introduce legislation limiting food retailers' marketing strategies in retail outlets. Since October 1, 2022, most retailers can no longer place foods high in fat, sugar, and salt in prominent store positions, including store entrances, aisle ends, and checkouts. The UK government has also announced intentions to limit volume‐based promotions (e.g., buy one get one free) of these items; the law is due to come into effect on October 1, 2023. 84 , 85 Given that existing evidence for how consumer environments affect adolescents' food choices is limited, there is little to help us anticipate the impact of these policies on this age group. Further research in this area and adolescent‐specific evaluation of these policies will identify if further support for adolescents is required to help them make healthy food decisions in their community and consumer environments.
4.3. Strengths and limitations of this review
A strength of the review is the adherence to PRISMA guidelines throughout. In addition, two reviewers independently conducted data extraction and quality assessment for each of the included studies to ensure consistency and rigor. This review searched six databases that cover topics from different disciplines considered relevant to the review research question. Gray literature was not searched as it was considered outside the scope of this review, meaning research published outside of academic journals was not included. This review is the first among reviews in this field to have summarized the direction of results and provide an overview of the findings. The scoring technique used in this review to rate outlets as healthy/unhealthy was based on ratings obtained from two Australian Delphi studies and may not accurately reflect all food outlets in other high‐income countries. The categories assigned to food outlets in this review, however, are aligned with previously published categorizations of food outlets in terms of their role in promoting healthy food choices across a range of high‐income countries 13 , 26 , 27 , 28 and offers a consistent approach to synthesizing existing evidence in this field. As discussed above, the approach taken to rate supermarkets as healthy environments may be problematic because these outlets typically sell a range of healthy and unhealthy items. Future research could explore more nuanced methods to categorize supermarket environments. As with many systematic reviews, publication bias may influence the studies included and, thus, affect the review's findings. Studies reporting significant findings may have been more successful in the publication process. Not being able to include results from unpublished studies may be skewing the overall direction of the evidence in this field; however, 82% of results considered in this review were not statistically significant. This review only included studies that have used an objective measure of community or consumer environment. While this may reduce subjectivity in assessing the exposure, previous research indicates that participants' perceptions of their environments can play an important role in determining their behaviors in or near those environments. 17 This review did not include online and digital food environments, which have been growing in popularity in recent years. 86 These types of online environments, particularly online food delivery services, may increase adolescents access and exposure to food outlets, particularly takeaway outlets, beyond those that are in their immediate geographic vicinity. Digital food environments may, therefore, be impacting adolescents' food purchasing and dietary behaviors in ways not considered in this review.
The studies included in this review were not suitable for including in a meta‐analysis because of the heterogeneity in study design. A direction‐based vote‐counting technique was, therefore, used to provide a quantitative summary of the evidence. As recommended by Cochrane, effect direction plots were also used to combine multiple findings from the same study, based on similar exposures and outcomes, to provide an overall direction of the study findings. 87 This technique allows for a quantitative summary of findings in addition to a narrative review and provides the reader with an overall sense of the direction of the associations on the topic. This approach, however, is limited by the fact that it does not recognize study size and the magnitude of associations investigated.
5. CONCLUSIONS
Adolescents' exposure to food outlets may be playing an important role in their autonomous food choices. There is moderate evidence that adolescents' exposure to food outlets categorized as unhealthy is associated with having unhealthier dietary behaviors; there is also some evidence that increased exposure to healthy food outlets may also be related to poorer dietary choices among this age group. Further research is needed to understand better how adolescents use their community nutrition environments in order to determine if policies that focus on limiting exposure to unhealthy food outlets around key locations, such as schools, are having the desired outcome. The evidence base investigating how the consumer nutrition environment affects adolescents' food choices is very limited. Further high‐quality intervention research is needed to provide insight into how factors inside food outlets can be manipulated in order to promote healthier food‐related behaviors during this key period of development.
AUTHOR CONTRIBUTIONS
The authors' responsibilities were as follows: SS and CV contributed to the conception and design of the research. SS conducted the literature search and screened the search returns. SS, MB and CS conducted data extraction and quality appraisal. CC, SC, DS, MB and CV advised on the systematic review process. All authors gave input to the interpretation of results, writing of the manuscript and approved the final copy.
CONFLICT OF INTEREST STATEMENT
SS, MB, CS, CC SC, DS, MB have no conflicts of interests to declare. CV has a non‐financial research collaboration with a UK supermarket chain. The study described in this manuscript is not related to this relationship.
Supporting information
Supplementary Table 1: Prisma 2020 Checklist
Supplementary Table 2 Full search strategy
Supplementary Table 3 Risk of Bias Assessment Criteria for Observational Studies
Supplementary Table 4 Risk of Bias Assessment Criteria for Intervention Studies
Supplementary Table 5 Risk of bias ratings for observational studies
Supplementary Table 6 Risk of bias ratings for intervention studies
Supplementary Table 7: Details of included observational studies
Supplementary Table 8: Details of included intervention studies
Supplementary Table 9: Vote‐counting results for observational studies
Supplementary Table 10: Vote‐counting results for intervention studies
ACKNOWLEDGMENTS
Not applicable.
Shaw S, Barrett M, Shand C, et al. Influences of the community and consumer nutrition environment on the food purchases and dietary behaviors of adolescents: A systematic review. Obesity Reviews. 2023;24(7):e13569. doi: 10.1111/obr.13569
PROSPERO Registration: CRD42019156500.
Funding information
This research and the authors of this paper are supported by the following funding sources: UK National Institute for Health Research Programme Grants for Applied Research (RP‐PG‐0216‐20004); UK Medical Research Council (MC_UU_12011/4), and National Institute for Health Research Southampton Biomedical Research Centre. The views expressed in this publication are those of the author(s) and not necessarily those of the National Health Service, the National Institute for Health Research, and the UK Department of Health and Social Care.
DATA AVAILABILITY STATEMENT
The data that support the findings of this review are available from the corresponding author upon reasonable request.
REFERENCES
- 1. Bates B, Cox L, Nicholson S, et al. National diet and nutrition survey results from years 5 and 6 (combined) of the Rolling Programme (2012/2013–2013/2014). PHE; 2016. [Google Scholar]
- 2. Doggui R, Ward S, Johnson C, Bélanger M. Trajectories of eating behaviour changes during adolescence. Nutrients. 2021;13(4):1313. doi: 10.3390/nu13041313 [DOI] [PMC free article] [PubMed] [Google Scholar]
- 3. Craigie AM, Lake AA, Kelly SA, Adamson AJ, Mathers JC. Tracking of obesity‐related behaviours from childhood to adulthood: a systematic review. Maturitas. 2011;70(3):266‐284. doi: 10.1016/j.maturitas.2011.08.005 [DOI] [PubMed] [Google Scholar]
- 4. Kelder SH, Perry CL, Klepp KI, Lytle LL. Longitudinal tracking of adolescent smoking, physical activity, and food choice behaviors. Am J Public Health. 1994;84(7):1121‐1126. doi: 10.2105/AJPH.84.7.1121 [DOI] [PMC free article] [PubMed] [Google Scholar]
- 5. Patton G, Sawyer S, Santelli J, et al. Our future: a Lancet commission on adolescent health and wellbeing. The Lancet. 2016;387(10036):2423‐2478. doi: 10.1016/S0140-6736(16)00579-1 [DOI] [PMC free article] [PubMed] [Google Scholar]
- 6. Bassett R, Chapman GE, Beagan BL. Autonomy and control: the co‐construction of adolescent food choice. Appetite. 2008;50(2):325‐332. doi: 10.1016/j.appet.2007.08.009 [DOI] [PubMed] [Google Scholar]
- 7. Glanz K, Sallis JF, Saelens BE, Frank LD. Healthy nutrition environments: concepts and measures. Am J Health Promot: AJHP. 2005;19(5):330‐333, ii. doi: 10.4278/0890-1171-19.5.330 [DOI] [PubMed] [Google Scholar]
- 8. Briefel RR, Wilson A, Gleason PM. Consumption of low‐nutrient, energy‐dense foods and beverages at school, home, and other locations among school lunch participants and nonparticipants. J am Diet Assoc. 2009;109(2):S79‐S90. doi: 10.1016/j.jada.2008.10.064 [DOI] [PubMed] [Google Scholar]
- 9. Tyrrell RL, Greenhalgh F, Hodgson S, et al. Food environments of young people: linking individual behaviour to environmental context. J Public Health (Oxf). 2017;39(1):95‐104. doi: 10.1093/pubmed/fdw019 [DOI] [PMC free article] [PubMed] [Google Scholar]
- 10. Toumpakari Z, Haase AM, Johnson L. Adolescents' non‐core food intake: a description of what, where and with whom adolescents consume non‐core foods. Public Health Nutr. 2016;19(9):1645‐1653. doi: 10.1017/S1368980016000124 [DOI] [PMC free article] [PubMed] [Google Scholar]
- 11. Toumpakari Z, Tilling K, Haase AM, Johnson L. High‐risk environments for eating foods surplus to requirements: a multilevel analysis of adolescents' non‐core food intake in the National Diet and Nutrition Survey (NDNS). Public Health Nutr. 2019;22(1):74‐84. doi: 10.1017/S1368980018002860 [DOI] [PMC free article] [PubMed] [Google Scholar]
- 12. Williams J, Scarborough P, Matthews A, et al. A systematic review of the influence of the retail food environment around schools on obesity‐related outcomes. Obes Rev. 2014;15(5):359‐374. doi: 10.1111/obr.12142 [DOI] [PubMed] [Google Scholar]
- 13. da Costa Peres CM, Gardone DS, Costa BVL, Duarte CK, Pessoa MC, Mendes LL. Retail food environment around schools and overweight: a systematic review. Nutr Rev. 2020;78(10):841‐856. doi: 10.1093/nutrit/nuz110 [DOI] [PubMed] [Google Scholar]
- 14. Li Y, Luo M, Wu X, Xiao Q, Luo J, Jia P. Grocery store access and childhood obesity: a systematic review and meta‐analysis. Obes Rev. 2021;22(Suppl 1):e12945. [DOI] [PMC free article] [PubMed] [Google Scholar]
- 15. Xin J, Zhao L, Wu T, et al. Association between access to convenience stores and childhood obesity: a systematic review. Obes Rev. 2021;22:e12908. [DOI] [PMC free article] [PubMed] [Google Scholar]
- 16. Zhou Q, Zhao L, Zhang L, et al. Neighborhood supermarket access and childhood obesity: a systematic review. Obes Rev. 2021;22(S1):e12937. doi: 10.1111/obr.12937 [DOI] [PMC free article] [PubMed] [Google Scholar]
- 17. Engler‐Stringer R, Le H, Gerrard A, Muhajarine N. The community and consumer food environment and children's diet: a systematic review. BMC Public Health. 2014;14(1):522. doi: 10.1186/1471-2458-14-522 [DOI] [PMC free article] [PubMed] [Google Scholar]
- 18. Page MJ, McKenzie JE, Bossuyt PM, et al. The PRISMA 2020 statement: an updated guideline for reporting systematic reviews. BMJ. 2021;372:n71. [DOI] [PMC free article] [PubMed] [Google Scholar]
- 19. Ouzzani M, Hammady H, Fedorowicz Z, Elmagarmid A. Rayyan — a web and mobile app for systematic reviews. Syst Rev. 2016;5(1):210. doi: 10.1186/s13643-016-0384-4 [DOI] [PMC free article] [PubMed] [Google Scholar]
- 20. HM Government . Schools, pupils and their characteristics. In, 2022.
- 21. Unicef . Secondary education. In, 2022.
- 22. Centre for Reviews and Dissemination . Systematic reviews: CRD's guidance for undertaking reviews in health care. University of York; 2008. [Google Scholar]
- 23. McKenzie JE, Brennan SE. Chapter 12: synthesizing and presenting findings using other methods. In: Higgins JPTTJ, Chandler J, et al., eds. Cochrane handbook for systematic reviews of interventions. Cochrane; 2018. [Google Scholar]
- 24. Moayyed H, Kelly B, Feng X, Flood V. Evaluation of a ‘healthiness’ rating system for food outlet types in Australian residential communities. Nutr Diet. 2017;74(1):29‐35. doi: 10.1111/1747-0080.12286 [DOI] [PubMed] [Google Scholar]
- 25. Thornton LE, Kavanagh AM. Association between fast food purchasing and the local food environment. Nutr Diabetes. 2012;2(12):e53. doi: 10.1038/nutd.2012.27 [DOI] [PMC free article] [PubMed] [Google Scholar]
- 26. Black C, Moon G, Baird J. Dietary inequalities: what is the evidence for the effect of the neighbourhood food environment? Health Place. 2014;27:229‐242. doi: 10.1016/j.healthplace.2013.09.015 [DOI] [PMC free article] [PubMed] [Google Scholar]
- 27. Wilding S, Ziauddeen N, Smith D, Roderick P, Chase D, Alwan NA. Are environmental area characteristics at birth associated with overweight and obesity in school‐aged children? Findings from the SLOPE (Studying Lifecourse Obesity PrEdictors) population‐based cohort in the south of England. BMC Med. 2020;18(1):43. doi: 10.1186/s12916-020-01513-0 [DOI] [PMC free article] [PubMed] [Google Scholar]
- 28. National Center for Chronic Disease Prevention and Health Promotion (U.S. Division of Nutrition PA, and Obesity . Census tract level state maps of the modified food environment index (mRFEI), 2012.
- 29. Vogel C, Lewis D, Ntani G, et al. The relationship between dietary quality and the local food environment differs according to level of educational attainment: a cross‐sectional study. PLoS ONE. 2017;12(8):e0183700. doi: 10.1371/journal.pone.0183700 [DOI] [PMC free article] [PubMed] [Google Scholar]
- 30. Boon MH, Thomson H. The effect direction plot revisited: application of the 2019 Cochrane handbook guidance on alternative synthesis methods. Res Synth Methods. 2021;12(1):29‐33. doi: 10.1002/jrsm.1458 [DOI] [PMC free article] [PubMed] [Google Scholar]
- 31. Shaw SC, Ntani G, Baird J, Vogel CA. A systematic review of the influences of food store product placement on dietary‐related outcomes. Nutr Rev. 2020;78(12):1030‐1045. doi: 10.1093/nutrit/nuaa024 [DOI] [PMC free article] [PubMed] [Google Scholar]
- 32. Lawman HG, Vander Veur S, Mallya G, et al. Changes in quantity, spending, and nutritional characteristics of adult, adolescent and child urban corner store purchases after an environmental intervention. Prev Med. 2015;74:81‐85. doi: 10.1016/j.ypmed.2014.12.003 [DOI] [PubMed] [Google Scholar]
- 33. Shin A, Surkan PJ, Coutinho AJ, et al. Impact of Baltimore healthy eating zones: an environmental intervention to improve diet among African American youth. Health Educ Behav. 2015;42(1_suppl):97S‐105S. doi: 10.1177/1090198115571362 [DOI] [PubMed] [Google Scholar]
- 34. An R, Sturm R. School and residential neighborhood food environment and diet among California youth. Am J Prev Med. 2012;42(2):129‐135. doi: 10.1016/j.amepre.2011.10.012 [DOI] [PMC free article] [PubMed] [Google Scholar]
- 35. Berge JM, Wall M, Larson N, Forsyth A, Bauer KW, Neumark‐Sztainer D. Youth dietary intake and weight status: healthful neighborhood food environments enhance the protective role of supportive family home environments. Health Place. 2014;26:69‐77. doi: 10.1016/j.healthplace.2013.11.007 [DOI] [PMC free article] [PubMed] [Google Scholar]
- 36. Clark EM, Quigg R, Wong JE, Richards R, Black KE, Skidmore PM. Is the food environment surrounding schools associated with the diet quality of adolescents in Otago, New Zealand? Health Place. 2014;30:78‐85. doi: 10.1016/j.healthplace.2014.08.008 [DOI] [PubMed] [Google Scholar]
- 37. Cutumisu N, Traore I, Paquette MC, et al. Association between junk food consumption and fast‐food outlet access near school among Quebec secondary‐school children: findings from the Quebec Health Survey of High School Students (QHSHSS) 2010–11. Public Health Nutr. 2017;20(5):927‐937. doi: 10.1017/S136898001600286X [DOI] [PMC free article] [PubMed] [Google Scholar]
- 38. Davis B, Carpenter C. Proximity of fast‐food restaurants to schools and adolescent obesity. Am J Public Health. 2009;99(3):505‐510. doi: 10.2105/AJPH.2008.137638 [DOI] [PMC free article] [PubMed] [Google Scholar]
- 39. Forsyth A, Wall M, Larson N, Story M, Neumark‐Sztainer D. Do adolescents who live or go to school near fast‐food restaurants eat more frequently from fast‐food restaurants? Health Place. 2012;18(6):1261‐1269. doi: 10.1016/j.healthplace.2012.09.005 [DOI] [PMC free article] [PubMed] [Google Scholar]
- 40. Godin KM, Chaurasia A, Hammond D, Leatherdale ST. Examining associations between school food environment characteristics and sugar‐sweetened beverage consumption among Canadian secondary‐school students in the COMPASS study. Public Health Nutr. 2019;22(11):1928‐1940. doi: 10.1017/S1368980018001246 [DOI] [PMC free article] [PubMed] [Google Scholar]
- 41. Grier S, Davis B. Are all proximity effects created equal? Fast food near schools and body weight among diverse adolescents. J Public Policy Mark. 2013;32(1):116‐128. doi: 10.1509/jppm.11.158 [DOI] [Google Scholar]
- 42. Hager ER, Cockerham A, O'Reilly N, et al. Food swamps and food deserts in Baltimore City, MD, USA: associations with dietary behaviours among urban adolescent girls. Public Health Nutr. 2017;20(14):2598‐2607. doi: 10.1017/S1368980016002123 [DOI] [PMC free article] [PubMed] [Google Scholar]
- 43. He M, Tucker P, Gilliland J, Irwin JD, Larsen K, Hess P. The influence of local food environments on adolescents' food purchasing behaviors. Int J Environ Res Public Health. 2012;9(4):1458‐1471. doi: 10.3390/ijerph9041458 [DOI] [PMC free article] [PubMed] [Google Scholar]
- 44. He M, Tucker P, Irwin JD, Gilliland J, Larsen K, Hess P. Obesogenic neighbourhoods: the impact of neighbourhood restaurants and convenience stores on adolescents' food consumption behaviours. Public Health Nutr. 2012;15(12):2331‐2339. doi: 10.1017/S1368980012000584 [DOI] [PMC free article] [PubMed] [Google Scholar]
- 45. Jago R, Baranowski T, Baranowski JC, Cullen KW, Thompson D. Distance to food stores & adolescent male fruit and vegetable consumption: mediation effects. Int J Behav Nutr Phys Act. 2007;4(1):35. doi: 10.1186/1479-5868-4-35 [DOI] [PMC free article] [PubMed] [Google Scholar]
- 46. Kelly C, Callaghan M, Molcho M, Nic Gabhainn S, Alforque Thomas A. Food environments in and around post‐primary schools in Ireland: associations with youth dietary habits. Appetite. 2019;132:182‐189. doi: 10.1016/j.appet.2018.08.021 [DOI] [PubMed] [Google Scholar]
- 47. Laska MN, Hearst MO, Forsyth A, Pasch KE, Lytle L. Neighbourhood food environments: are they associated with adolescent dietary intake, food purchases and weight status? Public Health Nutr. 2010;13(11):1757‐1763. doi: 10.1017/S1368980010001564 [DOI] [PMC free article] [PubMed] [Google Scholar]
- 48. Laxer RE, Janssen I. The proportion of excessive fast‐food consumption attributable to the neighbourhood food environment among youth living within 1 km of their school. Appl Physiol Nutr Metab. 2014;39(4):480‐486. doi: 10.1139/apnm-2013-0208 [DOI] [PubMed] [Google Scholar]
- 49. Loh VH, Poelman M, Veitch J, McNaughton SA, Leech R, Timperio A. Neighbourhood food typologies, fast food outlet visitation and snack food purchasing among adolescents in Melbourne, Australia. Public Health Nutr. 2022;25(3):729‐737. doi: 10.1017/S1368980021004298 [DOI] [PMC free article] [PubMed] [Google Scholar]
- 50. Longacre MR, Drake KM, MacKenzie TA, et al. Fast‐food environments and family fast‐food intake in nonmetropolitan areas. Am J Prev Med. 2012;42(6):579‐587. doi: 10.1016/j.amepre.2012.02.017 [DOI] [PMC free article] [PubMed] [Google Scholar]
- 51. Powell LM, Han E. The costs of food at home and away from home and consumption patterns among US adolescents. J Adolesc Health. 2011;48(1):20‐26. doi: 10.1016/j.jadohealth.2010.06.006 [DOI] [PubMed] [Google Scholar]
- 52. Sadler RC, Clark AF, Wilk P, O'Connor C, Gilliland JA. Using GPS and activity tracking to reveal the influence of adolescents' food environment exposure on junk food purchasing. Can J Public Health. 2016;107(1):eS14‐eS20. doi: 10.17269/CJPH.107.5346 [DOI] [PMC free article] [PubMed] [Google Scholar]
- 53. Seliske L, Pickett W, Rosu A, Janssen I. The number and type of food retailers surrounding schools and their association with lunchtime eating behaviours in students. Int J Behav Nutr Phys Act. 2013;10(1):19. doi: 10.1186/1479-5868-10-19 [DOI] [PMC free article] [PubMed] [Google Scholar]
- 54. Shareck M, Lewis D, Smith NR, Clary C, Cummins S. Associations between home and school neighbourhood food environments and adolescents' fast‐food and sugar‐sweetened beverage intakes: findings from the Olympic Regeneration in East London (ORiEL) Study. Public Health Nutr. 2018;21(15):2842‐2851. doi: 10.1017/S1368980018001477 [DOI] [PMC free article] [PubMed] [Google Scholar]
- 55. Shearer C, Rainham D, Blanchard C, Dummer T, Lyons R, Kirk S. Measuring food availability and accessibility among adolescents: moving beyond the neighbourhood boundary. Soc Sci Med. 2015;133:322‐330. doi: 10.1016/j.socscimed.2014.11.019 [DOI] [PubMed] [Google Scholar]
- 56. Shier V, Nicosia N, Datar A. Neighborhood and home food environment and children's diet and obesity: evidence from military personnel's installation assignment. Soc Sci Med. 2016;158:122‐131. doi: 10.1016/j.socscimed.2016.03.043 [DOI] [PMC free article] [PubMed] [Google Scholar]
- 57. Smith D, Cummins S, Clark C, Stansfeld S. Does the local food environment around schools affect diet? Longitudinal associations in adolescents attending secondary schools in East London. BMC Public Health. 2013;13(1):70. doi: 10.1186/1471-2458-13-70 [DOI] [PMC free article] [PubMed] [Google Scholar]
- 58. Svastisalee CM, Holstein BE, Due P. Fruit and vegetable intake in adolescents: association with socioeconomic status and exposure to supermarkets and fast food outlets. J Nutr Metab. 2012;2012:185484. doi: 10.1155/2012/185484 [DOI] [PMC free article] [PubMed] [Google Scholar]
- 59. Svastisalee C, Pagh Pedersen T, Schipperijn J, Jorgensen SE, Holstein BE, Krolner R. Fast‐food intake and perceived and objective measures of the local fast‐food environment in adolescents. Public Health Nutr. 2016;19(3):446‐455. doi: 10.1017/S1368980015001366 [DOI] [PMC free article] [PubMed] [Google Scholar]
- 60. Timperio A, Crawford D, Leech RM, Lamb KE, Ball K. Patterning of neighbourhood food outlets and longitudinal associations with children's eating behaviours. Prev Med. 2018;111:248‐253. doi: 10.1016/j.ypmed.2018.03.003 [DOI] [PubMed] [Google Scholar]
- 61. Trapp GSA, Hooper P, Thornton L, et al. Association between food‐outlet availability near secondary schools and junk‐food purchasing among Australian adolescents. Nutrition. 2021;91:111488. [DOI] [PubMed] [Google Scholar]
- 62. van der Horst K, Timperio A, Crawford D, Roberts R, Brug J, Oenema A. The school food environment associations with adolescent soft drink and snack consumption. Am J Prev Med. 2008;35(3):217‐223. doi: 10.1016/j.amepre.2008.05.022 [DOI] [PubMed] [Google Scholar]
- 63. Virtanen M, Kivimaki H, Ervasti J, et al. Fast‐food outlets and grocery stores near school and adolescents' eating habits and overweight in Finland. Eur J Public Health. 2015;25(4):650‐655. doi: 10.1093/eurpub/ckv045 [DOI] [PubMed] [Google Scholar]
- 64. Edmonds J, Baranowski T, Baranowski J, Cullen KW, Myres D. Ecological and socioeconomic correlates of fruit, juice, and vegetable consumption among African‐American boys. Prev Med. 2001;32(6):476‐481. doi: 10.1006/pmed.2001.0831 [DOI] [PubMed] [Google Scholar]
- 65. Gustafson A, Jilcott Pitts S, McDonald J, et al. Direct effects of the home, school, and consumer food environments on the association between food purchasing patterns and dietary intake among rural adolescents in Kentucky and North Carolina, 2017. Int J Environ Res Public Health. 2017;14(10):21. doi: 10.3390/ijerph14101255 [DOI] [PMC free article] [PubMed] [Google Scholar]
- 66. Khan T, Powell LM, Wada R. Fast food consumption and food prices: evidence from panel data on 5th and 8th grade children. J Obes. 2012;2012:1, 857697‐8. doi: 10.1155/2012/857697 [DOI] [PMC free article] [PubMed] [Google Scholar]
- 67. Sturm R, Datar A. Regional price differences and food consumption frequency among elementary school children. Public Health. 2011;125(3):136‐141. doi: 10.1016/j.puhe.2010.11.016 [DOI] [PMC free article] [PubMed] [Google Scholar]
- 68. Adam A, Jensen JD. What is the effectiveness of obesity related interventions at retail grocery stores and supermarkets? A systematic review. BMC Public Health. 2016;16(1):1247. doi: 10.1186/s12889-016-3985-x [DOI] [PMC free article] [PubMed] [Google Scholar]
- 69. Cameron AJ, Charlton E, Ngan WW, Sacks G. A systematic review of the effectiveness of supermarket‐based interventions involving product, promotion, or place on the healthiness of consumer purchases. Curr Nutr Rep. 2016;5(3):129‐138. doi: 10.1007/s13668-016-0172-8 [DOI] [Google Scholar]
- 70. Gittelsohn J, Trude ACB, Kim H. Pricing strategies to encourage availability, purchase, and consumption of healthy foods and beverages: a systematic review. Prev Chronic Dis. 2017;14:E107. doi: 10.5888/pcd14.170213 [DOI] [PMC free article] [PubMed] [Google Scholar]
- 71. Hartmann‐Boyce J, Bianchi F, Piernas C, et al. Grocery store interventions to change food purchasing behaviors: a systematic review of randomized controlled trials. Am J Clin Nutr. 2018;107(6):1004‐1016. doi: 10.1093/ajcn/nqy045 [DOI] [PMC free article] [PubMed] [Google Scholar]
- 72. Kelly C, Callaghan M, Gabhainn SN. ‘It's hard to make good choices and it costs more’: adolescents' perception of the external school food environment. Nutrients. 2021;13(4):1043. doi: 10.3390/nu13041043 [DOI] [PMC free article] [PubMed] [Google Scholar]
- 73. Shaw S, Muir S, Strommer S, et al. Exploring the combined influence of the social and physical food environments on adolescent food choice: a qualitative study. Manuscript in preparation. 2022.
- 74. Black C, Ntani G, Inskip H, et al. Measuring the healthfulness of food retail stores: variations by store type and neighbourhood deprivation. Int J Behav Nutr Phys Act. 2014;11(1):69. doi: 10.1186/1479-5868-11-69 [DOI] [PMC free article] [PubMed] [Google Scholar]
- 75. Kersten E, Laraia B, Kelly M, Adler N, Yen IH. Small food stores and availability of nutritious foods: a comparison of database and in‐store measures, Northern California, 2009. Prev Chronic Dis. 2012;9:E127. [DOI] [PMC free article] [PubMed] [Google Scholar]
- 76. Charlton EL, Kähkönen LA, Sacks G, Cameron AJ. Supermarkets and unhealthy food marketing: an international comparison of the content of supermarket catalogues/circulars. Prev Med. 2015;81:168‐173. doi: 10.1016/j.ypmed.2015.08.023 [DOI] [PubMed] [Google Scholar]
- 77. Hendriksen A, Jansen R, Dijkstra SC, Huitink M, Seidell JC, Poelman MP. How healthy and processed are foods and drinks promoted in supermarket sales flyers? A cross‐sectional study in the Netherlands. Public Health Nutr. 2021;24(10):3000‐3008. doi: 10.1017/S1368980021001233 [DOI] [PMC free article] [PubMed] [Google Scholar]
- 78. Kirkpatrick SI, Reedy J, Butler EN, et al. Dietary assessment in food environment research: a systematic review. Am J Prev Med. 2014;46(1):94‐102. doi: 10.1016/j.amepre.2013.08.015 [DOI] [PMC free article] [PubMed] [Google Scholar]
- 79. Cetateanu A, Jones A. How can GPS technology help us better understand exposure to the food environment? A systematic review. SSM ‐ Population Health. 2016;2:196‐205. doi: 10.1016/j.ssmph.2016.04.001 [DOI] [PMC free article] [PubMed] [Google Scholar]
- 80. Liu B, Widener M, Burgoine T, Hammond D. Association between time‐weighted activity space‐based exposures to fast food outlets and fast food consumption among young adults in urban Canada. Int J Behav Nutr Phys Act. 2020;17(1):62. doi: 10.1186/s12966-020-00967-y [DOI] [PMC free article] [PubMed] [Google Scholar]
- 81. County Health Rankings and Roadmaps. Zoning regulations for fast food. In, 2020.
- 82. Wicklow County Council . Wicklow County Development Plan 2016‐2022, 2016.
- 83. Keeble M, Burgoine T, White M, Summerbell C, Cummins S, Adams J. How does local government use the planning system to regulate hot food takeaway outlets? A census of current practice in England using document review. Health Place. 2019;57:171‐178. doi: 10.1016/j.healthplace.2019.03.010 [DOI] [PMC free article] [PubMed] [Google Scholar]
- 84. Department for Health and Social Care . Restricting promotions of products high in fat, sugar and salt by location and by price: government response to public consultation. In, 2020.
- 85. Department of Health and Social Care . Restricting promotions of products high in fat, sugar or salt by location and by volume price: implementation guidance, 2022.
- 86. Granheim SI, Løvhaug AL, Terragni L, Torheim LE, Thurston M. Mapping the digital food environment: a systematic scoping review. Obes Rev. 2022;23(1):e13356. doi: 10.1111/obr.13356 [DOI] [PubMed] [Google Scholar]
- 87. McKenzie JE, Brennan SE. Chapter 12: synthesizing and presenting findings using other methods. In: Higgins JPT, Thomas J, Chandler J, et al., eds. Cochrane handbook for systematic reviews of interventions. Cochrane; 2018. (draft version) [Google Scholar]
Associated Data
This section collects any data citations, data availability statements, or supplementary materials included in this article.
Supplementary Materials
Supplementary Table 1: Prisma 2020 Checklist
Supplementary Table 2 Full search strategy
Supplementary Table 3 Risk of Bias Assessment Criteria for Observational Studies
Supplementary Table 4 Risk of Bias Assessment Criteria for Intervention Studies
Supplementary Table 5 Risk of bias ratings for observational studies
Supplementary Table 6 Risk of bias ratings for intervention studies
Supplementary Table 7: Details of included observational studies
Supplementary Table 8: Details of included intervention studies
Supplementary Table 9: Vote‐counting results for observational studies
Supplementary Table 10: Vote‐counting results for intervention studies
Data Availability Statement
The data that support the findings of this review are available from the corresponding author upon reasonable request.