

Summary
Obesity may track across generations, due to genetics and shared family environmental factors, or possibly intrauterine programming. However, many studies only assess associations between maternal body mass index (BMI) and offspring BMI in childhood. To determine whether maternal and paternal associations with offspring BMI differ and whether associations persist into adulthood, a systematic review and meta‐analysis was done. PubMed, Embase, Web of Science, and Google Scholar (to October 2022) were searched. Observational studies reporting associations between maternal or paternal BMI and adult offspring BMI were included. Offspring BMIs were reported as continuous or categorical measures. Forty‐six studies were included in the systematic review. Meta‐analyses were conducted using random‐effects models. Parental BMI was positively associated with offspring BMI in adulthood. The pooled mother–offspring standardized mean difference (SMD) was 0.23 (95% confidence interval [CI]: 0.20, 0.26), and father–offspring SMD was similar: 0.22 (95% CI: 0.19, 0.25) in adjusted models. Offspring of mothers with overweight or obesity had the same risk of higher BMI as offspring of fathers with overweight or obesity. If these associations are causal, they support interventions targeting all family members, rather than focusing solely on mothers, to obtain a healthy weight development among offspring.
Keywords: adult offspring, body mass index, intergenerational, systematic review
Abbreviations
- BMI
body mass index
- CI
confidence interval
- MD
mean difference
- OR
odds ratio
- ROR
ratio of odds ratio
- RR
risk ratio
- SMD
standardized mean difference
1. INTRODUCTION
Obesity represents one of the most urgent national and global health challenges because of its high prevalence and long‐term adverse health consequences. 1 Familial resemblance in body mass index (BMI) is well recognized. 2 To date, multiple studies have explored parental–offspring BMI associations and linked adiposity in parents with unfavorable offspring body composition and related morbidity (e.g., diabetes, cardiovascular and metabolic diseases). 3 , 4
The causes of the intergenerational association are unclear. Genetic predisposition, family socioeconomic status, and lifestyle factors (e.g., diet, physical activity) have been implicated. 5 , 6 In addition to the above factors, mothers with a higher BMI during pregnancy might increase the risk of their offspring becoming overweight via the fetal environment according to the “fetal overnutrition” hypothesis. 7 , 8 The hypothesis suggests that maternal nutritional imbalance during gestation can alter metabolic processes, including the hypothalamic response to leptin and subsequent regulation of appetite and pancreatic beta‐cell physiology, and have a persistent effect on offspring adiposity development. 9 This hypothesis is supported by some animal studies, 10 , 11 yet the evidence is mixed in human studies. 12 , 13 However, novel evidence from Mendelian randomization studies that use maternal genetic variants adjusted for offspring genetic variants as unconfounded instrumental variables for an intrauterine exposure casts doubt on the causal effect of maternal pregnancy adiposity. 14 , 15 Furthermore, “negative control” studies, which used paternal adiposity as a control and compared mother–offspring and father–offspring BMI associations suggest that maternal associations may be explained by family confounding. 6 , 16 If there is a causal in utero effect, the association between parental and offspring BMI should be stronger in the maternal line than in the paternal line. 17 There is also growing interest to investigate whether any such association differs between daughters and sons. Comparison between the same‐sex (mother–daughter, father–son) versus cross‐sex (mother–son, father–daughter) transmission would provide more insight into understanding the mechanisms underlying the association. If a stronger same‐sex association is observed, it might imply that shared environment rather than genes is the driver because selective mother–daughter and father–son gene transmission is not a common Mendelian trait. 18 However, no consistent patterns have been identified so far, making it difficult to draw conclusions. While previous systematic reviews have assessed associations between parental BMI and BMI of the offspring during childhood, 6 , 19 few have investigated sex‐specific parental–offspring BMI associations, and very little is known about the strength of associations with offspring in adulthood. We undertook this systematic review and meta‐analyses to quantify the strengths of associations between parental BMI and that of their adult offspring, separately by maternal and paternal lines. The objectives of the present study were threefold: (i) to synthesize data from studies published from 1980 to 2022, thus investigating whether parental BMI is persistently associated with offspring BMI in adulthood; (ii) to explore the difference in maternal or paternal associations with adult offspring BMI and compare the associations for maternal and paternal lines; and (iii) to assess same‐sex (mother–daughter, father–son) and cross‐sex (mother–son, father–daughter) parent‐offspring BMI associations.
2. METHODS
The meta‐analysis was reported according to the Meta‐analysis of Observational Studies in Epidemiology (MOOSE) checklists. 20 The study was registered in PROSPERO (CRD42020159281), an international database of prospectively registered systematic reviews.
2.1. Search strategy
We carried out a systematic literature search of PubMed, Embase, Web of Science, and Google Scholar using predefined search terms (Appendix in the Supporting Information). Searches were restricted to human studies published in English, full‐text articles published after 1980. The reference lists of all studies that met the inclusion criteria and all related systematic reviews were searched by J.Z., H.T.V., and C.C.D. Citation searches for all studies that met the inclusion criteria and all related systematic reviews were performed using Google Scholar Citations. Authors of included studies were contacted for additional data when required for inclusion in the meta‐analyses. Database searches were completed in August 2019 and updated in October 2022.
2.2. Study eligibility criteria
2.2.1. Inclusion criteria
Inclusion criteria were peer‐reviewed studies reporting both the exposure variable (maternal BMI or paternal BMI) and the outcome variable (offspring BMI) among offspring aged 18 years or older. Exposure and outcome variables could be either continuous or categorical. To be included, studies must have been published as full texts written in English, and the findings expressed as correlation or regression coefficients, or odds ratios (OR) or risk ratios (RR) with some measure of variability such as 95% confidence intervals (CIs) or standard errors. Studies reporting offspring BMI in late adolescence/early adulthood (reporting any offspring aged 18 years or older) were included. In cohort studies that looked at three generations, only the first two generations, that is, grandparents and parents, were included when the youngest (third) generation was less than 18 years of age. We reported offspring BMI as a continuous measure as the primary outcome. Where studies were based on the same cohort (e.g., 1958 British birth cohort) and the same participants, we chose the study with the larger study population or older age group.
2.2.2. Study selection
Three assessors (J.Z., H.T.V., M.L.L.) independently reviewed the titles and abstracts of all identified citations using Covidence online software (Covidence.org). 21 Each full‐text article was independently evaluated by three reviewers (J.Z., C.C.D., H.T.V.). Disagreements were settled by discussion and consensus, with the third reviewer (C.C.D.) available as an adjudicator.
2.2.3. Data extraction
A piloted data collection form was used by three reviewers (J.Z., C.C.D., H.T.V.) to independently extract the following data from full‐text articles: study design, years of study, study origin (country), study setting, sample size, assessment methods of weight and height information, when BMI was ascertained, whether maternal BMI pertained to pre‐pregnancy, and reported measures of association. We included information available from the publications. Inconsistencies were checked and resolved through the consensus process described earlier.
2.3. Data synthesis
2.3.1. Primary outcome (difference in mean BMI)
We extracted correlation coefficients (r) or regression coefficients (mean difference [MD] or standardized mean difference [SMD]) for continuous outcomes. As studies varied in reporting associations between different familial groupings, we summarized two levels of family relationship groups: (i) sex‐specific at parental level and offspring level: mother–daughter, mother–son, father–daughter, and father–son; (ii) sex‐specific at parental level: mother–offspring and father–offspring. When measures of association were reported by offspring sex at parental and offspring level, we used methods proposed by Borenstein et al 22 to combine father–offspring (or mother–offspring) from sex‐specific associations (father–daughter and father–son, or mother–daughter and mother–son) and assumed varying correlations (ranging from 0 to 0.3) depending on the study design and analysis of the study to account for dependency. For example, we assumed a correlation of 0.3 where multilevel models had accounted for the structure of the data while we assumed a correlation of 0 in models with, for example, fathers with only one child. An inverse variance‐weighted fixed‐effects model was used to pool the sex‐specific associations to either father–offspring or mother–offspring. Finally, a random‐effects meta‐analysis was used to synthesize the overall parental–offspring association to help account for between study differences. We therefore report the average association based on the distribution of study estimates while also describing any between‐study heterogeneity. 23
For data from regression models (where offspring BMI could be in kg/m2 or SD units), we separately extracted regression coefficients that were (i) MD per kg/m2 difference in parental BMI and (ii) SMD per SD difference in parental BMI. 24 , 25 , 26 , 27 We then transformed studies reporting MD per kg/m2 difference in parental BMI to SD units so that (i) and (ii) could be combined to increase power. Regression coefficients from multilevel models were treated as standard regression models. For studies reporting correlation coefficients (r), data were transformed with Fisher's Z scale, and via the inverse Fisher's Z transformation to r. The correlation coefficients were combined with unadjusted regression coefficients for the unadjusted data synthesis. The unadjusted and adjusted data (minimally adjusted for offspring's age and sex) were synthesized separately.
Furthermore, we tested whether there were differences between mother–offspring and father–offspring associations. Differences in SMD or MD were calculated for continuous outcomes. To explore the “fetal overnutrition” hypothesis, we compared the strength of associations restricted to studies that assessed parental BMI either before/during early pregnancy or if there were few studies, when the children were young.
Forest plots were constructed to display the individual and aggregate measures of association and their corresponding 95% CIs, in addition to tables presenting the aggregate results. We reported the I 2 statistic, which describes the percentage of the total variation across studies that is estimated to be due to between‐study heterogeneity.
2.3.2. Secondary outcome (odds/risk of offspring being overweight or with obesity)
ORs and RRs and either their standard errors or 95% CI were directly extracted from study results. Because few studies reported obesity prevalence of more than 20% or reported RRs, ORs and RRs were summarized together. 28 Studies varied in reporting parental or offspring weight status using different criteria, different reference groups (e.g., mother with normal weight, father with normal weight, both parents with normal weight), or varied in stratifying sex‐specific associations (e.g., mother/father–daughter, mother/father–son association, parent–daughter/parent–son association, or mother/father–offspring, or parent–offspring), precluding synthesizing results to a meaningful single summary OR. We therefore present forest plots showing individual study results without pooling ORs. 29
2.4. Subgroup analyses
The following subgroup analyses were specified a priori for the primary analysis, where data were available: (i) BMI assessment method: measured versus self‐reported; (ii) study design: cross‐sectional study versus longitudinal study; (iii) maternal BMI measured before pregnancy versus after pregnancy; (iv) offspring age: early adulthood (younger than 30 years), mid‐adulthood (30–40 years), and later adulthood (older than 40 years).
2.5. Quality assessment
Quality assessment was done by two reviewers (J.Z. and C.C.D.) using a Newcastle–Ottawa scale (Appendix in the Supporting Information). The Newcastle–Ottawa scale evaluated the study design, representativeness of the exposed cohort, selection of the non‐exposed cohort, ascertainment of exposure, demonstration that outcome of interest was not present at start of study, comparability of cohorts on the basis of the design or analysis, assessment of offspring BMI, whether all adult participants in the analysis were the target age of the research question, 30 and the adequacy of follow‐up of cohorts. We also considered how missing data were handled, whether studies included only biological parents and children (non‐paternity). We considered studies to have adjusted for confounding of the parental–offspring association if they had adjusted for the following: maternal age, family socioeconomic factors, smoking, drinking, and child sex. Studies were awarded one point per fulfilled criteria. We considered a total score ≥6 as good quality and a score of ≤3 as poor quality.
2.6. Post hoc analyses and publication bias
We conducted post hoc analyses by (i) parental and offspring BMI assessment time: similar young age (parental BMI measured before or during pregnancy‐offspring followed until early adulthood); late aged parent and young child (parental BMI measured at late age, when the child was school age, child BMI measured at young adulthood); parental mid/late age (both parental BMI and offspring BMI measured at mid or late adulthood); (ii) excluding seven studies 27 , 31 , 32 , 33 , 34 , 35 , 36 (15% of studies and 5% of participants) that measured offspring BMI with some participants younger than 18 years (age range 15–25 years); or (iii) took out three studies 26 , 32 , 37 with poor quality scores. To evaluate the potential effect of unpublished studies on our main findings (due to asymmetry or publication bias), we produced funnel plots and conducted Egger's regression. 38
All analyses were conducted using the metan command in Stata BE version 17 39 (StataCorp, College Station, TX, USA).
3. RESULTS
3.1. Descriptive statistics
The searches identified 32,689 studies, of which 90 met the abstract inclusion criteria. Of the studies that met the initial abstract screening, 44 were excluded from the review, because: study subjects were not adult offspring (n = 22), wrong exposure or outcome (n = 10), adiposity was not assessed by BMI (n = 3), exposure or outcome were BMI change (n = 4), articles were not in English (n = 1), wrong comparator (n = 1), wrong study design (n = 1), same cohort (n = 1), or conference abstract (n = 1). This resulted in 46 publications in the review (Figure S1). Of these studies, 26 were cohort studies, and 20 were cross‐sectional studies. Study populations were from Australia, Asia, Europe, and North and South America. Most of the studies included parent–offspring pairs and trios, with sample sizes ranging from 32 mother–daughter dyads 32 to 36,528 father–mother–offspring trios. 40 Two studies used a three‐generation cohort. 41 , 42 Parental and offspring BMIs were examined at different life stages across studies. Most cohort studies assessed parental BMI before/during early pregnancy and assessed child's BMI at early adulthood; nine cohort studies assessed parental BMI when children were young (mostly school age) and assessed the child's BMI at adulthood. 17 , 25 , 26 , 43 , 44 , 45 , 46 , 47 Cross‐sectional studies collected parental anthropometric information in parallel with that of the adult offspring. Study populations generally consisted of middle‐aged parents and young adult children 31 , 32 , 33 , 34 , 37 , 48 , 49 , 50 , 51 , 52 , 53 , 54 or both parents and children in middle or late adulthood. 18 , 24 , 40 , 41 , 42 , 55 , 56 The information extracted from each study is presented in Table S1.
Various statistical methods were employed to analyze the relationship between parental BMI and adult offspring BMI. These included correlation coefficient methods, linear regression models, logistic or multinomial models, and multilevel models.
Most linear regression studies adjusted for family socioeconomic factors, maternal age, smoking, drinking, and other important confounders (Figure S2 depicting our directed acyclic diagram). The majority of studies found positive associations between parents and their adult offspring BMI, while four studies reported null associations. 26 , 37 , 41 , 53 Several studies investigated sex‐specific associations and compared the same‐sex (mother–daughter, or father–son) or cross‐sex (mother–son, father–daughter) relationships within the same population. 18 , 24 , 25 , 54 , 57 Conclusions regarding the findings for these sex‐specific results varied between the studies. Detailed information is found in Tables S2–S4.
3.2. SMD for continuous measures of BMI
Associations of continuous measures of maternal and/or paternal BMI with offspring BMI were reported in 35 studies. These studies used different BMI units and not all adjusted for potential confounders. We therefore pooled results separately for (i) confounder‐adjusted SMD (n = 15 studies), (ii) unadjusted (for any covariates) SMD (n = 21), and (iii) confounder‐adjusted associations with parental and offspring BMI in 1 kg/m2 units (n = 9).
Across all of these studies, results were consistent with similar positive associations for mother–offspring and father–offspring. For example, the pooled analyses showed that the mother–offspring SMD was 0.23 (95% CI: 0.20, 0.26 per SD greater maternal BMI), and the father–offspring was 0.22 (95% CI: 0.19, 0.25 per SD greater paternal BMI) in adjusted models (Figure 1). The equivalent unadjusted SMD results were 0.24 (95% CI: 0.21, 0.28) for mother–offspring and 0.21(95% CI: 0.18, 0.25) for father–offspring (Figure S3A, with additional result in Table S5). There was evidence of between study heterogeneity in both analyses (I 2% = 79% for mother–offspring, I 2% = 68% for father–offspring). The synthesized sex‐specific adjusted and unadjusted SMDs revealed similar positive associations for mother–daughter, mother–son, father–daughter, and father–son (Figure 2, Figure 3B, Table S5).
FIGURE 1.
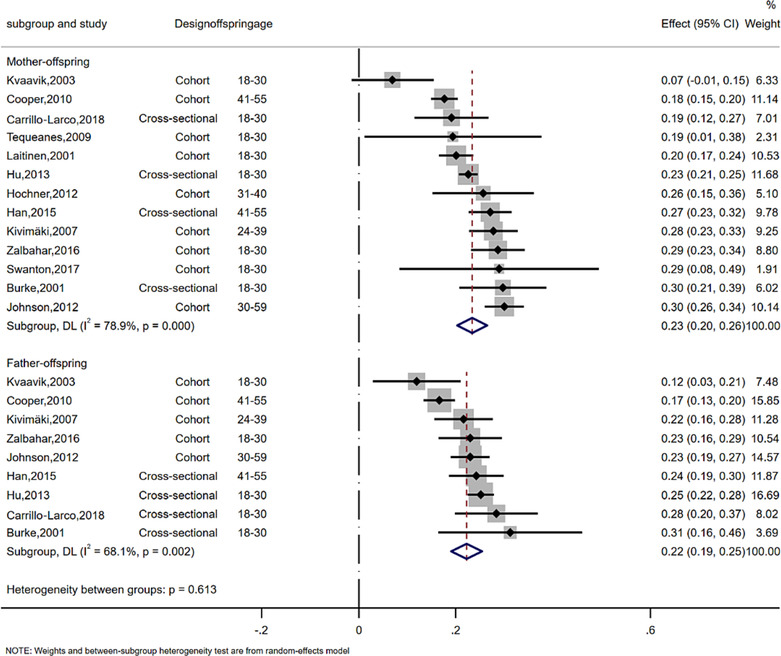
Meta‐analysis of the association between parent and offspring BMI (SMD). The effect size estimate is the SMD with 95% CI (per SD of parental BMI). The size of the squares' estimates is proportional to the weight assigned to each study. Diamonds represent pooled estimates from a random effects meta‐analysis. The I 2 and P values for heterogeneity are shown. BMI, body mass index; CI, confidence interval; SD, standard deviation; SMD, standardized mean difference.
FIGURE 2.
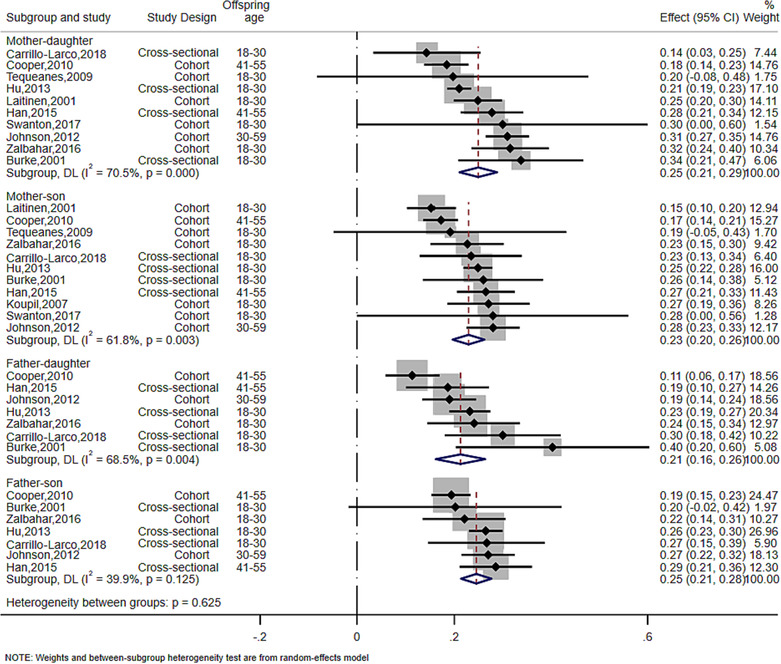
Meta‐analysis of the association between parent and offspring BMI at sex‐specific level (SMD). The effect size estimate is the SMD with 95% CI (per SD of parental BMI). The size of the squares' estimates is proportional to the weight assigned to each study. Diamonds represent pooled estimates from a random effects meta‐analysis. The I 2 and P values for heterogeneity are shown. BMI, body mass index; CI, confidence interval; SD, standard deviation; SMD, standardized mean difference.
FIGURE 3.
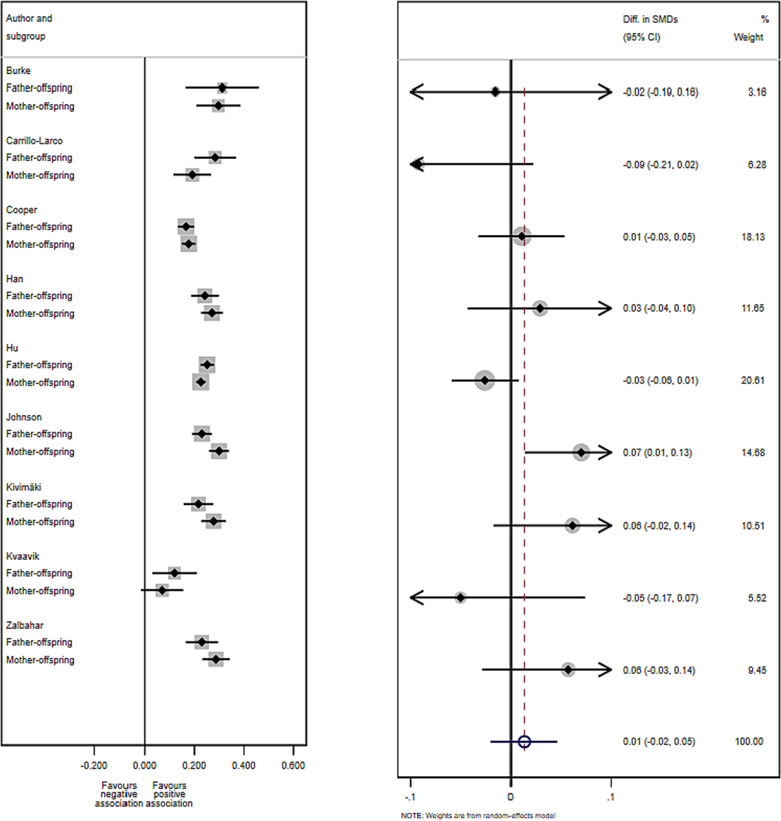
Difference in SMD between mother–offspring and father–offspring BMI associations. Left plot: SMD (95% CI) in each subgroup of each study. Right plot: Difference of SMD comparing effects for mother–offspring and father–offspring in each study with a fixed‐effects meta‐analysis of these differences of SMD. The size of the squares and circles is proportional to the weight assigned to each study. Open circles represent pooled estimates. CI, confidence interval; SMD, standardized mean difference.
Pooled results from 15 studies of the mean difference in offspring BMI (kg/m2) per 1 kg/m2 parental BMI were consistent with those for the SMD. There were also high levels of between study heterogeneity (Figure S4A, Figure S4B, and Table S6).
We then compared the strength of associations between maternal and paternal BMI and offspring BMI by calculating the difference in SMD. There was no strong evidence for differences by offspring gender for either maternal or paternal associations (difference in SMD = 0.01, 95% CI: −0.02, 0.05; Figure 3). Similar approaches were applied to unadjusted SMD and MD, and the results remained similar (Figure S5, Figure S6, and Tables S7–S9).
There was no evidence of a difference between maternal and paternal BMI–offspring BMI associations when restricting to studies assessing parental BMI when the children were young (difference in SMD = 0.02, 95% CI: −0.01, 0.05; Figure S7, Table S10).
There were six studies that could not be included in the meta‐analyses. 36 , 40 , 55 , 58 , 59 , 60 The reported findings were consistent with the meta‐analyzed studies. For detailed descriptions, see Table S11.
3.3. Subgroup and post hoc analyses
There was evidence that associations were weaker when parental BMI was based on parental self‐reported weight and height rather than on clinical or research measures (e.g., self‐reported SMD = 0.21 (95% CI: 0.15, 0.27, p < 0.001) for mother–offspring, and clinical or research measures SMD = 0.26 (95% CI: 0.23, 0.30, p = 0.006), respectively; exact p < 0.1 for heterogeneity between groups; Figure S8, Table S12). The association was stronger in cross‐sectional studies compared to cohort studies for father–offspring associations but not for mother–offspring associations (Figure S9A, Table S13).
Pooled results were very similar comparing studies where maternal BMI ascertainment was before/in early pregnancy or after pregnancy (Figure S10, Table S14); similarly, results were consistent between studies in which children were younger than 30 years and those who were older than 40 years (Figure S11A, Figure S11B, and Table S15). When considering temporal relationships in the assessment of BMI for both parents and offspring, the strengths of the parental–offspring BMI associations were similar when offspring BMI was measured in early adulthood irrespective of timing of parental BMI measurement. Results were more heterogeneous when both parental and offspring BMI were measured at mid/late adulthood, mostly due to the variety in offspring's BMI assessment time and study design (Figure S12A,B, Table S16).
Further post hoc analyses were performed to investigate the moderate‐to‐high degree of between‐study heterogeneity, including taking out studies with a small proportion of offspring younger than 18 years (Table S17) or with low quality (Table S18). The results remained similar to the main analyses.
3.4. Secondary outcome: ORs
Eighteen studies investigated the association between parental BMI status and offspring having overweight or obesity and were included. Eleven of the studies 18 , 26 , 34 , 36 , 43 , 46 , 47 , 49 , 50 , 51 , 56 , 57 , 60 , 61 , 62 , 63 , 64 , 65 , 66 , 67 used World Health Organization 68 categories to define overweight (BMI 25.0–29.9 kg/m2) and obesity (BMI ≥ 30 kg/m2); the remaining studies used different thresholds based on the study population distribution.
As noted in Section 2, we did not pool results from these studies. Most studies found that adult offspring of parents with overweight or obesity (either mother or father, or both) were more likely to be with overweight or obesity themselves, compared to those with parents with normal weight, though magnitudes of association varied ranging from 1.1 (95% CI: 0.8, 1.6) 46 to 11.8 (95% CI: 7.7, 18.0) 18 (see Figures S13–S15).
Only one study found little evidence of an association between mother–offspring or father–offspring weight status. 50 ORs were generally higher when both parents had overweight or obesity compared to results using where only one parent had overweight or obesity, and there was evidence of a dose response with stronger magnitudes of association for those whose parents had obesity rather than overweight. Four studies examined the association of parental BMI as a continuum with ORs for offspring having overweight or obesity, with results for these showing higher odds of offspring having overweight or obesity with higher parental mean BMI. 34 , 62 , 66 , 67
3.5. Study quality and risk of bias
The majority of the studies were considered of good quality (29 scored ≥6), with four studies scoring 8 and three studies scoring ≤3 (Table S19). Eleven studies did not have a representative sample of the target population, and seven studies did not consider the temporal relationship between the exposure and outcome. The exposure or outcome was self‐reported or without description in 15 studies, and confounding factors were not considered in the analyses in 10 studies. Thirteen cross‐sectional studies did not score a point for adequacy of follow up of the cohort due to the nature of the study design; 17 cohort studies had a follow‐up of <80% and did not provide any description of loss to follow‐up. All studies were followed up long enough for outcomes to occur (average offspring age was above 18 years old). Sensitivity analyses taking out the three studies of poor quality (score ≤3) showed slightly higher SMD and lower I 2 in the adjusted models (data not shown).
3.6. Funnel plot asymmetry
The funnel plot and Egger's test show no strong evidence of funnel asymmetry suggesting there was little evidence of publication bias (Figure S16).
4. DISCUSSION
In this systematic review, we found positive associations between parental BMI and their offspring BMI in adulthood, assessed using several different measures of association. Directions and magnitudes of associations were similar for both parents and when assessed separately in daughters and sons. They were also similar in subgroups of studies that differed in age at which offspring weight and height were ascertained and in timing of maternal BMI in relation to pregnancy. Most studies were considered good quality, with only few scoring poorly, and we observed that results in studies with BMI (parental and/or offspring) based on self‐reported rather than measured weight and height were weaker. The findings extend previous systematic reviews on the intergenerational transmission of BMI in childhood 6 , 19 and demonstrate that the association persists into adulthood. The strength of association across the BMI distribution was relatively weak. For example, the pooled SMD = 0.23 per 1 SD higher maternal BMI is equivalent to a correlation coefficient of 0.23. On the other hand, this correlation could be important at a population level.
While our meta‐analyses were focused on investigating the parent–offspring BMI association in adulthood in general, this relationship might be influenced by a range of factors that vary across different stages of the life course. Such dynamic factors might influence the strength of association in different periods. Nevertheless, subgroup analyses demonstrate that the associations were consistent when considering temporal relationships in the assessment time of BMI for both parents and offspring. Notably, only birth cohort studies were able to prospectively assess parental BMI before/during pregnancy, whereas some of the meta‐analyzed studies measured parental BMI concurrently with offspring BMI. Consequently, it is conceivable that any intrauterine effects might be diluted with increasing age. However, our results were similar for studies that measured parental BMI before the index pregnancy. That we see similar magnitudes of associations for mothers and fathers is consistent with previous parental negative control and Mendelian randomization studies, 15 , 16 , 69 , 70 , 71 , 72 , 73 which suggest that intrauterine mechanisms are not key to cross‐generational associations. The comparison of same‐sex versus cross‐sex association also did not reveal significant sex differences in the associations. Our findings are consistent with both parents contributing to an “obesogenic” family environment, but are also compatible with the inheritance from either parent, or both, of genetic traits predisposing to adiposity. 74 Thus, these findings emphasize the need to target all family members for obesity prevention.
Between‐study heterogeneity was moderate to high for some of the pooled results. We conducted a series of subgroup analyses to explore the sources of heterogeneity but found consistent results between subgroups for all of these, except whether BMI was based on self‐reported or measured weight and height. Results were consistent between studies that did not adjust for any confounders and those adjusting for some confounders (most of which adjusted for what we consider to be key confounders). Thus, differences in confounder adjustments are unlikely to explain between‐study heterogeneity, and we are unable to determine the cause of between‐study heterogeneity. Six studies adjusted for early life variables such as birth weight or gestational weight gain, 53 , 59 , 63 , 65 , 75 , 76 which are potential mediators on the causal pathway between parental and offspring BMI, rather than confounders. Therefore, we used results from models that did not adjust for birth weight or gestational weight gain in the meta‐analyses.
Key strengths of our review include the focus on offspring adult BMI, carefully considering which studies are appropriate to meta‐analyses, and undertaking relevant subgroup analyses. We have investigated sex‐specific associations and compared associations of maternal–offspring to paternal–offspring BMI associations, including the timing of BMI measurement for both parents and children, to explore the potential etiology of BMI intergenerational associations.
We acknowledge limitations of this review. Of the 46 studies identified in the systematic review, some studies could not be included in the meta‐analyses. 36 , 40 , 55 , 58 , 59 , 60 The description of results and conclusions of those studies were largely consistent with the findings of the meta‐analyses in that they suggested parental BMI associated with offspring BMI into adulthood. While our focus was on offspring adult (18 years or older) BMI, seven studies 27 , 31 , 32 , 33 , 34 , 35 , 36 (corresponding to 15% of studies and 5% of participants) measuring offspring BMI at 15–25 years were included in the systematic review. However, meta‐analysis results were not changed with removal of these studies. We have focused on adult BMI, and it is possible that results would be different for other measures of adiposity, such as waist circumference or fat mass. However, the strong correlations between BMI and these measurements, together with similar Mendelian randomization results for maternal BMI with offspring BMI and fat mass, make this unlikely. 77 The small number of studies reporting all combinations of mother, father, daughter, and son associations limited our ability to assess any dose–response relationships between within these different groups.
5. CONCLUSIONS
This systematic review and meta‐analysis of observational studies indicates that the intergenerational associations between parental and offspring BMI persist into adulthood. We found there was no strong evidence of differences between maternal and paternal lines, which, together with Mendelian randomization and negative control studies 6 , 16 mostly in younger aged offspring, suggest that intrauterine effects related to higher maternal BMI are not a major cause of adiposity in offspring.
AUTHOR CONTRIBUTIONS
Jie Zhang and Christina C. Dahm had the original idea for the paper and designed the study. Jie Zhang, Gemma L. Clayton, Kim Overvad, Anja Olsen, Deborah A. Lawlor, and Christina C. Dahm contributed to the analysis plan. The bibliographic search and data extraction was carried out by Jie Zhang, Helene Tilma Vistisen, Mette Lise Lousdal, and Christina C. Dahm. The methods and statistical analysis were performed by Jie Zhang and Gemma L. Clayton. The interpretation of results and writing and final editing was done by all authors. All authors reviewed and approved the manuscript.
CONFLICT OF INTEREST STATEMENT
DAL has received support from Roche Diagnostics for research unrelated to this paper; other authors declare no conflicts of interest.
Supporting information
Figure S1. PRISMA flow diagram of the study selection process
Figure S2. Directed acyclic diagram (DAG) illustrating confounding factors between parent‐offspring BMI association.
Figure S3a. Meta‐analysis of the association between parent and offspring BMI (standardized mean difference).
Figure S3b. Meta‐analysis of the association between parent and offspring BMI at sex‐specific level (standardized mean difference).
Figure S4a. Meta‐analysis of the association between parent and offspring BMI (mean difference).
Figure S4b. Meta‐analysis of the association between parent and offspring BMI at sex‐specific level (mean difference).
Figure S5. Difference of standardized mean difference between mother‐offspring and father‐offspring association.
Figure S6. Difference of mean difference between mother‐offspring and father‐offspring association.
Figure S7. Difference of standardized mean difference between mother‐offspring and father‐offspring association in studies assessing parental BMI at early age.
Figure S8. Standardized mean difference between parent‐offspring BMI association‐subgroup analyses by BMI measurement methods.
Figure S9a. Standardized mean difference between parent‐offspring BMI association‐subgroup analyses by study design.
Figure S9b. Standardized mean difference between parent‐offspring BMI association‐subgroup analyses by study design (sex‐specific level).
Figure S10. Standardized mean difference between parent‐offspring BMI association‐subgroup analyses by maternal BMI measurement time.
Figure S11a. Standardized mean difference between parent‐offspring BMI association‐subgroup analyses by offspring age.
Figure S11b. Standardized mean difference between parent‐offspring BMI association‐subgroup analyses by offspring age (sex‐specific level).
Figure 12a. Standardized mean difference between parent‐offspring BMI association‐subgroup analyses by parent‐offspring BMI assessed time.
Figure 12b. Standardized mean difference between parent‐offspring BMI association‐subgroup analyses by parent‐offspring BMI assessed time (sex‐specific level).
Figure S13. Forest plot showing odds ratio (OR) of offspring with overweight with parental weight status.
Figure S14. Forest plot showing odds ratio (OR) of offspring with obesity with parental weight status.
Figure S15. Forest plot showing odds ratio (OR) of offspring with overweight or obesity with parental weight status.
Figure S16. Funnel plot for publication bias.
Table S1. Description of all the studies included in systematic review and meta‐analyses.
Table S2. Descriptions of studies reporting correlation coefficient.
Table S3. Descriptions of studies reporting mean difference or standardized mean difference.
Table S4. Descriptions of studies reporting odd ratios or risk ratios.
Table S5. Pooled standardized mean difference between parental and offspring BMI (per standard deviation).
Table S6. Pooled mean difference between parental and offspring BMI (per kg/m2).
Table S7. Difference of standardized mean difference between maternal and paternal line in adjusted models.
Table S8. Difference of standardized mean difference between maternal and paternal line in unadjusted models.
Table S9. Difference of mean difference between maternal and paternal line.
Table S10. Difference of mean difference between maternal and paternal line (restricting to studies assessing parental BMI when children were young).
Table S11. Summary of studies not included in meta‐analyses.
Table S12. Subgroup analyses by BMI measurement method.
Table S13. Subgroup analyses by study design.
Table S14. Subgroup analyses by maternal BMI measurement time.
Table S15. Subgroup analyses by offspring age.
Table S16. Subgroup analyses by parent‐offspring BMI assessed time.
Table S17. Post hoc analyses‐standardized mean difference taking out studies including younger participants.
Table S18. Post hoc analyses‐standardized mean difference taking out studies with low quality score.
Table S19. Study quality assessment using Adapted Newcastle‐Ottawa scale.
ACKNOWLEDGMENTS
We thank Mette Lise Lousdal (M.L.L.) and Helene Tilma Vistisen (H.T.V.) for their support in the literature search and screening.
Zhang J, Clayton GL, Overvad K, Olsen A, Lawlor DA, Dahm CC. Body mass index in parents and their adult offspring: A systematic review and meta‐analysis. Obesity Reviews. 2024;25(1):e13644. doi: 10.1111/obr.13644
REFERENCES
- 1. McPherson K. Reducing the global prevalence of overweight and obesity. Lancet. 2014;384(9945):728‐730. doi: 10.1016/S0140-6736(14)60767-4 [DOI] [PubMed] [Google Scholar]
- 2. Katzmarzyk PT, Perusse L, Rao D, Bouchard C. Familial risk of obesity and central adipose tissue distribution in the general Canadian population. Am J Epidemiol. 1999;149(10):933‐942. doi: 10.1093/oxfordjournals.aje.a009737 [DOI] [PubMed] [Google Scholar]
- 3. Razaz N, Villamor E, Muraca GM, Bonamy A‐KE, Cnattingius S. Maternal obesity and risk of cardiovascular diseases in offspring: a population‐based cohort and sibling‐controlled study. Lancet Diabetes Endocrinol. 2020;8(7):572‐581. doi: 10.1016/S2213-8587(20)30151-0 [DOI] [PubMed] [Google Scholar]
- 4. Godfrey KM, Reynolds RM, Prescott SL, et al. Influence of maternal obesity on the long‐term health of offspring. Lancet Diabetes Endocrinol. 2017;5(1):53‐64. doi: 10.1016/S2213-8587(16)30107-3 [DOI] [PMC free article] [PubMed] [Google Scholar]
- 5. Bond TA, Karhunen V, Wielscher M, et al. Exploring the role of genetic confounding in the association between maternal and offspring body mass index: evidence from three birth cohorts. Int J Epidemiol. 2020;49(1):233‐243. doi: 10.1093/ije/dyz095 [DOI] [PMC free article] [PubMed] [Google Scholar]
- 6. Patro B, Liber A, Zalewski B, Poston L, Szajewska H, Koletzko B. Maternal and paternal body mass index and offspring obesity: a systematic review. Ann Nutr Metab. 2013;63(1–2):32‐41. doi: 10.1159/000350313 [DOI] [PubMed] [Google Scholar]
- 7. Desai M, Ross MG. Fetal programming of adipose tissue: effects of intrauterine growth restriction and maternal obesity/high‐fat diet. Paper presented at: Seminars in reproductive medicine, 2011. [DOI] [PMC free article] [PubMed]
- 8. Winter P, Osmond C, Margetts B, Simmonds S. Weight in infancy and death from ischemic heart disease. Lancet. 1989;2:577‐580. [DOI] [PubMed] [Google Scholar]
- 9. Marciniak A, Patro‐Małysza J, Kimber‐Trojnar Ż, Marciniak B, Oleszczuk J, Leszczyńska‐Gorzelak B. Fetal programming of the metabolic syndrome. Taiwan J Obstet Gynecol. 2017;56(2):133‐138. doi: 10.1016/j.tjog.2017.01.001 [DOI] [PubMed] [Google Scholar]
- 10. Bertram CE, Hanson MA. Animal models and programming of the metabolic syndrome: type 2 diabetes. Br Med Bull. 2001;60(1):103‐121. doi: 10.1093/bmb/60.1.103 [DOI] [PubMed] [Google Scholar]
- 11. George LA, Uthlaut AB, Long NM, et al. Different levels of overnutrition and weight gain during pregnancy have differential effects on fetal growth and organ development. Reprod Biol Endocrinol. 2010;8(1):75. doi: 10.1186/1477-7827-8-75 [DOI] [PMC free article] [PubMed] [Google Scholar]
- 12. Lawlor DA, Relton C, Sattar N, Nelson SM. Maternal adiposity—a determinant of perinatal and offspring outcomes? Nat Rev Endocrinol. 2012;8(11):679‐688. doi: 10.1038/nrendo.2012.176 [DOI] [PubMed] [Google Scholar]
- 13. Sharp GC, Lawlor DA, Richardson SS. It's the mother!: how assumptions about the causal primacy of maternal effects influence research on the developmental origins of health and disease. Soc Sci Med. 2018;213:20‐27. doi: 10.1016/j.socscimed.2018.07.035 [DOI] [PMC free article] [PubMed] [Google Scholar]
- 14. Richmond RC, Timpson NJ, Felix JF, et al. Using genetic variation to explore the causal effect of maternal pregnancy adiposity on future offspring adiposity: a Mendelian randomisation study. PLoS Med. 2017;14(1):e1002221. doi: 10.1371/journal.pmed.1002221 [DOI] [PMC free article] [PubMed] [Google Scholar]
- 15. Bond TA, Richmond RC, Karhunen V, et al. Exploring the causal effect of maternal pregnancy adiposity on offspring adiposity: Mendelian randomization using polygenic risk scores. medRxiv 2021. [DOI] [PMC free article] [PubMed]
- 16. Smith GD, Steer C, Leary S, Ness A. Is there an intrauterine influence on obesity? Evidence from parent–child associations in the Avon longitudinal study of parents and children (ALSPAC). Arch Dis Child. 2007;92(10):876‐880. doi: 10.1136/adc.2006.104869 [DOI] [PMC free article] [PubMed] [Google Scholar]
- 17. Kivimäki M, Lawlor DA, Smith GD, et al. Substantial intergenerational increases in body mass index are not explained by the fetal overnutrition hypothesis: the cardiovascular risk in young Finns study. Am J Clin Nutr. 2007;86(5):1509‐1514. doi: 10.1093/ajcn/86.5.1509 [DOI] [PubMed] [Google Scholar]
- 18. Han T, Hart C, Haig C, et al. Contributions of maternal and paternal adiposity and smoking to adult offspring adiposity and cardiovascular risk: the Midspan family study. BMJ Open. 2015;5(11):e007682. doi: 10.1136/bmjopen-2015-007682 [DOI] [PMC free article] [PubMed] [Google Scholar]
- 19. Heslehurst N, Vieira R, Akhter Z, et al. The association between maternal body mass index and child obesity: a systematic review and meta‐analysis. PLoS Med. 2019;16(6):e1002817. doi: 10.1371/journal.pmed.1002817 [DOI] [PMC free article] [PubMed] [Google Scholar]
- 20. Dekkers OM, Vandenbroucke JP, Cevallos M, Renehan AG, Altman DG, Egger M. COSMOS‐E: guidance on conducting systematic reviews and meta‐analyses of observational studies of etiology. PLoS Med. 2019;16(2):e1002742. doi: 10.1371/journal.pmed.1002742 [DOI] [PMC free article] [PubMed] [Google Scholar]
- 21. Covidence . Covidence systematic review software. Veritas Health Innovation, Melbourne, Australia.
- 22. Borenstein M, Hedges LV, Higgins JP, Rothstein HR. Independent subgroups within a study. In: Introduction to Meta‐Analysis. John Wiley & Sons; 2021. [Google Scholar]
- 23. Higgins JP, Thompson SG, Spiegelhalter DJ. A re‐evaluation of random‐effects meta‐analysis. J R Stat Soc a Stat Soc. 2009;172(1):137‐159. doi: 10.1111/j.1467-985X.2008.00552.x [DOI] [PMC free article] [PubMed] [Google Scholar]
- 24. Hu Y, He L, Wu Y, Ma G, Li L, Hu Y. Familial correlation and aggregation of body mass index and blood pressure in Chinese Han population. BMC Public Health. 2013;13(1):686. doi: 10.1186/1471-2458-13-686 [DOI] [PMC free article] [PubMed] [Google Scholar]
- 25. Johnson PC, Logue J, McConnachie A, et al. Intergenerational change and familial aggregation of body mass index. Eur J Epidemiol. 2012;27(1):53‐61. doi: 10.1007/s10654-011-9639-5 [DOI] [PubMed] [Google Scholar]
- 26. Kvaavik E, Tell GS, Klepp K‐I. Predictors and tracking of body mass index from adolescence into adulthood: follow‐up of 18 to 20 years in the Oslo youth study. Arch Pediatr Adolesc Med. 2003;157(12):1212‐1218. doi: 10.1001/archpedi.157.12.1212 [DOI] [PubMed] [Google Scholar]
- 27. Swanton S, Choh AC, Lee M, et al. Body mass index associations between mother and offspring from birth to age 18: the Fels longitudinal study. Obes Sci Pract. 2017;3(2):127‐133. doi: 10.1002/osp4.90 [DOI] [PMC free article] [PubMed] [Google Scholar]
- 28. Egger M, Smith GD, Phillips AN. Meta‐analysis: principles and procedures. BMJ (Clinical Research Ed). 1997;315(7121):1533‐1537. doi: 10.1136/bmj.315.7121.1533 [DOI] [PMC free article] [PubMed] [Google Scholar]
- 29. Sterne JA, Sutton AJ, Ioannidis JP, et al. Recommendations for examining and interpreting funnel plot asymmetry in meta‐analyses of randomised controlled trials. BMJ (Clinical Research Ed). 2011;343:d4002. doi: 10.1136/bmj.d4002 [DOI] [PubMed] [Google Scholar]
- 30. Mirmiran P, Mirbolooki M, Azizi F. Familial clustering of obesity and the role of nutrition: Tehran lipid and glucose study. Int J Obes (Lond). 2002;26(12):1617‐1622. doi: 10.1038/sj.ijo.0802120 [DOI] [PubMed] [Google Scholar]
- 31. Friedlander Y, Kark J, Kaufmann N, Berry E, Stein Y. Familial aggregation of body mass index in ethnically diverse families in Jerusalem. Jerusalem Lipid Res Clin. 1988;12(3):237‐247. [PubMed] [Google Scholar]
- 32. Cho C, Maawadh A, Gerstner GE. Comparisons of chewing rhythm, craniomandibular morphology, body mass and height between mothers and their biological daughters. Arch Oral Biol. 2015;60(11):1667‐1674. doi: 10.1016/j.archoralbio.2015.08.004 [DOI] [PubMed] [Google Scholar]
- 33. Salces I, Rebato E, San Martin L, Rosique J, Vinagre A, Susanne C. Family resemblance for anthropometric traits II. Assessment of maternal occupational and age effects. Homo. 2002;52(3):201‐213. doi: 10.1078/0018-442X-00028 [DOI] [PubMed] [Google Scholar]
- 34. Kowaleski‐Jones L, Brown BB, Fan JX, Smith KR, Zick CD. Are you what your mother weighs? Evaluating the impact of maternal weight trajectories on youth overweight. Matern Child Health J. 2010;14(5):680‐686. doi: 10.1007/s10995-009-0493-y [DOI] [PubMed] [Google Scholar]
- 35. Classen TJ. Measures of the intergenerational transmission of body mass index between mothers and their children in the United States, 1981–2004. Econ Hum Biol. 2010;8(1):30‐43. doi: 10.1016/j.ehb.2009.11.002 [DOI] [PMC free article] [PubMed] [Google Scholar]
- 36. Chaparro MP, Koupil I, Byberg L. Maternal pre‐pregnancy BMI and offspring body composition in young adulthood: the modifying role of offspring sex and birth order. Public Health Nutr. 2017;20(17):3084‐3089. doi: 10.1017/S1368980017002191 [DOI] [PMC free article] [PubMed] [Google Scholar]
- 37. Khoury P, Morrison JA, Laskarzewski PM, Glueck CJ. Parent‐offspring and sibling body mass index associations during and after sharing of common household environments: the Princeton School district family study. Metabolism. 1983;32(1):82‐89. doi: 10.1016/0026-0495(83)90161-0 [DOI] [PubMed] [Google Scholar]
- 38. Egger M, Smith GD, Schneider M, Minder C. Bias in meta‐analysis detected by a simple, graphical test. BMJ (Clinical Research Ed). 1997;315(7109):629‐634. doi: 10.1136/bmj.315.7109.629 [DOI] [PMC free article] [PubMed] [Google Scholar]
- 39. Harris RJ, Deeks JJ, Altman DG, Bradburn MJ, Harbord RM, Sterne JA. Metan: fixed‐and random‐effects meta‐analysis. Stata J. 2008;8(1):3‐28. doi: 10.1177/1536867X0800800102 [DOI] [Google Scholar]
- 40. Vik KL, Romundstad P, Carslake D, Davey Smith G, Nilsen TI. Comparison of father‐offspring and mother‐offspring associations of cardiovascular risk factors: family linkage within the population‐based HUNT study, Norway. Int J Epidemiol. 2014;43(3):760‐771. doi: 10.1093/ije/dyt250 [DOI] [PubMed] [Google Scholar]
- 41. Murrin CM, Kelly GE, Tremblay RE, Kelleher CC. Body mass index and height over three generations: evidence from the Lifeways cross‐generational cohort study. BMC Public Health. 2012;12(1):81. doi: 10.1186/1471-2458-12-81 [DOI] [PMC free article] [PubMed] [Google Scholar]
- 42. Kelly GE, Murrin C, Viljoen K, O'Brien J, Kelleher C. Body mass index is associated with the maternal lines but height is heritable across family lines in the Lifeways cross‐generation cohort study. BMJ Open. 2014;4(12):e005732. doi: 10.1136/bmjopen-2014-005732 [DOI] [PMC free article] [PubMed] [Google Scholar]
- 43. Lake JK, Power C, Cole TJ. Child to adult body mass index in the 1958 British birth cohort: associations with parental obesity. Arch Dis Child. 1997;77(5):376‐380. doi: 10.1136/adc.77.5.376 [DOI] [PubMed] [Google Scholar]
- 44. Magnusson P, Rasmussen F. Familial resemblance of body mass index and familial risk of high and low body mass index. A study of young men in Sweden. Int J Obes (Lond). 2002;26(9):1225‐1231. doi: 10.1038/sj.ijo.0802041 [DOI] [PubMed] [Google Scholar]
- 45. Cooper R, Hypponen E, Berry D, Power C. Associations between parental and offspring adiposity up to midlife: the contribution of adult lifestyle factors in the 1958 British birth cohort study. Am J Clin Nutr. 2010;92(4):946‐953. doi: 10.3945/ajcn.2010.29477 [DOI] [PubMed] [Google Scholar]
- 46. Williams S. Overweight at age 21: the association with body mass index in childhood and adolescence and parents' body mass index. A cohort study of New Zealanders born in 1972–1973. Int J Obes (Lond). 2001;25(2):158‐163. doi: 10.1038/sj.ijo.0801512 [DOI] [PubMed] [Google Scholar]
- 47. Magarey AM, Daniels LA, Boulton TJ, Cockington RA. Predicting obesity in early adulthood from childhood and parental obesity. Int J Obes Relat Metab Disord. 2003;27(4):505‐513. doi: 10.1038/sj.ijo.0802251 [DOI] [PubMed] [Google Scholar]
- 48. Rotimi C, Cooper R. Familial resemblance for anthropometric measurements and relative fat distribution among African Americans. Int J Obes Relat Metab Dis. 1995;19(12):875‐880. [PubMed] [Google Scholar]
- 49. Al‐Isa AN. Factors associated with overweight and obesity among Kuwaiti college women. Nutr Health. 1998;12(4):227‐233. doi: 10.1177/026010609801200403 [DOI] [PubMed] [Google Scholar]
- 50. Naser Al‐Isa A, Campbell J, Desapriya E. Factors associated with overweight and obesity among Kuwaiti men. Asia Pac J Public Health. 2013;25(1):63‐73. doi: 10.1177/1010539511412178 [DOI] [PubMed] [Google Scholar]
- 51. Burke V, Beilin LJ, Dunbar D. Family lifestyle and parental body mass index as predictors of body mass index in Australian children: a longitudinal study. Int J Obes (Lond). 2001;25(2):147‐157. doi: 10.1038/sj.ijo.0801538 [DOI] [PubMed] [Google Scholar]
- 52. Wu D‐M, Hong Y, Sun C‐A, Sung P‐K, Rao D, Chu N‐F. Familial resemblance of adiposity‐related parameters: results from a health check‐up population in Taiwan. Eur J Epidemiol. 2003;18(3):221‐226. [DOI] [PubMed] [Google Scholar]
- 53. Kazumi T, Kawaguchi A, Yoshino G. Associations of middle‐aged mother's but not father's body mass index with 18‐year‐old son's waist circumferences, birth weight, and serum hepatic enzyme levels. Metabolism. 2005;54(4):466‐470. doi: 10.1016/j.metabol.2004.10.014 [DOI] [PubMed] [Google Scholar]
- 54. Carrillo‐Larco RM, Bernabé‐Ortiz A, Sal y Rosas VG, et al. Parental body mass index and blood pressure are associated with higher body mass index and blood pressure in their adult offspring: a cross‐sectional study in a resource‐limited setting in northern Peru. Trop Med Int Health. 2018;23(5):533‐540. doi: 10.1111/tmi.13052 [DOI] [PMC free article] [PubMed] [Google Scholar]
- 55. Sørensen T, Holst C, Stunkard AJ, Skovgaard LT. Correlations of body mass index of adult adoptees and their biological and adoptive relatives. Int J Obes Relat Metab Disord. 1992;16(3):227‐236. [PubMed] [Google Scholar]
- 56. Wang H, Wang J, Liu M‐M, et al. Epidemiology of general obesity, abdominal obesity and related risk factors in urban adults from 33 communities of northeast China: the CHPSNE study. BMC Public Health. 2012;12(1):967. doi: 10.1186/1471-2458-12-967 [DOI] [PMC free article] [PubMed] [Google Scholar]
- 57. Zalbahar N, Najman J, McIntrye HD, Mamun A. Parental pre‐pregnancy BMI influences on offspring BMI and waist circumference at 21 years. Aust N Z J Public Health. 2016;40(6):572‐578. doi: 10.1111/1753-6405.12574 [DOI] [PubMed] [Google Scholar]
- 58. Eriksson JG, Sandboge S, Salonen M, Kajantie E, Osmond C. Maternal weight in pregnancy and offspring body composition in late adulthood: findings from the Helsinki birth cohort study (HBCS). Ann Med. 2015;47(2):94‐99. doi: 10.3109/07853890.2015.1004360 [DOI] [PubMed] [Google Scholar]
- 59. Kaseva N, Vääräsmäki M, Matinolli H, et al. Pre‐pregnancy overweight or obesity and gestational diabetes as predictors of body composition in offspring twenty years later: evidence from two birth cohort studies. Int J Obes (Lond). 2018;42(4):872‐879. doi: 10.1038/ijo.2017.277 [DOI] [PubMed] [Google Scholar]
- 60. Schoppa I, Lyass A, Heard‐Costa N, et al. Association of maternal prepregnancy weight with offspring adiposity throughout adulthood over 37 years of follow‐up. Obesity. 2019;27(1):137‐144. doi: 10.1002/oby.22326 [DOI] [PMC free article] [PubMed] [Google Scholar]
- 61. Crossman A, Sullivan DA, Benin M. The family environment and American adolescents' risk of obesity as young adults. Soc Sci Med. 2006;63(9):2255‐2267. doi: 10.1016/j.socscimed.2006.05.027 [DOI] [PubMed] [Google Scholar]
- 62. Reynolds R, Osmond C, Phillips D, Godfrey K. Maternal BMI, parity, and pregnancy weight gain: influences on offspring adiposity in young adulthood. J Clin Endocrinol Metabol. 2010;95(12):5365‐5369. doi: 10.1210/jc.2010-0697 [DOI] [PubMed] [Google Scholar]
- 63. Derraik JG, Ahlsson F, Diderholm B, Lundgren M. Obesity rates in two generations of Swedish women entering pregnancy, and associated obesity risk among adult daughters. Sci Rep. 2015;5(1):16692. doi: 10.1038/srep16692 [DOI] [PMC free article] [PubMed] [Google Scholar]
- 64. Alati R, Betts K, Williams G, Najman J, Zalbahar N, Mamun A. Generational increase in obesity among young women: a prospective analysis of mother–daughter dyads. Int J Obes (Lond). 2016;40(1):176‐180. doi: 10.1038/ijo.2015.153 [DOI] [PubMed] [Google Scholar]
- 65. Rath S, Marsh JA, Newnham JP, et al. Parental pre‐pregnancy BMI is a dominant early‐life risk factor influencing BMI of offspring in adulthood. Obes Sci Pract. 2016;2(1):48‐57. doi: 10.1002/osp4.28 [DOI] [PMC free article] [PubMed] [Google Scholar]
- 66. Koupil I, Toivanen P. Social and early‐life determinants of overweight and obesity in 18‐year‐old Swedish men. Int J Obes (Lond) (2005). 2008;32(1):73‐81. doi: 10.1038/sj.ijo.0803681 [DOI] [PubMed] [Google Scholar]
- 67. Stuebe AM, Forman MR, Michels KB. Maternal‐recalled gestational weight gain, pre‐pregnancy body mass index, and obesity in the daughter. Int J Obes (Lond). 2009;33(7):743‐752. doi: 10.1038/ijo.2009.101 [DOI] [PMC free article] [PubMed] [Google Scholar]
- 68. WHO (World Health Organization) . Obesity and overweight. 2015.
- 69. Subramanian S, Ackerson LK, Smith GD. Parental BMI and childhood undernutrition in India: an assessment of intrauterine influence. Pediatrics. 2010;126(3):e663‐e671. doi: 10.1542/peds.2010-0222 [DOI] [PubMed] [Google Scholar]
- 70. Fleten C, Nystad W, Stigum H, et al. Parent‐offspring body mass index associations in the Norwegian mother and child cohort study: a family‐based approach to studying the role of the intrauterine environment in childhood adiposity. Am J Epidemiol. 2012;176(2):83‐92. doi: 10.1093/aje/kws134 [DOI] [PMC free article] [PubMed] [Google Scholar]
- 71. Corsi DJ, Subramanian S, Ackerson LK, Smith GD. Is there a greater maternal than paternal influence on offspring adiposity in India? Arch Dis Child. 2015;100(10):973‐979. doi: 10.1136/archdischild-2014-307690 [DOI] [PubMed] [Google Scholar]
- 72. Grant JF, Chittleborough CR, Taylor AW. Parental midlife body shape and association with multiple adult offspring obesity measures: north west Adelaide health study. PLoS ONE. 2015;10(9):e0137534. doi: 10.1371/journal.pone.0137534 [DOI] [PMC free article] [PubMed] [Google Scholar]
- 73. Perez‐Pastor EM, Metcalf BS, Hosking J, Jeffery AN, Voss LD, Wilkin TJ. Assortative weight gain in mother–daughter and father–son pairs: an emerging source of childhood obesity. Longitudinal study of trios (EarlyBird 43). Int J Obes (Lond). 2009;33(7):727‐735. doi: 10.1038/ijo.2009.76 [DOI] [PubMed] [Google Scholar]
- 74. Næss M, Sund ER, Vie GÅ, et al. Intergenerational polygenic obesity risk throughout adolescence in a cross‐sectional study design: the HUNT study, Norway. Obesity. 2021;29(11):1916‐1924. doi: 10.1002/oby.23284 [DOI] [PubMed] [Google Scholar]
- 75. Hochner H, Friedlander Y, Calderon‐Margalit R, et al. Associations of maternal prepregnancy body mass index and gestational weight gain with adult offspring cardiometabolic risk factors: the Jerusalem perinatal family follow‐up study. Circulation. 2012;125(11):1381‐1389. doi: 10.1161/CIRCULATIONAHA.111.070060 [DOI] [PMC free article] [PubMed] [Google Scholar]
- 76. Laitinen J, Power C, Järvelin M‐R. Family social class, maternal body mass index, childhood body mass index, and age at menarche as predictors of adult obesity. Am J Clin Nutr. 2001;74(3):287‐294. doi: 10.1093/ajcn/74.3.287 [DOI] [PubMed] [Google Scholar]
- 77. Bond TA, Richmond RC, Karhunen V, et al. Exploring the causal effect of maternal pregnancy adiposity on offspring adiposity: Mendelian randomisation using polygenic risk scores. BMC Med. 2022;20(1):34. doi: 10.1186/s12916-021-02216-w [DOI] [PMC free article] [PubMed] [Google Scholar]
Associated Data
This section collects any data citations, data availability statements, or supplementary materials included in this article.
Supplementary Materials
Figure S1. PRISMA flow diagram of the study selection process
Figure S2. Directed acyclic diagram (DAG) illustrating confounding factors between parent‐offspring BMI association.
Figure S3a. Meta‐analysis of the association between parent and offspring BMI (standardized mean difference).
Figure S3b. Meta‐analysis of the association between parent and offspring BMI at sex‐specific level (standardized mean difference).
Figure S4a. Meta‐analysis of the association between parent and offspring BMI (mean difference).
Figure S4b. Meta‐analysis of the association between parent and offspring BMI at sex‐specific level (mean difference).
Figure S5. Difference of standardized mean difference between mother‐offspring and father‐offspring association.
Figure S6. Difference of mean difference between mother‐offspring and father‐offspring association.
Figure S7. Difference of standardized mean difference between mother‐offspring and father‐offspring association in studies assessing parental BMI at early age.
Figure S8. Standardized mean difference between parent‐offspring BMI association‐subgroup analyses by BMI measurement methods.
Figure S9a. Standardized mean difference between parent‐offspring BMI association‐subgroup analyses by study design.
Figure S9b. Standardized mean difference between parent‐offspring BMI association‐subgroup analyses by study design (sex‐specific level).
Figure S10. Standardized mean difference between parent‐offspring BMI association‐subgroup analyses by maternal BMI measurement time.
Figure S11a. Standardized mean difference between parent‐offspring BMI association‐subgroup analyses by offspring age.
Figure S11b. Standardized mean difference between parent‐offspring BMI association‐subgroup analyses by offspring age (sex‐specific level).
Figure 12a. Standardized mean difference between parent‐offspring BMI association‐subgroup analyses by parent‐offspring BMI assessed time.
Figure 12b. Standardized mean difference between parent‐offspring BMI association‐subgroup analyses by parent‐offspring BMI assessed time (sex‐specific level).
Figure S13. Forest plot showing odds ratio (OR) of offspring with overweight with parental weight status.
Figure S14. Forest plot showing odds ratio (OR) of offspring with obesity with parental weight status.
Figure S15. Forest plot showing odds ratio (OR) of offspring with overweight or obesity with parental weight status.
Figure S16. Funnel plot for publication bias.
Table S1. Description of all the studies included in systematic review and meta‐analyses.
Table S2. Descriptions of studies reporting correlation coefficient.
Table S3. Descriptions of studies reporting mean difference or standardized mean difference.
Table S4. Descriptions of studies reporting odd ratios or risk ratios.
Table S5. Pooled standardized mean difference between parental and offspring BMI (per standard deviation).
Table S6. Pooled mean difference between parental and offspring BMI (per kg/m2).
Table S7. Difference of standardized mean difference between maternal and paternal line in adjusted models.
Table S8. Difference of standardized mean difference between maternal and paternal line in unadjusted models.
Table S9. Difference of mean difference between maternal and paternal line.
Table S10. Difference of mean difference between maternal and paternal line (restricting to studies assessing parental BMI when children were young).
Table S11. Summary of studies not included in meta‐analyses.
Table S12. Subgroup analyses by BMI measurement method.
Table S13. Subgroup analyses by study design.
Table S14. Subgroup analyses by maternal BMI measurement time.
Table S15. Subgroup analyses by offspring age.
Table S16. Subgroup analyses by parent‐offspring BMI assessed time.
Table S17. Post hoc analyses‐standardized mean difference taking out studies including younger participants.
Table S18. Post hoc analyses‐standardized mean difference taking out studies with low quality score.
Table S19. Study quality assessment using Adapted Newcastle‐Ottawa scale.