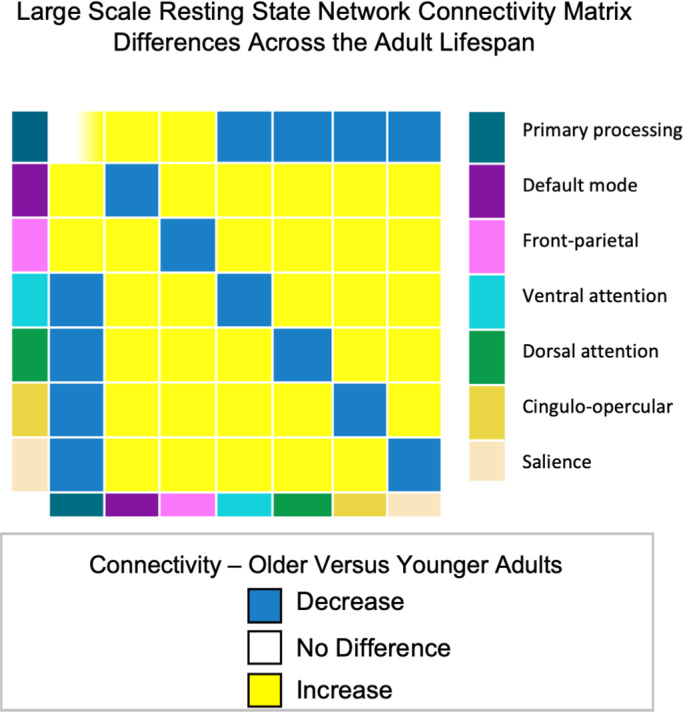
FIGURE 4.

Network connectivity matrix differences across the adult lifespan. The figure represents conceptual rather than a quantified connectivity measure (correlation) to illustrate the relative pattern across the lifespan. Diagonal cells show within‐network connectivity differences with age; off‐diagonal shows between‐network connectivity (primary processing includes sensorimotor, visual and auditory networks). Cells on the diagonal of the matrix with graded shading reflects where study findings are variable in the effect of age, either showing no age difference (white) or increased connectivity among older compared to younger adults (yellow). Off‐diagonal cells for the primary processing networks reflects mixed patterns of increased connectivity to higher order networks (yellow) and decreased (blue) connectivity to attention and control networks for older compared to younger adults.
