

Abstract
Aim
The aim of the study was to analyze the association between inflammatory marker profiles and in‐hospital neurological deterioration (ND) in acute ischemic stroke (AIS) patients.
Methods
Data from patients with minor AIS from the Third China National Stroke Registry were analyzed. Inflammatory cytokine levels within 24 h of admission were measured. The primary outcome was in‐hospital ND (an increase in National Institutes of Health Stroke Scale score ≥4 from admission to discharge). Associations were evaluated using odds ratios (ORs) and 95% confidence intervals (CIs) derived from logistic regression models. Net reclassification improvement (NRI) and integrated discrimination improvement (IDI) were used to evaluate incremental predictive values.
Results
A total of 4031 patients (1246 women, 30.9%) with a median age of 62 years were included. In‐hospital ND occurred in 121 patients (3%). Each standard‐deviation increase in interleukin (IL)‐6 (OR, 1.17 [95% CI, 1.06–1.31]) and high‐sensitivity C‐reactive protein (hsCRP) (OR, 1.43 [95% CI, 1.24–1.66]) levels was associated with increased in‐hospital ND risk. Incremental predictive values for adding IL‐6 (IDI, 0.012; NRI, 0.329) but not hsCRP levels to the conventional risk factors were found.
Conclusion
In minor AIS, hsCRP and IL‐6 levels were associated with in‐hospital ND, including IL‐6 levels in prognostic models improved risk classification.
Keywords: acute ischemic stroke, cerebrovascular disease, inflammatory marker, neurological deterioration
Elevated hsCRP and IL‐6 levels indicated higher ND risk. Adding inflammatory cytokines significantly improved risk classification, with IL‐6 as the main contributor.

1. INTRODUCTION
The disease burden due to stroke is increasing worldwide and in China. 1 , 2 Neurological deterioration (ND), whether it occurs hours or weeks after stroke onset, is associated with adverse prognosis and death. 3 , 4 , 5 , 6 ND may not always reverse during hospitalization and can persist until discharge. 7 Therefore, patients with a higher ND risk should be identified and prioritized to improve in‐hospital treatment strategy. Specifically, patients with minor stroke may receive less attention than those who exhibit more obvious symptoms of neurological impairment at admission.
Several inflammatory cytokines, including high‐sensitivity C‐reactive protein (hsCRP), 8 , 9 interleukin (IL)‐6, 10 and lipoprotein‐associated phospholipase A2 (Lp‐PLA2), 11 have been identified as independent predictive factors for functional worsening in previous studies. However, these studies often did not focus on cases of minor stroke, 8 , 10 , 12 , 13 , 14 , 15 , 16 , 17 , 18 , 19 failed to exclude the influence of thrombolysis therapy, 9 , 12 , 17 , 20 and were constrained by limited sample sizes and types of inflammatory biomarkers. 21
Using data from the Third China National Stroke Registry (CNSR‐III), a large‐scale registry involving the centralized testing of multiple inflammatory biomarkers within 24 h of admission, we meticulously evaluated the associations of inflammatory biomarkers with in‐hospital ND in patients with minor stroke who did not undergo reperfusion therapy and assessed the incremental predictive values of these inflammatory biomarkers when added to traditional risk factors.
2. METHODS
The study was approved by the ethics committee of Beijing Tiantan Hospital (approval number: KY2015–001–01) and has therefore been performed in accordance with the ethical standards laid down in an appropriate version of the Declaration of Helsinki. Written informed consent was obtained from the patients or their legally authorized representatives.
2.1. Study design and participants
Data were obtained from CNSR‐III, a national prospective cohort of patients with acute CVDs for long‐term follow‐ups. Overall, 15,166 patients with ischemic stroke or transient ischemic attack (TIA) within 7 days of onset were enrolled in the registry. The CNSR‐III protocol has been previously described. 22
Patients with minor AIS (National Institutes of Health Stroke Scale [NIHSS] ≤5, arrived within 24 h) were included in the current study. Patients who received thrombolysis or thrombectomy treatments, had missing NIHSS scores at admission or discharge, or missing data on inflammatory marker levels were excluded.
2.2. Data collection and measurement
Direct interviews and medical records included information on age, sex, current tobacco use, NIHSS score on admission, blood pressure, medical history, characteristics of infarction, and stroke etiology. Collected within 24 h of admission, blood samples were aliquoted, transported to the central laboratory of Beijing Tiantan Hospital in a cold chain, and stored. The levels of hsCRP, IL‐6, IL‐6 receptor (IL‐6R), IL‐1 receptor antagonist (IL‐1Ra), Lp‐PLA2 mass and activity (Lp‐PLA2‐A), YKL‐40/chitinase‐3‐like protein 1 (CHI3L1), and monocyte chemotactic protein 1 (MCP‐1) were tested centrally and blindly.
2.3. Outcome assessment
Outcomes were assessed by trained research coordinators through in‐person interviews at admission and discharge. The primary outcome was in‐hospital ND, defined as ΔNIHSS score ≥4 (ΔNIHSS = NIHSS score at discharge—NIHSS score at admission). This definition was used because we mainly focused on the development of potential improvement strategy of in‐hospital treatment for acute minor stroke.
2.4. Statistical analysis
Participants were dichotomized according to their in‐hospital ND status. Categorical variables are presented as frequencies and proportions in percentages. Continuous variables are presented as means with standard deviations and as medians with interquartile ranges for better explanation. To check the normality of variables, we used the Kolmogorov–Smirnov test and Q‐Q plot. For a large data set, p < 0.05 indicates statistical significance, but the result may not have clinical significance. Therefore, baseline characteristics and biomarkers were compared using the absolute standardized difference (ASD). An ASD ≥10% was considered clinically significant. 23
The association between serum inflammatory parameters and ND status was assessed using unadjusted and adjusted odds ratios (ORs) and 95% confidence intervals (CIs) from multivariable binary logistic regression. Confounding variables adjusted for in the multivariate analyses were determined based on clinical experience and significance tests (Table 1). The first quartile was the reference group. Trend tests were performed using quartiles as ordinal variables. To assess the incremental predictive value of inflammatory markers in addition to conventional risk factors, C‐statistics, integrated discrimination improvement (IDI), and the net reclassification improvement (NRI) were applied. A two‐sided p < 0.05 was considered statistically significant. All analyses were performed using SAS software (version 9.4; SAS Institute).
TABLE 1.
Demographic and clinical characteristics of patients by In‐hospital ND status.
| Variables | No ND (N = 3910 [97.0%]) | ND (N = 121 [3.0%]) | ASD (%) |
|---|---|---|---|
| Demographics | |||
| Age in years | 62.1 ± 11.3 | 65.0 ± 12.0 | 24.9 |
| Female | 1199 (30.7) | 47 (38.8) | 17.1 |
| Smoking | 1276 (32.6) | 27 (22.3) | 23.2 |
| NIHSS at admission | 2.0 (1.0–4.0) | 2.0 (1.0–3.0) | 0.0 |
| NIHSS | 12.3 | ||
| NIHSS ≤3 | 2899 (74.1) | 96 (79.3) | |
| NIHSS 4–5 | 1011 (25.9) | 25 (20.7) | |
| SBP | 150.6 ± 22.1 | 154.7 ± 25.4 | 17.2 |
| DBP | 87.6 ± 13.2 | 88.6 ± 14.9 | 7.1 |
| Medical history | |||
| Prior stroke/TIA | 978 (25.0) | 27 (22.3) | 6.4 |
| Hypertension | 2443 (62.5) | 75 (62.0) | 1.0 |
| Diabetes mellitus | 899 (23.0) | 32 (26.4) | 7.9 |
| Lipid metabolism disorders | 351 (9.0) | 7 (5.8) | 12.2 |
| Prior CHD/MI | 422 (10.8) | 13 (10.7) | 0.3 |
| Atrial fibrillation/flutter | 252 (6.4) | 9 (7.4) | 3.9 |
| Heart failure | 23 (0.6) | 10.9 | |
| Peripheral arterial disease | 42 (1.1) | 14.7 | |
| Carotid stenosis | 36 (0.9) | 13.6 | |
| Infarction pattern | 20.1 | ||
| None | 1076 (27.5) | 28 (23.1) | 10.1 |
| Single infarction | 1563 (40.0) | 42 (34.7) | 11.0 |
| Multiple infarction | 1227 (31.4) | 49 (40.5) | 19.0 |
| Watershed infarction | 44 (1.1) | 2 (1.7) | 5.1 |
| Infarction circulation | 10.1 | ||
| None | 1076 (27.5) | 28 (23.1) | 10.1 |
| Anterior circulating infarction | 1695 (43.4) | 56 (46.3) | 5.8 |
| Posterior circulation infarction | 959 (24.5) | 31 (25.6) | 2.5 |
| Anterior and posterior circulatory infarction | 180 (4.6) | 6 (5.0) | 1.9 |
| Stroke etiology | 27.0 | ||
| LAA | 808 (20.7) | 37 (30.6) | 22.8 |
| CE | 243 (6.2) | 8 (6.6) | 1.6 |
| SVO | 965 (24.7) | 20 (16.5) | 20.4 |
| Other | 1894 (48.4) | 56 (46.3) | 4.2 |
| Onset to discharge days | 13.0 ± 6.2 | 17.8 ± 13.3 | 47.0 |
Abbreviations: ASD, absolute standard difference; CE, cardioembolic stroke; CHD, coronary heart disease; DBP, diastolic blood pressure; LAA, large‐artery atherosclerosis; MI, myocardial infarction; ND, neurological deterioration; NIHSS, National Institutes of Health Stroke Scale; SBP, systolic blood pressure; SVO, small‐vessel occlusion; TIA, transient ischemic attack.
3. RESULTS
3.1. Baseline characteristics
Of 15,166 patients, 5886 with AIS over 24 h after onset, 2739 with moderate or severe stroke (NIHSS >5), 618 who received reperfusion treatments (including thrombolysis and thrombectomy), 8 with missing NIHSS records at admission or at discharge, and 1884 with missing inflammatory marker data were excluded. Thus, the final analysis included 4031 patients (Figure S1). And 43 patients lost during follow‐up with no specific reasons were recorded. Except for symptoms, lipid metabolism disorders, and atrial fibrillation/flutter, the baseline characteristics of the patients were similar with or without inflammatory markers. However, no apparent clinical significance was associated with the abovementioned differences (Table S1).
The median age of the patients was 62 years, and 1246 (30.9%) were women. Table 1 presents the baseline characteristics by ND status. The average NIHSS scores at admission and discharge were 2.17 ± 1.65 and 1.47 ± 2.10, respectively, with a mean ΔNIHSS of −0.70 ± 2.09. The average time between the disease attack and hospital discharge was 13.1 ± 6.6 days, and the total ND duration was 17.8 ± 13.3 days. Patients with ND tended to be older, tobacco users, had higher systolic blood pressure (SBP), and had a stroke etiology of large‐artery atherosclerosis (LAA) and small‐vessel occlusion (SVO) than patients without ND (Table 1).
3.2. Inflammatory profiles and in‐hospital ND
In‐hospital ND occurred in 121 (3%) patients, and none of the enrolled patients experienced in‐hospital death. Patients with ND had higher levels of hsCRP (median, 1.5 vs. 2.0 mg/L), IL‐6 (median, 2.4 vs. 2.8 pg/mL), IL‐6R (median, 39784.0 vs. 40762.7 pg/mL), IL‐1Ra (median, 330.3 vs. 391.9 pg/mL), Lp‐PLA2 mass (median, 172.7 vs. 178.7 ng/mL), Lp‐PLA2‐A (median, 153.9 vs. 164.9 nmol/min/mL), and YKL‐40/CHI3L1 (median, 61819.4 vs. 76017.6 pg/mL), except for MCP‐1 (median, 308.1 vs. 296.4 pg/mL), than patients without ND (Table 2 and Figure 1).
TABLE 2.
Inflammatory markers at admission by in‐hospital ND status.
| Variables | No ND (N = 3910 [97.0%]) | ND (N = 121 [3.0%]) | ASD (%) |
|---|---|---|---|
| hsCRP (mg/L) | |||
| Mean ± SD | 5.5 ± 19.5 | 11.6 ± 30.5 | 23.8 |
| Median (IQR) | 1.5 (0.8–3.8) | 2.0 (0.8–6.6) | 0.4 |
| IL‐6 (pg/mL) | |||
| Mean ± SD | 3.8 ± 4.0 | 5.7 ± 5.7 | 38.6 |
| Median (IQR) | 2.4 (1.5–4.2) | 2.8 (1.9–8.1) | 0.6 |
| IL‐6R (pg/mL) | |||
| Mean ± SD | 41798.4 ± 15507.4 | 42479.5 ± 15081.5 | 4.5 |
| Median (IQR) | 39784.0 (31282.7–49741.5) | 40762.7 (32201.2–52305.0) | 626.7 |
| IL‐1Ra (pg/mL) | |||
| Mean ± SD | 472.8 ± 515.3 | 550.2 ± 541.1 | 14.6 |
| Median (IQR) | 330.3 (250.0–469.7) | 391.9 (287.6–565.3) | 48.0 |
| Lp‐PLA2 mass (ng/mL) | |||
| Mean ± SD | 180.2 ± 75.4 | 189.9 ± 75.9 | 12.8 |
| Median (IQR) | 172.7 (126.7–224.0) | 178.7 (135.0–234.4) | 9.1 |
| Lp‐PLA2‐A (nmol/min/mL) | |||
| Mean ± SD | 159.9 ± 49.5 | 168.2 ± 46.6 | 17.3 |
| Median (IQR) | 159.3 (126.1–192.2) | 164.9 (134.8–197.8) | 7.7 |
| YKL‐40/CHI3L1 (pg/mL) | |||
| Mean ± SD | 83869.9 ± 61471.7 | 101155.6 ± 68973.9 | 26.5 |
| Median (IQR) | 61819.4 (37589.1–112173.4) | 76017.6 (48846.2–151053.0) | 12,472 |
| MCP‐1 (pg/mL) | |||
| Mean ± SD | 308.1 ± 302.9 | 296.4 ± 188.1 | 4.6 |
| Median (IQR) | 262.1 (202.6–337.3) | 264.1 (198.5–329.9) | −5.2 |
Abbreviations: ASD, absolute standard difference; hsCRP, high‐sensitivity C‐reactive protein; IL‐1Ra, IL‐1 receptor antagonist; IL‐6, interleukin‐6; IL‐6R, IL‐6 receptor; IQR, interquartile range; Lp‐PLA2, lipoprotein‐associated phospholipase A2; Lp‐PLA2‐A, Lp‐PLA2 activity; MCP‐1, monocyte chemotactic protein 1; ND, neurological deterioration; SD, standard deviation; YKL‐40/CHI3L1, chitinase‐3‐like protein 1.
FIGURE 1.
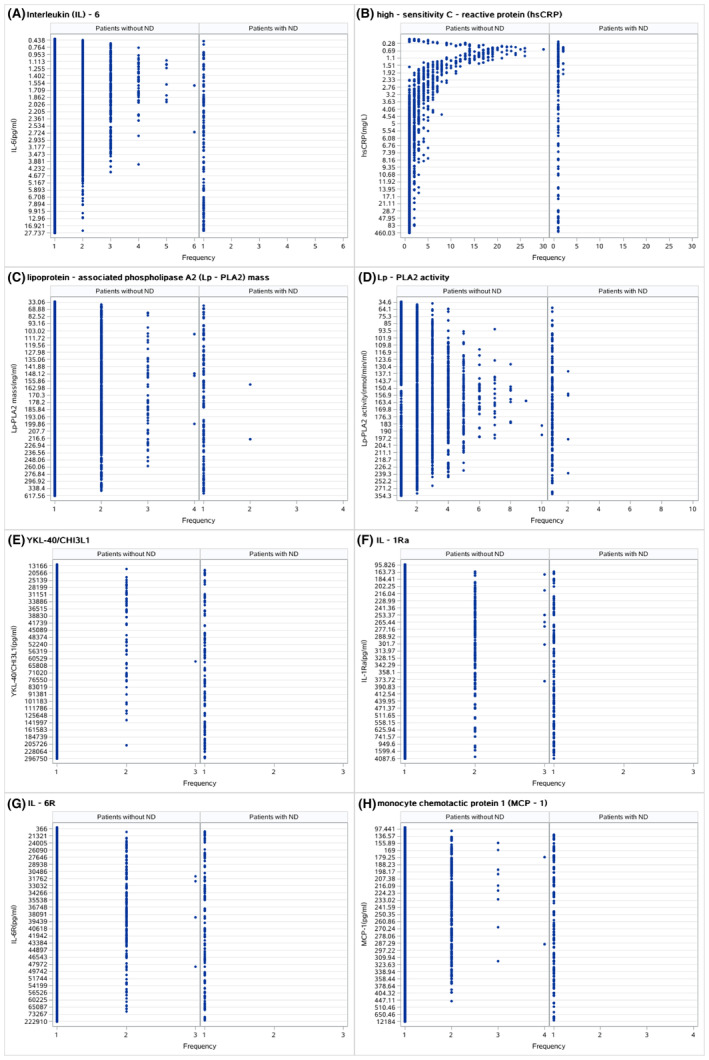
Dot plots based on neurological deterioration (ND) status. (A) Interleukin (IL)‐6, (B) high‐sensitivity C‐reactive protein (hsCRP), (C) lipoprotein‐associated phospholipase A2 (Lp‐PLA2) mass, (D) Lp‐PLA2 activity, (E) YKL‐40/CHI3L1, (F) IL‐1Ra, (G) IL‐6R, and (H) monocyte chemotactic protein 1 (MCP‐1).
The associations of these inflammatory biomarkers with in‐hospital ND are further presented by quartiles and standard deviations (Table 3). After adjustment for age, sex, tobacco use, NIHSS scores at admission and discharge, SBP, lipid metabolism disorders, heart failure, peripheral arterial disease, carotid stenosis, infarction topography, offending circulation, and stroke etiology, both hsCRP levels (adjusted OR, 1.17 [95% CI, 1.06–1.31]) and IL‐6 levels (adjusted OR, 1.43 [95% CI, 1.24–1.66]) remained independent predictors of in‐hospital ND (Table 3). The above relationship was also observed in long‐term poor outcomes, including unfavorable functional outcomes (defined as mRS 2–5) and death (Table S2).
TABLE 3.
Association between inflammatory markers at admission and in‐hospital ND.
| Outcomes | No. of patients in strata | Event (%) | Crude OR (95% CI) | p‐value | Crude p‐value for trend | Adjusted OR (95% CI) | p‐value | Adjusted p‐value for trend |
|---|---|---|---|---|---|---|---|---|
| hsCRP (mg/L) | 0.0571 | 0.2107 | ||||||
| Q1 | 1001 | 31 (3.10) | Ref | Ref | ||||
| Q2 | 1009 | 20 (1.98) | 0.63 (0.36–1.12) | 0.1150 | 0.51 (0.26–0.99) | 0.0478 | ||
| Q3 | 1012 | 25 (2.47) | 0.79 (0.47–1.3) | 0.3937 | 0.60 (0.32–1.15) | 0.1240 | ||
| Q4 | 1009 | 45 (4.46) | 1.46 (0.92–2.33) | 0.1111 | 1.28 (0.75–2.18) | 0.3676 | ||
| Per SD | 1.14 (1.05–1.25) | 0.0033 | 1.17 (1.06–1.31) | 0.0031 | ||||
| IL‐6 (pg/mL) | 0.0017 | 0.0087 | ||||||
| Q1 | 1007 | 20 (1.99) | Ref | Ref | ||||
| Q2 | 1007 | 28 (2.78) | 1.41 (0.79–2.52) | 0.2447 | 1.19 (0.58–2.45) | 0.6338 | ||
| Q3 | 1009 | 27 (2.68) | 1.36 (0.76–2.44) | 0.3065 | 1.33 (0.66–2.68) | 0.4267 | ||
| Q4 | 1008 | 46 (4.56) | 2.36 (1.39–4.02) | 0.0016 | 2.26 (1.16–4.41) | 0.0172 | ||
| Per SD | 1.37 (1.21–1.56) | <0.0001 | 1.43 (1.24–1.66) | <0.0001 | ||||
| IL‐6R (pg/mL) | 0.3409 | 0.7401 | ||||||
| Q1 | 1008 | 27 (2.68) | Ref | Ref | ||||
| Q2 | 1008 | 31 (3.08) | 1.15 (0.68–1.95) | 0.5944 | 1.12 (0.62–2.03) | 0.7172 | ||
| Q3 | 1008 | 27 (2.68) | 1.00 (0.58–1.72) | 1.0000 | 1.06 (0.58–1.95) | 0.8518 | ||
| Q4 | 1007 | 36 (3.57) | 1.34 (0.81–2.24) | 0.2491 | 1.14 (0.62–2.08) | 0.6793 | ||
| Per SD | 1.04 (0.88–1.24) | 0.6337 | 0.98 (0.80–1.21) | 0.8717 | ||||
| IL‐1Ra (pg/mL) | 0.0061 | 0.2540 | ||||||
| Q1 | 1007 | 20 (1.99) | Ref | Ref | ||||
| Q2 | 1008 | 26 (2.58) | 1.31 (0.73–2.36) | 0.3740 | 0.99 (0.51–1.94) | 0.9840 | ||
| Q3 | 1008 | 36 (3.57) | 1.83 (1.05–3.18) | 0.0328 | 1.46 (0.79–2.71) | 0.2272 | ||
| Q4 | 1008 | 39 (3.87) | 1.99 (1.15–3.43) | 0.0138 | 1.30 (0.69–2.44) | 0.4225 | ||
| Per SD | 1.13 (0.98–1.30) | 0.1074 | 1.09 (0.91–1.30) | 0.3624 | ||||
| Lp‐PLA2 mass (ng/mL) | 0.3042 | 0.4141 | ||||||
| Q1 | 1007 | 25 (2.48) | Ref | Ref | ||||
| Q2 | 1008 | 32 (3.17) | 1.29 (0.76–2.19) | 0.3503 | 1.40 (0.75–2.62) | 0.2903 | ||
| Q3 | 1008 | 30 (2.98) | 1.21 (0.70–2.06) | 0.4975 | 1.48 (0.78–2.79) | 0.2222 | ||
| Q4 | 1008 | 34 (3.37) | 1.37 (0.81–2.32) | 0.2378 | 1.33 (0.71–2.51) | 0.3767 | ||
| Per SD | 1.13 (0.95–1.34) | 0.1652 | 1.08 (0.89–1.33) | 0.4359 | ||||
| Lp‐PLA2‐A (nmol/min/mL) | 0.0798 | 0.2604 | ||||||
| Q1 | 1005 | 20 (1.99) | Ref | Ref | ||||
| Q2 | 1007 | 35 (3.48) | 1.77 (1.02–3.09) | 0.0436 | 1.96 (1.04–3.69) | 0.0377 | ||
| Q3 | 1010 | 30 (2.97) | 1.51 (0.85–2.67) | 0.1600 | 1.54 (0.79–3.00) | 0.2030 | ||
| Q4 | 1009 | 36 (3.57) | 1.82 (1.05–3.17) | 0.0337 | 1.70 (0.88–3.28) | 0.1147 | ||
| Per SD | 1.18 (0.99–1.41) | 0.0683 | 1.15 (0.93–1.41) | 0.1994 | ||||
| YKL‐40/CHI3L1 (pg/mL) | 0.0124 | 0.2887 | ||||||
| Q1 | 1007 | 20 (1.99) | Ref | Ref | ||||
| Q2 | 1008 | 31 (3.08) | 1.57 (0.89–2.77) | 0.1225 | 1.52 (0.77–2.98) | 0.2290 | ||
| Q3 | 1008 | 29 (2.88) | 1.46 (0.82–2.60) | 0.1967 | 1.31 (0.65–2.62) | 0.4539 | ||
| Q4 | 1008 | 41 (4.07) | 2.09 (1.22–3.60) | 0.0076 | 1.60 (0.80–3.22) | 0.1850 | ||
| Per SD | 1.28 (1.09–1.50) | 0.0027 | 1.18 (0.96–1.45) | 0.1206 | ||||
| MCP‐1 (pg/mL) | 0.7075 | 0.8098 | ||||||
| Q1 | 1007 | 32 (3.18) | Ref | Ref | ||||
| Q2 | 1008 | 28 (2.78) | 0.87 (0.52–1.46) | 0.5977 | 0.82 (0.45–1.49) | 0.5090 | ||
| Q3 | 1008 | 34 (3.37) | 1.06 (0.65–1.74) | 0.8055 | 1.17 (0.67–2.04) | 0.5801 | ||
| Q4 | 1008 | 27 (2.68) | 0.84 (0.50–1.41) | 0.5069 | 0.82 (0.45–1.49) | 0.5087 | ||
| Per SD | 0.94 (0.73–1.23) | 0.6641 | 0.93 (0.69–1.27) | 0.6587 |
Abbreviations: CI, confidence interval; hsCRP, high‐sensitivity C‐reactive protein; IL‐1Ra, IL‐1 receptor antagonist; IL‐6, interleukin‐6; IL‐6R, IL‐6 receptor; Lp‐PLA2, lipoprotein‐associated phospholipase A2; Lp‐PLA2‐A, Lp‐PLA2 activity; MCP‐1, monocyte chemotactic protein 1; ND, neurological deterioration; OR, odds ratio; Q1–4, quartiles 1–4; SD, standard deviation; YKL‐40/CHI3L1, chitinase‐3‐like protein 1.
3.3. Incremental predictive value of inflammatory profiles
We evaluated whether hsCRP, IL‐6, both hsCRP and IL‐6, or all inflammatory markers combined would have an increased predictive value in addition to including conventional risk factors (Table 4). The IDI and category‐free NRI were 0.012 (p = 0.0017) and 0.329 (p = 0.0018), respectively, with the addition of IL‐6, which contributed the most to improving the risk classification algorithms. However, simultaneous addition of IL‐6 and hsCRP did not improve the prediction of in‐hospital ND over IL‐6 alone.
TABLE 4.
Reclassification and discrimination statistics for in‐hospital ND status.
| Predictors | AUC | p‐value for AUC difference | IDI | p‐value | NRI | p‐value |
|---|---|---|---|---|---|---|
| Conventional risk factors | 0.691 | – | – | – | – | – |
| hsCRP | 0.702 | 0.1672 | 0.003 | 0.0668 | 0.180 | 0.0869 |
| IL‐6 | 0.720 | 0.0623 | 0.012 | 0.0017 | 0.329 | 0.0018 |
| IL‐1Ra | 0.692 | 0.7201 | 0.000 | 0.4365 | 0.064 | 0.5407 |
| Lp‐PLA2‐A | 0.695 | 0.4931 | 0.001 | 0.1798 | 0.018 | 0.8655 |
| YKL40/CHI3L1 | 0.696 | 0.5190 | 0.001 | 0.1801 | 0.095 | 0.3677 |
| hsCRP+IL‐6 | 0.720 | 0.1815 | 0.009 | 0.0099 | 0.249 | 0.0181 |
| All | 0.723 | 0.0594 | 0.016 | 0.0007 | 0.308 | 0.0034 |
Abbreviations: hsCRP, high‐sensitivity C‐reactive protein; IDI, integrated discrimination improvement; IL‐1Ra, IL‐1 receptor antagonist; IL‐6, interleukin‐6; IL‐6R, IL‐6 receptor; Lp‐PLA2, lipoprotein‐associated phospholipase A2; Lp‐PLA2‐A, Lp‐PLA2 activity; MCP‐1, monocyte chemotactic protein 1; ND, neurological deterioration; NRI, net reclassification index; ROC, area under the curve; YKL‐40/CHI3L1, chitinase‐3‐like protein 1.
3.4. Subgroup analysis
Subgroup analysis by comparing patients with a stroke etiology of LAA and SVO showed consistent results with the main analysis (Table 5). We evaluated the incremental predictive value of IL‐6 and hsCRP in patients with LAA or SVO etiology as well (Table 6). The addition of IL‐6 contributed the most to improving the risk classification algorithms and was consistent with the results of the main analysis. As for patients with SVO etiology, adding IL‐6, hsCRP, or the two markers simultaneously did not improve the predictive effect compared with the conventional model.
TABLE 5.
Inflammatory markers at admission and in‐hospital ND by stroke etiology subgroup.
| Outcomes | No of patients in strata | Event (%) | Crude OR (95% CI) | p | Crude P for trend | Adjusted OR (95% CI) | p | Adjusted P for trend |
|---|---|---|---|---|---|---|---|---|
| LAA | ||||||||
| IL‐6 | 0.0411 | 0.0614 | ||||||
| Q1 | 156 | 5 (3.21) | Ref | Ref | ||||
| Q2 | 197 | 6 (3.05) | 0.949 (0.284–3.168) | 0.9318 | 0.892 (0.191–4.165) | 0.8845 | ||
| Q3 | 242 | 8 (3.31) | 1.032 (0.332–3.215) | 0.9560 | 1.106 (0.272–4.494) | 0.8879 | ||
| Q4 | 250 | 18 (7.20) | 2.343 (0.852–6.445) | 0.0990 | 2.429 (0.651–9.056) | 0.1863 | ||
| Per SD | 1.579 (1.280–1.948) | <0.0001 | 1.620 (1.270–2.066) | 0.0001 | ||||
| hsCRP | 0.0675 | 0.0693 | ||||||
| Q1 | 158 | 4 (2.53) | Ref | Ref | ||||
| Q2 | 215 | 9 (4.19) | 1.682 (0.509–5.563) | 0.3942 | 3.185 (0.671–15.119) | 0.1448 | ||
| Q3 | 216 | 7 (3.24) | 1.289 (0.371–4.483) | 0.6892 | 1.498 (0.268–8.381) | 0.6453 | ||
| Q4 | 256 | 17 (6.64) | 2.738 (0.904–8.292) | 0.0747 | 4.516 (1.001–20.374) | 0.0498 | ||
| Per SD | 1.293 (1.096–1.526) | 0.0023 | 1.267 (1.065–1.508) | 0.0075 | ||||
| SVO | ||||||||
| IL‐6 | 0.5050 | 0.5574 | ||||||
| Q1 | 266 | 4 (1.50) | Ref | Ref | ||||
| Q2 | 272 | 6 (2.21) | 1.477 (0.4125.296‐) | 0.5490 | 1.210 (0.329–4.442) | 0.7743 | ||
| Q3 | 245 | 5 (2.04) | 1.365 (0.362–5.141) | 0.6460 | 1.272 (0.327–4.940) | 0.7286 | ||
| Q4 | 202 | 5 (2.48) | 1.662 (0.441–6.271) | 0.4531 | 1.517 (0.385–5.968) | 0.5512 | ||
| Per SD | 1.459 (1.078–1.975) | 0.0145 | 1.427 (1.035–1.968) | 0.0301 | ||||
| hsCRP | 0.8241 | 0.8948 | ||||||
| Q1 | 299 | 9 (3.01) | Ref | Ref | ||||
| Q2 | 268 | 0 (0.00) | <0.001 (<0.001– > 999.999) | 0.9430 | <0.001 (<0.001– > 999.999) | 0.9543 | ||
| Q3 | 238 | 8 (3.36) | 1.121 (0.426–2.951) | 0.8174 | 1.056 (0.385–2.898) | 0.9158 | ||
| Q4 | 180 | 3 (1.67) | 0.546 (0.146–2.044) | 0.3691 | 0.598 (0.154–2.321) | 0.4575 | ||
| Per SD | 0.994 (0.645–1.531) | 0.9774 | 0.999 (0.628–1.587) | 0.9950 | ||||
Abbreviations: CI, confidence interval; hsCRP, high‐sensitivity C‐reactive protein; IL‐6, interleukin‐6; LAA, large‐artery atherosclerosis; ND, neurological deterioration; OR, odds ratio; Q1–4, quartiles 1–4; SVO, small‐vessel occlusion.
TABLE 6.
Reclassification and discrimination statistics for in‐hospital ND status by stroke etiology subgroup.
| AUC | p‐value for AUC Difference | IDI | p‐value | NRI | p‐value | |
|---|---|---|---|---|---|---|
| LAA | ||||||
| conventional | 0.63807 | – | – | – | – | – |
| hsCRP | 0.67324 | 0.1878 | 0.019922 | 0.1465 | 0.11148 | 0.5513 |
| IL‐6 | 0.69454 | 0.1793 | 0.038193 | 0.0059 | 0.44838 | 0.0166 |
| hsCRP+IL‐6 | 0.69911 | 0.1402 | 0.045592 | 0.0090 | 0.43501 | 0.0201 |
| SVO | ||||||
| conventional | 0.79416 | – | – | – | – | – |
| hsCRP | 0.79405 | 0.3107 | 0.000001 | 0.9079 | 0.11965 | 0.5966 |
| IL‐6 | 0.80060 | 0.6862 | 0.017284 | 0.1822 | −0.019651 | 0.9307 |
| hsCRP+IL‐6 | 0.80251 | 0.6222 | 0.021581 | 0.1922 | 0.047598 | 0.8332 |
Abbreviations: AUC, area under the curve; hsCRP, high‐sensitivity C‐reactive protein; IDI, integrated discrimination improvement; IL‐6, interleukin‐6; LAA, large‐artery atherosclerosis; ND, neurological deterioration; NRI, net reclassification index; SVO, small‐vessel occlusion.
4. DISCUSSION
In this hospital‐based, centralization‐tested prospective study, higher IL‐6 and hsCRP levels were associated with in‐hospital ND and adverse long‐term outcomes, including unfavorable functional outcomes and death at 3 months in patients with minor AIS. Elevated IL‐6 was an independent predictor for ND in minor AIS patients with LAA and SVO subtypes, whereas a rising hsCRP remained indicative only in the LAA subtype but not in the SVO subtype. IL‐6 had the most notable incremental predictive value of in‐hospital ND in addition to conventional predictors, both collectively and in the LAA subgroup.
Most hospitalized patients with ND have early ND (END), compared to delayed or late ND 3 ; however, the time definition of END is still operational. Existing research suggests that patients who experience END are more likely to have poor long‐term outcomes. 3 , 19 , 24 In our study, we defined ND as a 4‐point increase in the NIHSS score. This corresponds with the definition in most previous studies. However, our results showed a lower incidence of ND than in previous studies. 6 , 25 , 26 , 27 , 28 This may be partly because of our selection of patients with minor strokes, and partly because we analyzed patients with ND at discharge; therefore, those who experienced a good rehabilitation process at a later stage were not included. We assumed that the identified inflammatory factors are more likely to be associated with non‐recovery, despite the patients being treated with the best medications. Moreover, higher levels of IL‐6 and hsCRP were related to long‐term adverse outcomes in patients with minor AIS. Independent associations of IL‐6 or YKL‐40 and poor functional outcomes in AIS patients have been found in a previous study. 29 Our refined population‐based study provides evidence for stratified treatment for a more specific subgroup of patients to be monitored during hospitalization.
To provide an overall, holistic view of post‐stroke inflammation, multiple biomarkers were analyzed in this study. Independent associations were found between levels of IL‐6 or hsCRP tested within 24 h of onset, in‐hospital ND, and unfavorable function outcome and death at 3 months. High hsCRP concentrations are associated with the progression of arteriosclerosis in community‐based cohorts. 30 , 31 Thus, hsCRP could be considered a marker of systemic and vascular inflammation. IL‐6 shows a clear dose–response association with the risk of incident AIS. 32 A previous study showed that over 80% of the functional damage after AIS resulted from perturbations to the IL‐6 pathway, rather than stroke recurrence. 33 As ND is considered to be a predictive factor for long‐term poor outcomes, 7 the correlation between ND and poor long‐term outcomes may result from a prolonged post‐stroke inflammatory state. IL‐6 signaling mechanisms 34 and levels of hsCRP 35 vary at different phases of an ischemic stroke; therefore, further studies are required to provide clear evidence of inflammatory profiles during admission, hospitalization, and follow‐up to verify this hypothesis.
In our study, patients with in‐hospital ND were found to have a stroke etiology of LAA and SVO. We compared the relationship between the two etiologies and IL‐6 or hsCRP. The independent association between higher hsCRP levels and the risk of ND was only observed in LAA stroke patients, but not in SVO stroke patients. Distributing atherosclerotic stenosis, occlusions, and LAA etiology were associated with END, 36 and LAA proved to be a stronger activator of inflammation than SAO, with distinctive changes in CRP. 37 Elevated IL‐6 levels remained an independent predictor for both etiologies, which was consistent with a previous study. 10 The distinct inflammatory activation mechanisms of the various etiologies may explain the above differences.
This study elevated the incremental predictive values of inflammatory markers at admission for in‐hospital ND. It may advocate for more aggressive treatment for patients with mild neurological deficit symptoms. The ongoing CHANCE‐3 trial (colchicine in high‐risk patients with acute minor‐to‐moderate ischemic stroke or TIA) may provide stronger evidence of the effects of anti‐inflammatory therapies on inflammatory factors and ND prognosis. 38
This study had several limitations. First, only biomarker measurements at admission were considered, precluding assessments of the changes in these markers. Second, the NIHSS score was measured only at admission and discharge; therefore, those with ND who subsequently recovered partially or completely during hospitalization were not included. However, this did not affect our results, as we aimed to identify patients who still had ND after treatment. Third, the mechanisms of ND can be categorized into ischemic progression, symptomatic hemorrhage, and brain edema 39 and may differ in their time of occurrence. We did not distinguish between these types in our study. Thus, future studies should conduct subgroup analyses on the time of onset and stroke etiology and correlate them with multiple continuous biomarker measurements.
5. CONCLUSION
In conclusion, elevated hsCRP and IL‐6 levels indicated higher in‐hospital ND risk. Adding inflammatory cytokines significantly improved risk classification, with IL‐6 as the main contributor. Our findings comprehensively described the characteristics of post‐stroke systemic and vascular inflammation. They may offer evidence supporting the potential use of inflammatory parameters as biomarkers for predicting ND, guiding the implementation of personalized treatments in AIS.
CONFLICT OF INTEREST STATEMENT
Yongjun Wang is an Editorial Board member of CNS Neuroscience and Therapeutics and a co‐author of this article. To minimize bias, he was excluded from all editorial decision‐making related to the acceptance of this article for publication in the manuscript under the disclosure section.
Supporting information
Data S1.
ACKNOWLEDGMENTS
We appreciate the staff and participants of the CNSR‐III studies for their outstanding contributions. This study was supported by grants from the National Natural Science Foundation of China (81870905, U20A20358) and from Beijing Hospitals Authority (QML20210501, PX2021024).
Yi L, Li Z‐X, Jiang Y‐Y, et al. Inflammatory marker profiles and in‐hospital neurological deterioration in patients with acute minor ischemic stroke. CNS Neurosci Ther. 2024;30:e14648. doi: 10.1111/cns.14648
Contributor Information
Yong‐Jun Wang, Email: yongjunwang@ncrcnd.org.cn.
Hong‐Qiu Gu, Email: guhongqiu@yeah.net.
DATA AVAILABILITY STATEMENT
The data are available from the corresponding author upon reasonable request.
REFERENCES
- 1. GBD 2019 Stroke Collaborators . Global, regional, and national burden of stroke and its risk factors, 1990–2019: a systematic analysis for the global burden of disease study 2019. Lancet Neurol. 2021;20(10):795‐820. [DOI] [PMC free article] [PubMed] [Google Scholar]
- 2. Tu WJ, Zhao Z, Yin P, et al. Estimated burden of stroke in China in 2020. JAMA Netw Open. 2023;6(3):e231455. [DOI] [PMC free article] [PubMed] [Google Scholar]
- 3. Liu P, Liu S, Feng N, Wang Y, Gao Y, Wu J. Association between neurological deterioration and outcomes in patients with stroke. Ann Transl Med. 2020;8:4. [DOI] [PMC free article] [PubMed] [Google Scholar]
- 4. Shkirkova K, Saver JL, Starkman S, et al. FAST‐MAG trial coordinators and investigators. Frequency, predictors, and outcomes of prehospital and early postarrival neurological deterioration in acute stroke: exploratory analysis of the FAST‐MAG randomized clinical trial. JAMA Neurol. 2018;75:1364‐1374. [DOI] [PMC free article] [PubMed] [Google Scholar]
- 5. Ogata T, Yasaka M, Wakugawa Y, Ibayashi S, Okada Y. Predisposing factors for acute deterioration of minor ischemic stroke. J Neurol Sci. 2009;287:147‐150. [DOI] [PubMed] [Google Scholar]
- 6. Saleem Y, Nogueira RG, Rodrigues GM, et al. Acute neurological deterioration in large vessel occlusions and mild symptoms managed medically. Stroke. 2020;51:1428‐1434. [DOI] [PubMed] [Google Scholar]
- 7. Rajajee V, Kidwell C, Starkman S, et al. Early MRI and outcomes of untreated patients with mild or improving ischemic stroke. Neurology. 2006;67:980‐984. [DOI] [PubMed] [Google Scholar]
- 8. Duan Z, Guo W, Tang T, Tao L, Gong K, Zhang X. Relationship between high‐sensitivity C‐reactive protein and early neurological deterioration in stroke patients with and without atrial fibrillation. Heart Lung. 2020;49:193‐197. [DOI] [PubMed] [Google Scholar]
- 9. Gong P, Liu Y, Huang T, et al. The association between high‐sensitivity C‐reactive protein at admission and progressive motor deficits in patients with penetrating artery infarctions. BMC Neurol. 2019;19:346. [DOI] [PMC free article] [PubMed] [Google Scholar]
- 10. Vila N, Castillo J, Dávalos A, Chamorro A. Proinflammatory cytokines and early neurological worsening in ischemic stroke. Stroke. 2000;31:2325‐2329. [DOI] [PubMed] [Google Scholar]
- 11. Wang Y, Hu S, Ren L, et al. Lp‐PLA2 as a risk factor of early neurological deterioration in acute ischemic stroke with TOAST type of large arterial atherosclerosis. Neurol Res. 2019;41:1‐8. [DOI] [PubMed] [Google Scholar]
- 12. Sabir Rashid A, Huang‐Link Y, Johnsson M, Wetterhäll S, Gauffin H. Predictors of early neurological deterioration and functional outcome in acute ischemic stroke: the importance of large artery disease, hyperglycemia and inflammatory blood biomarkers. Neuropsychiatr Dis Treat. 2022;18:1993‐2002. [DOI] [PMC free article] [PubMed] [Google Scholar]
- 13. Reiche EMV, Gelinksi JR, Alfieri DF, et al. Immune‐inflammatory, oxidative stress and biochemical biomarkers predict short‐term acute ischemic stroke death. Metab Brain Dis. 2019;34(3):789‐804. [DOI] [PubMed] [Google Scholar]
- 14. Gong P, Zhang X, Gong Y, et al. A novel nomogram to predict early neurological deterioration in patients with acute ischaemic stroke. Eur J Neurol. 2020;27(10):1996‐2005. [DOI] [PubMed] [Google Scholar]
- 15. Fukuoka Stroke Registry Investigators . Plasma C‐reactive protein and clinical outcomes after acute ischemic stroke: a prospective observational study. PloS One. 2016;11(6):e0156790. [DOI] [PMC free article] [PubMed] [Google Scholar]
- 16. Seo WK, Seok HY, Kim JH, et al. C‐reactive protein is a predictor of early neurologic deterioration in acute ischemic stroke. J Stroke Cerebrovasc Dis. 2012;21(3):181‐186. [DOI] [PubMed] [Google Scholar]
- 17. Zang RS, Zhang H, Xu Y, et al. Serum C‐reactive protein, fibrinogen and D‐dimer in patients with progressive cerebral infarction. Transl Neurosci. 2016;7(1):84‐88. [DOI] [PMC free article] [PubMed] [Google Scholar]
- 18. Deng QW, Wang Q, Li B, et al. Inflammatory factors as potential markers of early neurological deterioration in acute ischemic stroke patients receiving endovascular therapy‐ the AISRNA study. J Inflamm Res. 2021;14:4399‐4407. [DOI] [PMC free article] [PubMed] [Google Scholar]
- 19. Geng H‐H, Wang Q, Li B, et al. Early neurological deterioration during the acute phase as a predictor of long‐term outcome after first‐ever ischemic stroke. Medicine (Baltimore). 2017;96(51):e9068. [DOI] [PMC free article] [PubMed] [Google Scholar]
- 20. Bharosay A, Saxena K, Varma M, Bharosay VV, Pandey A. Correlation between proinflammatory serum markers: high sensitivity C‐reactive protein, interleukin‐6 with disability score in acute ischemic stroke. Indian J Clin Biochem. 2011;26(3):279‐282. [DOI] [PMC free article] [PubMed] [Google Scholar]
- 21. Castellanos M, Sobrino T, Pedraza S, et al. High plasma glutamate concentrations are associated with infarct growth in acute ischemic stroke. Neurology. 2008;71(23):1862‐1868. [DOI] [PubMed] [Google Scholar]
- 22. Wang Y, Jing J, Meng X, et al. The third China National Stroke Registry (CNSR‐III) for patients with acute ischaemic stroke or transient ischaemic attack: design, rationale and baseline patient characteristics. Stroke Vasc Neurol. 2019;4:158‐164. [DOI] [PMC free article] [PubMed] [Google Scholar]
- 23. Austin PC. Using the standardized difference to compare the prevalence of a binary variable between two groups in observational research. Commun Stat Simul Comput. 2009;38(6):1228‐1234. [Google Scholar]
- 24. Vynckier J, Maamari B, Grunder L, et al. Early neurologic deterioration in lacunar stroke: clinical and imaging predictors and association with long‐term outcome. Neurology. Published online. 2021;97(14):e1437‐e1446. [DOI] [PubMed] [Google Scholar]
- 25. Ois A, Martinez‐Rodriguez JE, Munteis E, et al. Steno‐occlusive arterial disease and early neurological deterioration in acute ischemic stroke. Cerebrovasc Dis. 2008;25:151‐156. [DOI] [PubMed] [Google Scholar]
- 26. Acute Stroke Accurate Prediction Study (ASAP) Investigators . Ninety‐day outcome rates of a prospective cohort of consecutive patients with mild ischemic stroke. Stroke. 2012;43:560‐562. [DOI] [PMC free article] [PubMed] [Google Scholar]
- 27. Hsu CY, Cheng CY, Tsai YH, et al. Perfusion‐diffusion mismatch predicts early neurological deterioration in anterior circulation infarction without thrombolysis. Curr Neurovasc Res. 2015;12:277‐282. [DOI] [PMC free article] [PubMed] [Google Scholar]
- 28. Seners P, Ben Hassen W, Lapergue B, et al. Prediction of early neurological deterioration in individuals with minor stroke and large vessel occlusion intended for intravenous thrombolysis alone. JAMA Neurol. 2021;78:321‐328. [DOI] [PMC free article] [PubMed] [Google Scholar]
- 29. CNSR‐III Investigators . Interleukin‐6 and YKL‐40 predicted recurrent stroke after ischemic stroke or TIA: analysis of 6 inflammation biomarkers in a prospective cohort study. J Neuroinflammation. 2022;19(1):131. [DOI] [PMC free article] [PubMed] [Google Scholar]
- 30. Wang J, Liu Y, Zhang L, et al. Associations of high sensitivity C‐reactive protein levels with the prevalence of asymptomatic intracranial arterial stenosis. Eur J Neurol. 2014;21:512‐518. [DOI] [PubMed] [Google Scholar]
- 31. Xu R, Zhang Y, Gao X, Wan Y, Fan Z. High‐sensitivity CRP (C‐reactive protein) is associated with incident carotid artery plaque in Chinese aged adults. Stroke. 2019;50:1655‐1660. [DOI] [PubMed] [Google Scholar]
- 32. Papadopoulos A, Palaiopanos K, Björkbacka H, et al. Circulating interleukin‐6 levels and incident ischemic stroke: a systematic review and meta‐analysis of prospective studies. Neurology. 2022;98:e1002‐e1012. [DOI] [PMC free article] [PubMed] [Google Scholar]
- 33. Gu H‐Q, Yang K‐X, Li J‐J, et al. Mediation effect of stroke recurrence in the association between post‐stroke interleukin‐6 and functional disability. CNS Neurosci Ther. 2023;29(11):3579‐3587. [DOI] [PMC free article] [PubMed] [Google Scholar]
- 34. Lockard GM, Alayli A, Monsour M, et al. Probing interleukin‐6 in stroke pathology and neural stem cell transplantation. Int J Mol Sci. 2022;23(24):15453. [DOI] [PMC free article] [PubMed] [Google Scholar]
- 35. Ladenvall C, Jood K, Blomstrand C, Nilsson S, Jern C, Ladenvall P. Serum C‐reactive protein concentration and genotype in relation to ischemic stroke subtype. Stroke. 2006;37:2018‐2023. [DOI] [PubMed] [Google Scholar]
- 36. Lee SJ, Lee DG. Distribution of atherosclerotic stenosis determining early neurologic deterioration in acute ischemic stroke. PloS One. 2017;12(9):e0185314. [DOI] [PMC free article] [PubMed] [Google Scholar]
- 37. Zeng L, He X, Liu J, et al. Differences of circulating inflammatory markers between large‐ and small vessel disease in patients with acute ischemic stroke. Int J Med Sci. 2013;10(10):1399‐1405. [DOI] [PMC free article] [PubMed] [Google Scholar]
- 38. Wang Y, Li J, Johnston SC, et al. Colchicine in high‐risk patients with acute minor‐to‐moderate ischemic stroke or transient ischemic attack (CHANCE‐3): rationale and design of a multicenter randomized placebo‐controlled trial. Int J Stroke. 2023;18:873‐878. [DOI] [PubMed] [Google Scholar]
- 39. Kim JM, Bae JH, Park KY, et al. Incidence and mechanism of early neurological deterioration after endovascular thrombectomy. J Neurol. 2019;266:609‐615. [DOI] [PubMed] [Google Scholar]
Associated Data
This section collects any data citations, data availability statements, or supplementary materials included in this article.
Supplementary Materials
Data S1.
Data Availability Statement
The data are available from the corresponding author upon reasonable request.