Abstract
Pediatric acute myeloid leukemia (AML) is a highly heterogeneous disease making standardized measurable residual disease (MRD) assessment challenging. Currently, patient-specific DNA-based assays are only rarely applied for MRD assessment in pediatric AML. We tested whether quantification of genomic breakpoint-specific sequences via quantitative polymerase chain reaction (gDNA-PCR) provides a reliable means of MRD quantification in children with non-standard-risk AML and compared its results to those obtained with state-of-the-art ten-color flow cytometry (FCM). Breakpoint-specific gDNA-PCR assays were established according to Euro-MRD consortium guidelines. FCM-MRD assessment was performed according to the European Leukemia Network guidelines with adaptations for pediatric AML. Of 77 consecutively recruited non-standard-risk pediatric AML cases, 49 (64%) carried a chromosomal translocation potentially suitable for MRD quantification. Genomic breakpoint analysis returned a specific DNA sequence in 100% (41/41) of the cases submitted for investigation. MRD levels were evaluated using gDNA-PCR in 243 follow-up samples from 36 patients, achieving a quantitative range of at least 10-4 in 231/243 (95%) of samples. Comparing gDNA-PCR with FCM-MRD data for 183 bone marrow follow-up samples at various therapy timepoints showed a high concordance of 90.2%, considering a cut-off of ≥0.1%. Both methodologies outperformed morphological assessment. We conclude that MRD monitoring by gDNA-PCR is feasible in pediatric AML with traceable genetic rearrangements and correlates well with FCM-MRD in the currently applied clinically relevant range, while being more sensitive below that. The methodology should be evaluated in larger cohorts to pave the way for clinical application.
Introduction
Acute myeloid leukemia (AML) is the second most frequent leukemia entity in children and adolescents, and the most aggressive variant. Despite refinement of therapeutic approaches, about 35% of pediatric patients with AML still suffer from relapse.1-4 State-of-the-art clinical trial protocols rely on risk-adapted treatment to maximize outcome while minimizing therapy-related side effects. Currently, pediatric AML patients are stratified according to the presence of specific chromosomal and/or molecular aberrations into standard-, intermediate- and high-risk groups, each characterized by distinct overall survival and relapse rates. However, due to the highly heterogeneous nature of the disease, outcomes vary substantially even among patients of the same risk group.5-8 Thus, there is an urgent need for novel diagnostic tools to improve AML risk stratification. In addition to the genetic stratification, the precise monitoring of treatment response at the sub-microscopic level, also referred to as measurable residual disease (MRD) assessment, has been proven crucial for the identification of AML patients at risk of relapse and represents an essential tool in the post-induction decision-making process.9-14 It is now widely accepted that sole reliance on morphological complete remission is insufficient to determine relapse risk for individual patients.15-17
Different techniques are available for MRD assessment in pediatric AML, of which quantitative RNA-based polymerase chain reaction (RT-PCR) analysis of specific gene fusions as well as multiparameter flow cytometry (FCM) are the only methods routinely used in a clinical setting.14,17 Validated molecular MRD targets for RT-PCR in AML include PML::RARA, the core-binding factor (CBF) translocations CBFB::MYH11 and RUNX1::RUNX1T1, and mutations in NPM1. Despite their straightforward implementation in the diagnostic workflow, RT-PCR-based MRD methodologies have two major disadvantages. First, RT-PCR relies on transcript levels rather than cell number as a surrogate for leukemia cell burden, which prohibits precise MRD quantification. Second, only a handful of targets are currently used for MRD assessment by RT-PCR, among which aberrations typically found in intermediate- and high-risk patients are particularly underrepresented. In contrast, multicolor FCM is applicable in more than 90% of pediatric AML patients10,14,18 and is therefore currently the method of choice for response assessment in most clinicals trials.9,11,13-15
DNA-based PCR assays utilizing patient-specific genomic breakpoint sequences are only rarely applied to assess treatment response in AML, despite their widespread use for MRD quantification in acute lymphoblastic leukemia based on immunoglobulin/T-cell receptor or KMT2A rearrangements (KMT2Ar). Advantages of DNA-based assays are the more accurate quantification of MRD levels as a surrogate of cell number due to the allele-specific nature of the assay and the highly standardized interpretation of results.19,20 Furthermore, superior stability of DNA allows for reliable MRD quantification even after cross-country shipment of samples and the patient-specific quantification reduces risk of intra-laboratory sample contamination to a minimum.
In the present study, our aim was to determine the feasibility of using genomic breakpoint-specific MRD quantification to monitor treatment response in intermediateand high-risk subtypes of pediatric AML prospectively in a routine clinical setting. To this end we also compared the performance of the genomic DNA (gDNA)-based MRD assessment with ten-color FCM-based MRD detection as well as with cytomorphological evaluation by experienced hematologists.
Methods
Patients and samples
Sampling and research were approved by the local Ethics Committee, and informed consent was obtained from patients, patients’ parents or legal guardians according to the Declaration of Helsinki. Morphology and general genetic data were retrieved from the Austrian pediatric AML-Berlin-Frankfurt Münster (BFM) registry.
We used bone marrow (BM; n=206) and peripheral blood (PB; n=37) samples from 41 pediatric patients with AML recruited between 2013 and 2022 (recruitment details in Online Supplementary Figure S1; patients’ characteristics in Online Supplementary Table S1). All 41 patients had non-standard-risk AML (i.e., intermediate risk or high risk) according to the therapy protocol valid at that time, relapsed AML, secondary AML or mixed phenotype leukemias with dominant myeloid lineage. Patients were treated according to protocols AML-BFM 2004,21 AML-BFM 2012,22 or I-BFM Relapsed AML 2001/01.23 For comparison of gDNA-PCR and FCM-MRD only data from BM samples were used. In total, 183 follow-up samples from 36 patients at various timepoints during or after therapy were available (Online Supplementary Table S2). For details on the French-American-British (FAB) or genetic classification see Online Supplementary Tables S1 and S3, respectively.
Chromosomal breakpoint characterization and MRD assessment via quantitative PCR
Mononuclear cells were isolated from BM or PB at AML diagnosis or follow-up timepoints using Ficoll® density-gradient separation followed by isolation of gDNA via the QIAmp Blood Mini Kit (Qiagen, Hilden, Germany) according to the manufacturer’s instructions. The isolated diagnostic DNA was then sent for breakpoint characterization and sequence analysis to the Diagnostic Center of Acute Leukemia at the Goethe University of Frankfurt/Main. Based on the identified sequence a chromosomal breakpoint-specific qPCR-assay, consisting of forward/reverse primers and a fluorescently labeled Taqman® probe, was designed. To ensure optimal sensitivity and specificity of our assays the primers and probes were designed according to the following qPCR guidelines. Probe: annealing temperature ~67-70°C; length ~18-34 bp (ideally covering the breakpoint); fluorescent labels 5´FAM and 3´TAMRA. Primer: annealing temperature ~10°C below the annealing temperature of the probe; length 18-30 bp; amplicon length 150-550 bp. As a general principle, probe position was aimed closer to the 3’ end of the amplicon than to the 5’ end.
MRD quantification and data interpretation of follow-up samples were performed according to the EuroMRD guidelines for MRD assessment via real-time quantitative PCR.24 Briefly, for each PCR reaction 500 ng of DNA, corresponding to approximately 105 cells, were used. To assess sensitivity and linearity of the individual PCR assays reliably, each MRD quantification in follow-up samples included a standard curve of serially diluted diagnostic BM from the respective patients. To identify unspecific PCR amplifications each analysis also included control reactions consisting of a DNA mixture from PB mononuclear cells from at least five healthy donors.
FCM-MRD monitoring
The samples were stained using a dual tube approach with customized dried format antibody cocktail tubes (DuraCloneTM, Beckman Coulter, Brea, CA, USA). The approach allows for MRD detection in AML by immunophenotype as well as by different-from-normal assessment. Both tubes contain eight fluorochrome-conjugated antibodies of which five are shared by both tubes (“backbone markers”: CD34, CD117, CD33, HLA-DR and CD45). The “leukemia-associated immunophenotype tube” consisted additionally of antibodies against CD11b/CD14/CD15 plus two patient-specific drop-in markers in the phycoerythrin and allophycocyanin channels. The “colony formation unit tube” consisted of antibodies to CD38/CD45RA/CD123 in addition to the backbone markers. CD371 and CD99 were used as fixed drop-in markers in this tube. For full details on antibodies see Online Supplementary Table S4.
Patient-specific markers (drop-ins) for optimal discrimination of leukemic blasts from normal regenerating cells were determined at the time of diagnosis and used in the follow-up for MRD detection and quantification.14 As patient-specific drop-in markers against antigens aberrantly expressed by AML blasts, we used antibodies to either lymphoid antigens (CD2, CD4, CD7, CD19, CD56) or other surface molecules (CD11a, CD13, CD48, CD71, CD99, NG2).14 Both tubes were run at initial diagnosis, and during follow-up using the best discriminating drop-in markers. Data files of diagnostic and follow-up samples were analyzed independently by at least two reviewers. Positive MRD was accepted in the case of a minimum of 50 clustered cellular events fulfilling at least two of the following criteria: (i) immature cell; (ii) resembling the initial leukemic immunophenotype determined at diagnosis, or (iii) unambiguously different from normal. If the blasts could not be clearly distinguished from normal cells and/or the number of blasts was below 50 clustered events, MRD was classified as ambiguous. Samples labeled as ambiguous were flagged but regarded as negative both in this study as well as for clinical trial stratification. MRD was calculated as the proportion of leukemic cells among CD45+ cells (the denominator).
Figure 1.
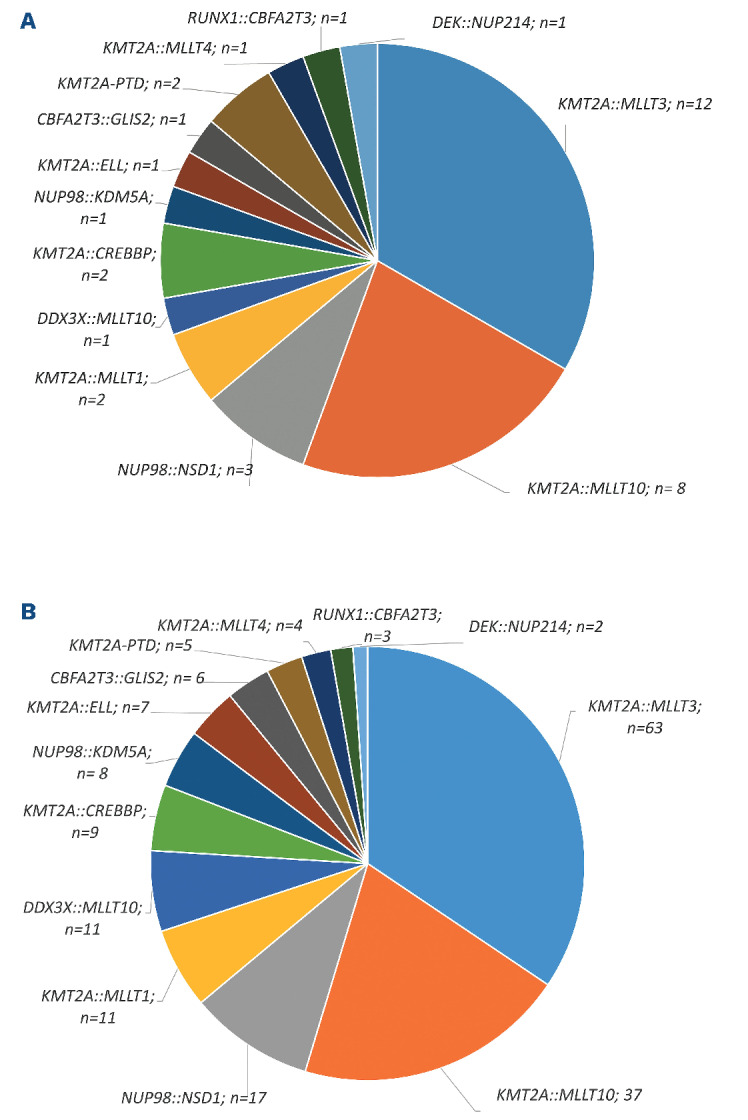
Distribution of identified genomic breakpoint sequences. Distribution of the genomic breakpoint sequences that were identified among (A) patients (N=36) and (B) all follow-up samples (N=183) with matched genomic DNA polymerase chain reaction-based measurable residual disease (MRD) data and flow cytometry-based MRD data.
Statistics
The statistical analysis was done using GraphPad Prism 8.3.0. and χ2 tests.
Results
Using gDNA-PCR methodology for MRD assessment in children with AML
Between 2013 and 2021, a total of 77 pediatric patients with non-standard-risk AML (n=58) and other cases at risk (n=19; including relapsed AML, secondary AML and mixed phenotype leukemias with dominant myeloid lineage) were recruited to the AML-BFM registry in Austria. It should be noted that 13 (22.4%) of the 58 non-standard-risk patients relapsed during the study but these were not counted twice in the relapsed AML group, hence, this term refers here only to patients enrolled in the study at relapse (i.e., with a de novo diagnosis before the start of the study or abroad).
Of the 77 cases, 49 harbored a recurrent gene fusion (63.6%) and were therefore eligible for breakpoint-specific MRD quantification. Focusing in an initial phase of the study only on cases of KMT2Ar AML, we excluded five otherwise eligible non-KMT2Ar cases in this early period.25,26 Two further cases did not render sufficient material for the analysis and one patient died before treatment. Hence the specific genomic breakpoint was investigated in 41 patients and could be determined in all of them (100%) (Online Supplementary Figure S1). Details of the patients’ characteristics are summarized in Online Supplementary Table S1.
Based on the availability of at least one follow-up sample, we were able to apply the gDNA-PCR MRD methodology to 36 of the 41 patients (243 follow-up samples in total). No follow-up samples were received from five patients because of early death before follow-up assessment (n=4) or lack of samples due to clinician’s decision (n=1). In 226/243 (93%) of the analyses we achieved a quantitative range of 10-4; in 12 cases (5%) the quantitative range was 5x10⁻⁴ and in five cases (2%) it was 10-5 (Online Supplementary Figure S1).
From all 36 patients and from 183 follow-up samples (BM only; median: 5 [range 1-11] follow-up samples/patient), we had matching FCM-MRD data. The distribution of the genetic subtypes among those patients and samples is shown in Figure 1A, B and Online Supplementary Table S3.
Figure 2.
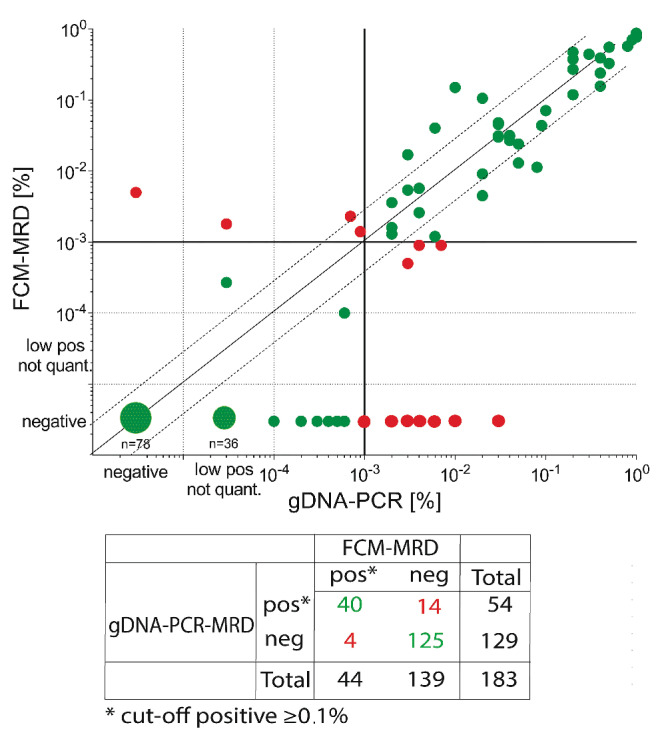
Comparison of gDNA-PCR MRD and FCM-MRD. The plots are partitioned into four quadrants by the clinically relevant threshold of 0.1% (vertical and horizontal lines). Each symbol represents one MRD estimate. Values that are MRD-positive or MRD-negative considering the cut off of 0.1% using both methodologies are considered concordant (green dots), whereas PCR-MRDneg/FCM-MRDpos and PCR-MRDpos/FCM-MRDneg values are considered discordant (red dots). In addition, dashed lines above/below the x=y line mark the range of variance according to Dworzak et al.,35 i.e. between 3x larger or smaller till 1/3 of the x=y value. Statistics performed using Graph-Pad Prism. gDNA: genomic DNA; PCR: polymerase chain reaction; MRD: measurable residual disease; FCM: flow cytometry.
Concordance between gDNA-PCR and FCM-MRD data
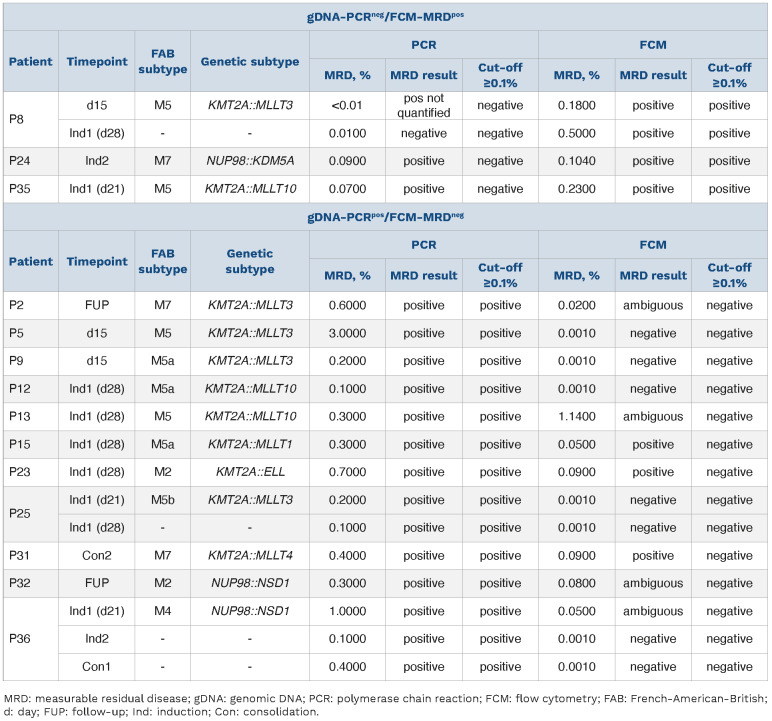
To evaluate the performance of genomic breakpoint-specific MRD quantification we compared its results to the MRD levels obtained by the standard-of-care FCM assay in the aforementioned cohort of 183 follow-up samples. Overall, the concordance rate was 90.2% (165/183), when considering the clinically relevant cut-off of 0.1% (≥0.1%, MRD-positive; <0.1%, MRD-negative) (Figure 2, Table 1). Only 4/183 (2.2%) were positive by FCM-MRD while being considered negative with gDNA-PCR. Three of these samples were positive by gDNA-PCR but below the threshold of 0.1% (Table 1). There were more discordant samples with negative FCM-MRD but positive gDNA-PCR MRD values (14/183; 7.7%).
These 14 gDNA-PCRpos/FCM-MRDneg follow-up samples (Figure 2) were from 11 different patients (Table 1). Three of the 14 samples were positive with FCM-MRD but below the threshold of 0.1%. In seven samples no residual disease was found with FCM-MRD. The remaining four of these 14 samples were flagged as ambiguous by FCM-MRD because cells resembling the initial phenotype were detected but no clear discrimination between blasts and regenerating cells was possible.
Table 1.
Summary of cases with discrepant MRD votes between gDNA-PCR and FCM-MRD.
Notably, in total 21/183 samples (11.5%) (from 14 different patients) were flagged as ambiguous with FCM-MRD, four of which were gDNA-PCRpos with MRD ≥0.1% and 11 were PCR-positive but <0.1%. Six further FCM-MRD ambiguous samples were negative with gDNA-PCR (no threshold).
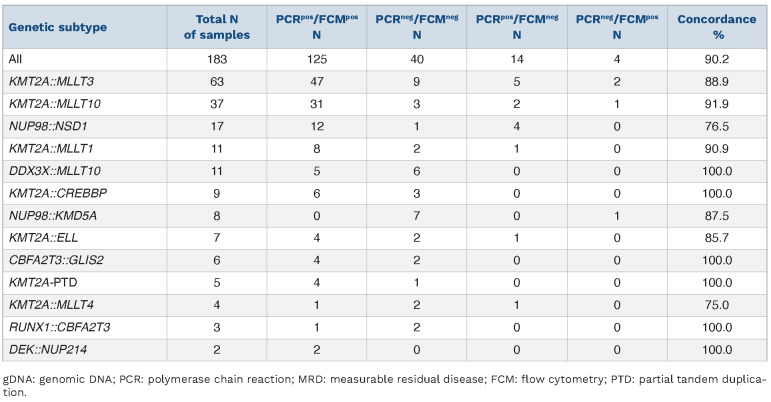
When no threshold was applied, overall concordance dropped to 68.9%, with most of the discordant samples being positive with gDNA-PCR and negative with FCM-MRD (56/183; 30.6%) (Online Supplementary Tables S5 and S6). Of those 56 gDNA-PCRpos samples, 36 were positive but not quantifiable (value below the quantitative range but above the sensitivity range). The PCR-MRD values of the 20 remaining discordant samples were lower than those called positive by both methodologies (median: 0.1% [0.003-3%] vs. 3% [0.01-100%]), indicating a higher sensitivity of the gDNA-PCR methodology compared to the FCM-MRD assay applied. Next, we compared the concordance of the two methodologies with respect to different genetic (Figure 3, Online Supplementary Figure S2, Table 2, Online Supplementary Table S5) as well as morphological (FAB) subtypes (Figure 4, Online Supplementary Figure S3, Table 3, Online Supplementary Table S6). Due to the low number of some genetic subtypes, we divided the samples according to their genomic aberrations into three groups: KMT2Ar (n=136), NUP98 (n=25) and miscellaneous (n=22) (Figure 3A).
Figure 3.
Comparison of gDNA-PCR MRD and FCM-MRD based on genetic subtype. A threshold of ≥0.1% was used to define positivity. (A) Genetic subtypes were summarized in three major groups. All cases with KMT2A rearrangements were summarized in the group “KMT2Ar”, those with NUP98 gene fusions in the group “NUP98” and all cases with other aberrations in the group “Miscellaneous”; P=0.069 (not statistically significant). (B) Concordance of gDNA-PCR MRD and FCM-MRD in the KMT2Ar group excluding MLLT3 cases (left) and in the KMT2A::MLLT3 group only (right); P=0.56 (not statistically significant). gDNA: genomic DNA; PCR: polymerase chain reaction; MRD: measurable residual disease; FCM: flow cytometry; w/o: without.
Table 2.
Concordance of gDNA-PCR MRD and FCM-MRD data based on genetic subtype. A threshold of ≥0.1% was used to define positivity.
We observed the highest concordance rates in the miscellaneous and KMT2Ar groups with, respectively, 100% and 90.4% concordance of samples with the two methodologies. A lower concordance (80%) was found in the NUP98 subgroup. However, the difference in concordance between the three groups did not reach statistical significance (P=0.069). Within the KMT2Ar group, the KMT2A::MLLT3 samples, which constituted the single most frequent genetic subtype (n=63), and the remaining KMT2Ar samples (n=73) also exhibited similar concordance rates (88.9% and 91.8%, respectively; P=0.56, ns) (Figure 3B). Without the threshold, no significant difference between genetic subtypes was unveiled (Online Supplementary Figure S2).
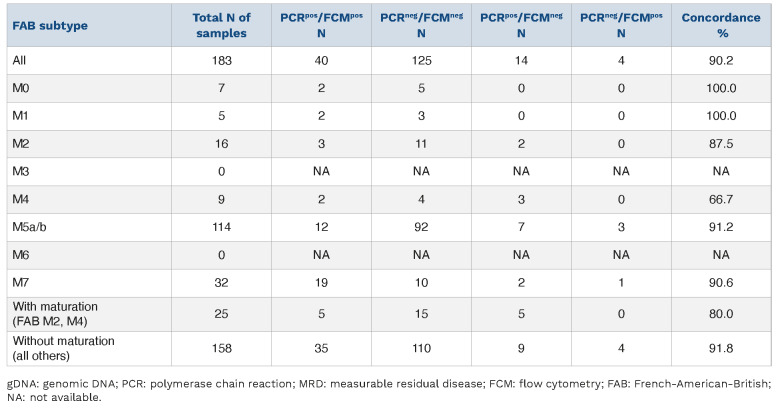
In some FAB subtypes the concordance was lower than in others (Table 3). Those with lower concordance were FAB subtypes presenting with maturation (M2, M4).
Figure 4.
Comparison of gDNA-PCR MRD and FCM-MRD based on FAB classification. A threshold of ≥0.1% was used to define MRD positivity. The presence of maturation leads to reduced concordance of gDNA-PCR MRD and FCM-MRD (P=0.066). Statistical analysis was done using GraphPad Prism 8.3.0 and χ2 tests. gDNA: genomic DNA; PCR: polymerase chain reaction; MRD: measurable residual disease; FCM: flow cytometry; FAB: French-American-British.
Table 3.
Concordance of gDNA-PCR MRD and FCM-MRD data based on FAB subtype. A threshold of ≥0,1% was used to define positivity.
When we summarized FAB subtypes without (M0, M1, M5, M7) and with (M2, M4) maturation the concordance was 91.8% and 80%, respectively (P=0.066) (Figure 4). When using no threshold, this difference was even more obvious (P=0.0039) (Online Supplementary Figure S3).
Comparison of the gDNA-PCR and FCM-MRD methodologies with standard morphological assessment
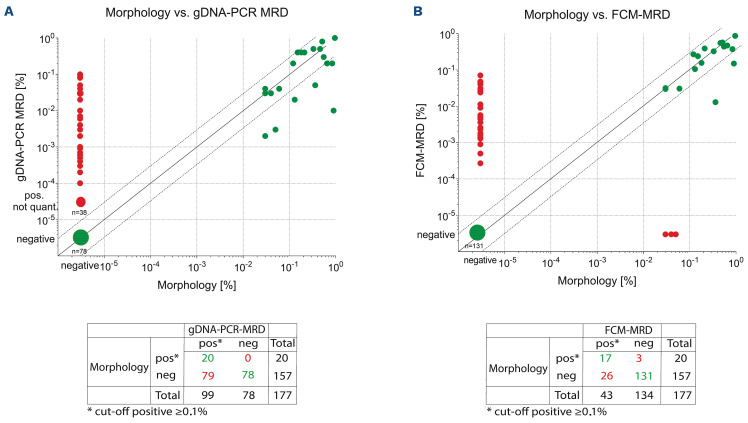
We compared gDNA-PCR and FCM-MRD technologies with expert-based morphological assessment (n=177 samples with triple data).
When no threshold was applied (Figure 5), 44.6% (79/177) of all samples were found to be gDNA-PCRpos/morphologyneg and 16.3% (26/177) positive only with FCM-MRD but not by morphological assessment.
All 26 FCM-MRDpos/morphologyneg samples were also gDNA-PCRpos. Only 20 (11.3%) and 17 (9.6%) of the 177 samples were double-positive by one of the MRD technologies and morphology, respectively. Together, these results suggest that both MRD technologies are much more sensitive than morphological assessment (P=0.0037).
Discussion
In this study we aimed to provide proof of principle for the feasibility of using genomic-breakpoint specific MRD quantification for treatment-response assessment in pediatric patients with intermediate- and high-risk AML. gDNA-based MRD assessment is a three-step process consisting of target identification, qPCR-assay design and MRD quantification in follow-up samples. This makes breakpoint-specific MRD assessment inherently more complex than FCM- or fusion transcript-specific quantification, which rely on disease-specific rather than patient-specific markers to quantify leukemic cells. However, despite this complexity we were able to obtain target sequences in 100% of samples that were sent for sequencing analysis. Subsequent PCR-primer and -probe design yielded MRD assays with excellent performance characteristics for all patients with available follow-up samples. Indeed, in 93% of all analyzed samples we were able to reach a quantitative range of at least 10-4. This corresponds to the experience with breakpoint-specific MRD quantification in acute lymphoblastic leukemia, in which KMT2Ar-specific target sequences regularly result in MRD assays with high sensitivity and low background amplification.27,28 Importantly, in our pediatrc AML cohort, this also extended to targets other than KMT2Ar, confirming that these beneficial characteristics are a more general feature of breakpoint-specific MRD quantification, irrespective of the underlying breakpoint sequences. This is in line with a recent report by Lukes et al. who outlined in a cohort of 23 AML patients with standard-risk genomic aberrations that PML::RARA, CBFB::MYH11 and RUNX1::RUNX1T1 provide reliable targets for gDNA-based MRD quantification.19
Figure 5.
Concordance of gDNA-PCR MRD and FCM-MRD with conventional morphological assessment. Each symbol represents one MRD estimate. Values that are MRD-positive or MRD-negative using both methodologies are considered concordant (green dots), whereas discordant samples are negative with one methodology but positive with another (red dots). In addition, dashed lines above/below the x=y line mark the range of variance according to Dworzak et al.,35 i.e. between 3x larger or smaller till 1/3 of the x=y value. Statistics performed using GraphPad Prism. gDNA: genomic DNA; PCR: polymerase chain reaction; MRD: measurable residual disease; FCM: flow cytometry.
Regarding turnaround times, the gDNA-PCR assays were available within 5-7 weeks after diagnosis in the majority of patients. This is comparable to the availability of KMT2Ar-based MRD results in acute lymphoblastic leukemia clinical trials. Consequently, for a typical AML treatment regimen this would allow the implementation of gDNA-MRD for the combined assessment of end-of-induction 1 and 2 therapy responses.
Unlike FCM, breakpoint-specific MRD quantification is restricted to cases with traceable gene fusions, thereby limiting its application up to a maximum of around 74% of pediatric AML cases.29 In our cohort 64% of non-standard-risk patients carried an eligible target, making genomic breakpoint-specific MRD quantification a valid option for treatment response assessment in the majority of these more aggressive AML subtypes. Among these, KMT2Ar-positive pediatric AML might benefit particularly from breakpoint-specific MRD assessment. A study by Weel-deren et al. (personal communication) just recently highlighted the importance of MRD quantification by FCM predicting survival and relapse risk in a cohort of KMT2Ar pediatric AML. It is tempting to speculate whether the inclusion of an even more sensitive MRD methodology, such as breakpoint-specific MRD, would further improve risk stratification of this subgroup of patients.
As expected most discrepant cases (14/18) were FCMneg, but gDNA-PCRpos (0.1% threshold). We did not detect significant differences between gross genetic subgroups (borderline significance was found for NUP98-rearranged cases) but found a trend towards lower concordance in cases characterized by signs of maturation within the leukemic cell population (FAB M2, M4). A similar phenomenon was recently described by Karlsson et al.30 While comparing RT-qPCR-MRD and FCM-MRD they observed FCM-MRDneg samples which continued to show persistent positivity as assessed by RT-qPCR, suggesting the presence of fusion transcripts in maturing, or terminally differentiated AML cells, which are often hard to identify via FCM. For CBF- or PML::RARA-AML subtypes31,32 such persistence of stable low-level MRD in BM during consolidation or at therapy completion has already been shown to have no negative impact on outcome. However, sustained MRD positivity in PB (rather than BM) or increasing levels during or after consolidation may be a more accurate discriminator of impending relapse.32
Whether the same also holds true for other AML subtypes, particularly high-risk cases such as those included in our cohort, remains to be determined. Given its resistance to gene expression variations (potentially yielding variable transcript levels from similar cell numbers), genomic breakpoint-specific MRD might prove essential in deciphering the predictive value of persistent MRD in these cases.
Lowering the threshold from 0.1% for positivity resulted in a significant decrease in concordance rates between gDNA-MRD and FCM-MRD from an average of 90% to 69%, thereby revealing the true potential of breakpoint-specific MRD quantification in pediatric AML. This drop was mainly driven by an increase in samples positive with gDNA-PCR at a level below 0.1% but negative with FCM-MRD. This underlines the higher sensitivity achieved with the breakpoint-specific genomic PCR. Due to the small size of our cohort, we could not study any impact of this increased sensitivity on outcome measures. Besides the increased sensitivity of the gDNA-PCR methodology and the ability of the latter to detect gene fusions in terminally differentiated cells as well, technical aspects such as different sampling (1st pull BM aspirate for FCM-MRD vs. pooled samples in the case of gDNA-PCR MRD) may also contribute to discrepancies in MRD levels between the two methodologies.
An average of 45% and 16% of samples were found to be gDNA-PCRpos and FCMpos, respectively, but negative according to morphology, confirming previous reports that the assessment of remission status should not rely solely on BM morphology, but also involve the quantification of MRD.33
Our investigation has several limitations. The limited number of patients included in the study leads to relatively few data regarding individual therapy timepoints and does not allow correlations to be established between the study’s findings and clinical outcomes. Furthermore, the study does not consider concordance between MRD results obtained from PB and BM,32,34 since we did not recruit matched pairs. The latter topic may be relevant together with outcome correlations, especially regarding the predictive value of persistence or resurgence of MRD, although this was not within the scope of our study.
In summary, our study shows that monitoring of MRD using gDNA-PCR is feasible in pediatric patients with AML harboring various recurrent chromosomal breakpoints. Given the advantages of a DNA-based methodology, we believe that the concept of MRD monitoring using patient-specific breakpoint sequences will be an attractive complementary methodology to the current gold-standard of FCM-based MRD detection. Our data also provide a rationale for additional studies in a larger, international setting addressing the prognostic significance of the methodologies as well as the superiority of one or the other method in well-defined AML subtypes.
Supplementary Material
Acknowledgments
We thank all patients and their parents or legal representatives as well as the clinical teams for providing samples and data. We thank Dieter Printz (FACS Core Unit, CCRI) for flow-cytometer maintenance and quality control, as well as Alice Bramböck, Susanne Suhendra, Claudia Mitteregger, Daniela Scharner, Barbora Baluskova (all Labdia Labordiagnostik GmbH) for excellent technical assistance. We acknowledge Michaela Winkel, Sigrid Wachholder and their team for cytomorphological assessment as part of the clinical diagnostics and routine management. We are grateful to Markus Kaymer and Michael Kapinsky (both from Beckman Coulter Inc.) for kindly providing customized DuraCloneTM tubes for this study as designed by the authors. Notably, Beckman Coulter Inc. did not have any influence on study design, data acquisition and interpretation, or manuscript writing.
Funding Statement
Funding: The study received funding from the Vienna Business Agency under grant agreement n. 2841342 (Project MyeFLOW to MMG).
References
- 1.Creutzig U, Zimmermann M, Lehrnbecher T, et al. Less toxicity by optimizing chemotherapy, but not by addition of granulocyte colony-stimulating factor in children and adolescents with acute myeloid leukemia: results of AML-BFM 98. J Clin Oncol. 2006;24(27):4499-4506. [DOI] [PubMed] [Google Scholar]
- 2.Gibson BE, Wheatley K, Hann IM, et al. Treatment strategy and long-term results in paediatric patients treated in consecutive UK AML trials. Leukemia. 2005;19(12):2130-2138. [DOI] [PubMed] [Google Scholar]
- 3.Lie SO, Abrahamsson J, Clausen N, et al. Long-term results in children with AML: NOPHO-AML Study Group--report of three consecutive trials. Leukemia. 2005;19(12):2090-2100. [DOI] [PubMed] [Google Scholar]
- 4.Creutzig U, Zimmermann M, Ritter J, et al. Treatment strategies and long-term results in paediatric patients treated in four consecutive AML-BFM trials. Leukemia. 2005;19(12):2030-2042. [DOI] [PubMed] [Google Scholar]
- 5.Dohner H, Weisdorf DJ, Bloomfield CD. Acute myeloid leukemia. N Engl J Med. 2015;373(12):1136-1152. [DOI] [PubMed] [Google Scholar]
- 6.Ossenkoppele GJ, Janssen JJ, van de Loosdrecht AA. Risk factors for relapse after allogeneic transplantation in acute myeloid leukemia. Haematologica. 2016;101(1):20-25. [DOI] [PMC free article] [PubMed] [Google Scholar]
- 7.Rollig C, Bornhauser M, Thiede C, et al. Long-term prognosis of acute myeloid leukemia according to the new genetic risk classification of the European LeukemiaNet recommendations: evaluation of the proposed reporting system. J Clin Oncol. 2011;29(20):2758-2765. [DOI] [PubMed] [Google Scholar]
- 8.De Kouchkovsky I, Abdul-Hay M. Acute myeloid leukemia: a comprehensive review and 2016 update. Blood Cancer J. 2016;6(7):e441. [DOI] [PMC free article] [PubMed] [Google Scholar]
- 9.Buldini B, Rizzati F, Masetti R, et al. Prognostic significance of flow-cytometry evaluation of minimal residual disease in children with acute myeloid leukaemia treated according to the AIEOP-AML 2002/01 study protocol. Br J Haematol. 2017;177(1):116-126. [DOI] [PubMed] [Google Scholar]
- 10.Grimwade D, Freeman SD. Defining minimal residual disease in acute myeloid leukemia: which platforms are ready for "prime time"? Blood. 2014;124(23):3345-3355. [DOI] [PubMed] [Google Scholar]
- 11.Tierens A, Bjorklund E, Siitonen S, et al. Residual disease detected by flow cytometry is an independent predictor of survival in childhood acute myeloid leukaemia; results of the NOPHO-AML 2004 study. Br J Haematol. 2016;174(4):600-609. [DOI] [PubMed] [Google Scholar]
- 12.van der Velden VH, van der Sluijs-Geling A, Gibson BE, et al. Clinical significance of flowcytometric minimal residual disease detection in pediatric acute myeloid leukemia patients treated according to the DCOG ANLL97/MRC AML12 protocol. Leukemia. 2010;24(9):1599-1606. [DOI] [PubMed] [Google Scholar]
- 13.Loken MR, Alonzo TA, Pardo L, et al. Residual disease detected by multidimensional flow cytometry signifies high relapse risk in patients with de novo acute myeloid leukemia: a report from Children's Oncology Group. Blood. 2012;120(8):1581-1588. [DOI] [PMC free article] [PubMed] [Google Scholar]
- 14.Buldini B, Maurer-Granofszky M, Varotto E, Dworzak MN. Flow-cytometric monitoring of minimal residual disease in pediatric patients with acute myeloid leukemia: recent advances and future strategies. Front Pediatr. 2019;7:412. [DOI] [PMC free article] [PubMed] [Google Scholar]
- 15.Brodersen LE, Gerbing RB, Pardo ML, et al. Morphologic remission status is limited compared to DeltaN flow cytometry: a Children's Oncology Group AAML0531 report. Blood Adv. 2020;4(20):5050-5061. [DOI] [PMC free article] [PubMed] [Google Scholar]
- 16.Dohner H, Estey E, Grimwade D, et al. Diagnosis and management of AML in adults: 2017 ELN recommendations from an international expert panel. Blood. 2017;129(4):424-447. [DOI] [PMC free article] [PubMed] [Google Scholar]
- 17.Schuurhuis GJ, Heuser M, Freeman S, et al. Minimal/measurable residual disease in AML: a consensus document from the European LeukemiaNet MRD Working Party. Blood. 2018;131(12):1275-1291. [DOI] [PMC free article] [PubMed] [Google Scholar]
- 18.Ravandi F, Walter RB, Freeman SD. Evaluating measurable residual disease in acute myeloid leukemia. Blood Adv. 2018;2(11):1356-1366. [DOI] [PMC free article] [PubMed] [Google Scholar]
- 19.Lukes J Jr, Winkowska L, Zwyrtkova M, et al. Identification of fusion gene breakpoints is feasible and facilitates accurate sensitive minimal residual disease monitoring on genomic level in patients with PML-RARA, CBFB-MYH11, and RUNX1-RUNX1T1. Hemasphere. 2020;4(6):e489. [DOI] [PMC free article] [PubMed] [Google Scholar]
- 20.Tsaur G, Ivanova A, Plekhanova O, et al. MRD monitoring in AML patients with MLL-MLLT4 by quantification of fusion gene transcripts and genomic chromosomal breakpoint sequences. Blood. 2008;112(11):4888. [Google Scholar]
- 21.Creutzig U, Zimmermann M, Bourquin JP, et al. Randomized trial comparing liposomal daunorubicin with idarubicin as induction for pediatric acute myeloid leukemia: results from study AML-BFM 2004. Blood. 2013;122(1):37-43. [DOI] [PubMed] [Google Scholar]
- 22.Waack K, Schneider M, Walter C, et al. Improved outcome in pediatric AML - the AML-BFM 2012 study. Blood. 2020;136(Suppl 1):12-14. [Google Scholar]
- 23.Kaspers GJ, Zimmermann M, Reinhardt D, et al. Improved outcome in pediatric relapsed acute myeloid leukemia: results of a randomized trial on liposomal daunorubicin by the International BFM Study Group. J Clin Oncol. 2013;31(5):599-607. [DOI] [PubMed] [Google Scholar]
- 24.van der Velden VH, Cazzaniga G, Schrauder A, et al. Analysis of minimal residual disease by Ig/TCR gene rearrangements: guidelines for interpretation of real-time quantitative PCR data. Leukemia. 2007;21(4):604-611. [DOI] [PubMed] [Google Scholar]
- 25.Meyer C, Marschalek R. LDI-PCR: identification of known and unknown gene fusions of the human MLL gene. Methods Mol Biol. 2009;538:71-83. [DOI] [PubMed] [Google Scholar]
- 26.Meyer C, Schneider B, Reichel M, et al. Diagnostic tool for the identification of MLL rearrangements including unknown partner genes. Proc Natl Acad Sci U S A. 2005;102(2):449-454. [DOI] [PMC free article] [PubMed] [Google Scholar]
- 27.Burmeister T, Marschalek R, Schneider B, et al. Monitoring minimal residual disease by quantification of genomic chromosomal breakpoint sequences in acute leukemias with MLL aberrations. Leukemia. 2006;20(3):451-457. [DOI] [PubMed] [Google Scholar]
- 28.Stutterheim J, van der Sluis IM, de Lorenzo P, et al. Clinical implications of minimal residual disease detection in infants with KMT2A-rearranged acute lymphoblastic leukemia treated on the Interfant-06 protocol. J Clin Oncol. 2021;39(6):652-662. [DOI] [PMC free article] [PubMed] [Google Scholar]
- 29.Jovanovic J, Potter N, Kanda A, et al. Molecular MRD monitoring is feasible in the majority of children with AML and is highly predictive of outcome: results from the international MyeChild01 study. Blood. 2019;134(Suppl_1):1393-1393. [Google Scholar]
- 30.Karlsson L, Nyvold CG, Soboli A, et al. Fusion transcript analysis reveals slower response kinetics than multiparameter flow cytometry in childhood acute myeloid leukaemia. Int J Lab Hematol. 2022;44(6):1094-1101. [DOI] [PMC free article] [PubMed] [Google Scholar]
- 31.Inaba H, Coustan-Smith E, Cao X, et al. Comparative analysis of different approaches to measure treatment response in acute myeloid leukemia. J Clin Oncol. 2012;30(29):3625-3632. [DOI] [PMC free article] [PubMed] [Google Scholar]
- 32.Juul-Dam KL, Ommen HB, Nyvold CG, et al. Measurable residual disease assessment by qPCR in peripheral blood is an informative tool for disease surveillance in childhood acute myeloid leukaemia. Br J Haematol. 2020;190(2):198-208. [DOI] [PubMed] [Google Scholar]
- 33.Loken MR, Alonzo TA, Pardo L, et al. Multidimensional flow cytometry significantly improves upon the morphologic assessment of post-induction marrow remission status – comparison of morphology and multidimensional flow cytometry; a report from the Children's Oncology Group AML protocol AAML0531. Blood. 2011;118(21):939. [Google Scholar]
- 34.Godwin CD, Zhou Y, Othus M, et al. Acute myeloid leukemia measurable residual disease detection by flow cytometry in peripheral blood vs bone marrow. Blood. 2021;137(4):569-572. [DOI] [PMC free article] [PubMed] [Google Scholar]
- 35.Dworzak MN, Gaipa G, Ratei R, et al. Standardization of flow cytometric minimal residual disease evaluation in acute lymphoblastic leukemia: Multicentric assessment is feasible. Cytometry B Clin Cytom. 2008;74(6):331-340. [DOI] [PubMed] [Google Scholar]
Associated Data
This section collects any data citations, data availability statements, or supplementary materials included in this article.


