

Abstract
Objectives
This study aimed to assess the internal law and time trend of hospitalisation for oesophagogastric variceal bleeding (EGVB) in cirrhosis and develop an effective model to predict the trend of hospitalisation time.
Design
We used a time series covering 72 months to analyse the hospitalisation for EGVB in cirrhosis. The number of inpatients in the first 60 months was used as the training set to establish the autoregressive integrated moving average (ARIMA) model, and the number over the next 12 months was used as the test set to predict and observe their fitting effect.
Setting and data
Case data of patients with EGVB between January 2014 and December 2019 were collected from the Affiliated Hospital of Southwest Medical University.
Outcome measures
The number of monthly hospitalised patients with EGVB in our hospital.
Results
A total of 877 patients were included in the analysis. The proportion of EGVB in patients with cirrhosis was 73% among men and 27% among women. The peak age at hospitalisation was 40–60 years. The incidence of EGVB varied seasonally with two peaks from January to February and October to November, while the lowest number was observed between April and August. Time-series analysis showed that the number of inpatients with EGVB in our hospital increased annually. The sequence after the first-order difference was a stationary series (augmented Dickey-Fuller test p=0.02). ARIMA (0,1,0) (0,1,1)12 with a minimum Akaike Information Criterion value of 260.18 could fit the time trend of EGVB inpatients and had a good short-term prediction effect. The root mean square error and mean absolute error were 2.4347 and 1.9017, respectively.
Conclusions
The number of hospitalised patients with EGVB at our hospital is increasing annually, with seasonal changes. The ARIMA model has a good prediction effect on the number of hospitalised patients with EGVB in cirrhosis.
Keywords: hepatobiliary disease, oesophageal disease, gastroduodenal disease, hospitalisation
STRENGTHS AND LIMITATIONS OF THIS STUDY.
The autoregressive integrated moving average (ARIMA) model used in this study, characterised by its simplicity and interpretability, demonstrates notable accuracy in short-term forecasting by thoroughly assimilating the long-range tendencies, cyclical shifts and aleatory perturbations in the data.
The ARIMA model has been applied in context of oesophagogastric variceal bleeding in individuals with cirrhosis for the first time.
We used 6 years of data, training the ARIMA model on the first 5 years and testing it on the last year.
The ARIMA model did not consider other factors except for the characteristics of time series that affect the number of inpatients and varied with the differences in personal experience of researchers.
To make the theoretical value closer to reality, the latest optimisation model should be fitted according to the regional differences and the latest EGVB data.
Introduction
Liver cirrhosis is a common global disease and its incidence continues to increase annually. Cirrhosis and its complications are responsible for a large number of deaths annually worldwide. The Global Burden of Disease study in 2017 reported over 1.32 million cirrhosis-related deaths globally, which is approximately 2.4% of all deaths worldwide.1 Almost 90% of patients with liver cirrhosis eventually develop portal hypertension.2 Oesophagogastric variceal bleeding (EGVB) caused by portal hypertension is the most common complication of cirrhosis and is one of the most common digestive system emergencies, with high risk and high mortality, requiring urgent hospital admission and long-term hospital stay.3 4 Although multiple procedures were available to control bleeding, the associated mortality currently accounted for approximately 10%–20%.5 EGVB in cirrhosis occurs easily and the disease burden associated with multiple hospitalisations correspondingly increases. Therefore, it is necessary to understand and predict the trend of hospitalisation in patients with EGVB due to cirrhosis.
Clinical prediction models have become increasingly popular in recent years. At present, prediction models and methods mainly include linear regression models, neural network models, Markov chain models and time-series models.6 7 Auto-regressive integrated moving average model (ARIMA) is a time-series forecasting approach that is used to predict the future value of a variable from its own past values and can achieve an acceptable prediction effect.8 However, no previous study has attempted to predict time trends for inpatients with EGVB.
In this study, we aimed to summarise the trend of hospitalisation in patients with EGVB in cirrhosis and establish an ARIMA model to predict future trends effectively by conducting a time-series analysis, providing a decision-making reference for hospitals to allocate medical resources. By taking into account the varying amounts of patients over different months, ages and genders, the hospital is expected to maximise the utilisation of medical resources and optimise the development of medical services. The effective treatment of patients with EGVB in cirrhosis is expected to be guaranteed.
Methods
Data sources
Clinical data were collected from 877 inpatients with EGVB in cirrhosis who were diagnosed at the Affiliated Hospital of Southwest Medical University between January 2014 (when the medical system at our hospital has been updated and the data were accurate) and December 2019. Data between 2014 and 2018 (60 months) were used as a training set to build the ARIMA models, whereas data between January 2019 and December 2019 (12 months) were used as a verification set to test the accuracy of the models.
Basic analysis of inpatients with EGVB
R software was used to import the number of hospitalised patients with EGVB in our hospital every month and generate a time-series graph and compare the sex ratio of hospitalised patients. The graph function of R was also used to generate a map of age distribution and a map showing seasonal distribution.
The ARIMA model
The ARIMA model is a classic model in time-series analyses that calculates future short-term predictions by analysing the time series of historical data. According to whether the data have periodicity, the ARIMA model can be divided into ARIMA (p, d, q) and ARIMA (p, d, q) (P, D, Q)S; D and d symbolize the sequence of trend and seasonal differences, established upon the stability of the original time series ; p, q, P, Q and s denote the sequence of the autoregressive, moving average, seasonal autoregressive, seasonal moving average and seasonal periodicity, respectively.9
The steps to build the ARIMA model are as follows:
Data preprocessing: R software was used to generate a time-series diagram for the number of EGVB inpatients in the first 60 months, and the seasonal and trend factors affecting the change in the number of EGVB inpatients were decomposed to conduct seasonal and trend analyses.
Stationarity test: the autocorrelation function (ACF) and partial autocorrelation function (PACF) graphs of the time series were constructed, and the augmented Dickey-Fuller (ADF) test was used to detect whether the time series was stationary. Otherwise, differential processing is needed to transform the time series into a stationary series.
Model identification: several alternative models were preliminarily estimated using the ACF and PACF diagrams. The auto.arima () function in the R software package can automatically identify the model order, and the optimal model is determined according to the Akaike Information Criterion (AIC), which is the minimum AIC value criterion.
Model test: the screening model was tested for residual white noise. If the residual order is listed as white noise, the ARIMA model can better fit the data; otherwise, the model parameters must be re-estimated and refitted.
Model prediction: the optimal model was used to forecast the trend for 2019 (12 months in total), calculate the root mean square error (RMSE) and mean absolute error (MAE) of the model and compare the predicted value with the actual value to evaluate the prediction effect of the model.
Statistical analysis
Microsoft Excel 2010 was used to build a database of EGVB inpatients, and R V.3.6.2 software was used for time-series analysis and ARIMA model establishment and prediction. P value <0.05 was considered statistically significant.
Patient and public involvement
Patients and/or the public were not involved in the design, or conduct, or reporting, or dissemination plans of this research.
Results
Baseline information
Between 2014 and 2019, the total number of EGVB inpatients in our hospital was 877, including 640 men and 237 women, accounting for 73% and 27% of the total study population, respectively. The age range of EGVB patients with cirrhosis was wide, and the highest incidence was observed in patients between 40 and 60 years of age, especially those aged 40–50 years (figure 1) (online supplemental table 1).
Figure 1.
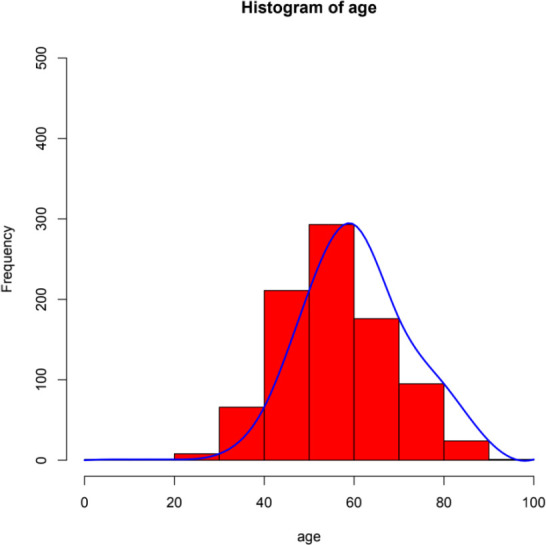
Age distribution of oesophagogastric variceal bleeding.
bmjopen-2023-074608supp002.pdf (40.1KB, pdf)
The distribution of admissions for EGVB in patients with cirrhosis adopted an obvious seasonal pattern, with two peaks of EGVB in patients with cirrhosis between January and February and October and November. In particular, January, February and November had the highest number of hospitalisations. The incidence of EGVB reached its lowest point between April and August, during which the ambient temperature gradually increased (figure 2).
Figure 2.

Seasonal distribution of patients with oesophagogastric variceal bleeding.
The ARIMA model
Basic characteristics of time-series data
R software was used to visualise the monthly incidence of inpatients in the first 60 months to generate a time-series table (figure 3). By observing the time-series diagram of the number of EGVB inpatients, it is shown that the incidence has a long-term growth trend, and the trend fluctuates sharply. It is considered that the original time series was a non-stationary series (figure 4A). Through the tail features depicted by the ACF and PACF charts, it can also be determined that the time series are non-stationary (figure 4B). We decomposed the time-sequence diagram for relevant factors and revealed the trend, periodicity and seasonality characteristics of the series (figure 5). The number of EGVB inpatients with cirrhosis at our hospital increased annually between 2014 and 2018. Under the influence of seasonal factors, the monthly incidence of EGVB inpatients with cirrhosis showed a regular upward-downward-upward trend, which was consistent with the description of the seasonal distribution map in the baseline information.
Figure 3.

Time series table of oesophagogastric variceal bleeding inpatients.
Figure 4.

Original timing diagram (A) and autocorrelation function (ACF) diagram and partial autocorrelation function (PACF) diagram (B).
Figure 5.

Timing diagram after factoring out related factors.
Stationarity tests
The adf.test () function was used to perform the ADF test, and the results showed that the p=0.45, which confirms that the original sequence diagram was not stable and needed to be stabilised. The diff () function was used to generate a first-order difference (online supplemental figure 1A). The ACF and PACF diagrams after the difference showed truncation characteristics (online supplemental figure 1B), which can be preliminarily judged to be a stationary series. The adf.test () function was used for the ADF test again (p=0.02 (p<0.05)), indicating that the sequence after the difference treatment was a stationary series, and d=1.
bmjopen-2023-074608supp001.pdf (157.3KB, pdf)
Model identification
The auto. arima () function was used to automatically select the optimal ARIMA model. Fifteen alternative models were preliminarily selected by combining the ACF and PACF diagrams of the differential sequences. ARIMA (0,1,0) (0,1,1)12 was selected as the best model based on the minimum principle of AIC. The minimum value of AIC was 260.18 (online supplemental table 2).
Model test
Ljung-Box test was conducted on the residual with the Box.test () function in R software. The residual of the model in this study did not pass the test, that is, there is no correlation between the residual and the autocorrelation coefficient, which was 0; thus, the residual sequence can be judged as white noise. The ACF diagram of the residuals demonstrated that the autocorrelation coefficients were within a twofold dotted line, thus indicating that the residuals were uncorrelated independent sequences. Therefore, the ARIMA model can fit the data well and can be used for prediction (online supplemental figure 2).
Model for prediction
ARIMA (0,1,0) (0,1,1)12 was used to forecast 2019 data (12 months). A diagram of the ARIMA model prediction results showed that the overall trend of the forecast series of the ARIMA model was consistent with that of the real series, although the fluctuations were not completely synchronised (online supplemental figure 3). Thus, the model fitted well, the RMSE of this model was 2.4347, and the MAE value was 1.9017.
Discussion
Liver cirrhosis is a common disease worldwide. EGVB is the most serious and critical complication of liver cirrhosis, accounting for 10%–30% of all cases of upper gastrointestinal bleeding.10 With the increasing incidence of liver cirrhosis, it has become a common emergency in the departments of emergency and gastroenterology. Clinical studies have shown that oesophageal varices occur in 30% of patients with cirrhosis, the risk of oesophageal and gastric fundus venous rupture is approximately 30%–50%, and 50% of patients experience repeated massive bleeding within 1–2 years, with a mortality rate of 40%–70%.11 12
In this study, the time-series analysis of the number of hospitalised patients with EGVB in our hospital showed that the number of cases increased annually. Liu et al reported that the longer the course of liver disease, the higher the recurrence rate and the complications, especially bleeding.13 Therefore, we speculate that this may be the reason for the increasing annual incidence of EGVB. Extensive coverage has been given to customised treatments and interventions aimed at averting the development of additional secondary combinations,14 diverse perdition models of EVGB15 16 and evolving treatment techniques.17 18 These enlighten us that developing a forecasting system for evaluating bleeding risk based on local data, enhancing the technology of intraregional endoscopic and interventional treatment and close follow-up are all significant breakthroughs in managing the escalating incidence rate of EGVB.
Among the 877 patients in this study, there were significantly more men than women with a male-to-female ratio of 2.55:1. When analysing age distribution, we found that most cases occurred in the 40–60 years age group, and the peak age of onset was 50–60 years. In a Norwegian study, the mean age of patients with bleeding was 54±11.84 years, with a male-to-female ratio of 2.63:1, generally consistent with the results of this study, which confirmed that women had less liver cirrhosis and less bleeding than men, suggesting that difference based on sex are related to EGVB.19 This may be because emotional stimulation, improper diet, overwork and alcohol consumption are independent risk factors of EGVB in cirrhosis,13 which are more common in men. Therefore, it was suggested that middle-aged men are more prone to EGVB, and it is necessary to conduct targeted education to attract the attention of this population.
Meteorological and climatic parameters have been associated with various human diseases. For instance, ambient air temperature has been shown to be inversely associated with the incidence of myocardial infarction.20 21 The seasonal variations in peptic ulcer bleeding were also found to be more frequent in winter than in summer.22 The ARIMA model developed in this study predicted that the admission of inpatients with EGVB would show a rise-decline-rise trend. It was evident that EGVB inpatients were mostly admitted to the hospital between January and February, followed by between October and November; thus, EGVB in liver cirrhosis also had seasonal variations, that is, the incidences of EGVB were higher in winter months than those in summer months. This was consistent with the seasonal distribution of inpatients with EGVB described in the basic information section. Yen et al reported that the incidence of bleeding from varix increased in February and decreased in July,23 which is similar to the results of this study. The reason for this phenomenon may be related to the contraction of skin and peripheral blood vessels caused by low temperature and the corresponding increase in visceral blood flow, resulting in increased varicose vein pressure. One study confirmed that ambient temperature affects variceal rupture haemorrhage, especially in the early morning. Thus, in addition to seasonal patterns, a circadian rhythm has also been observed in emergency admissions of EGVB. During this time, venous blood flow in the heart is at its highest point in patients with maximum portal venous pressure, thus increasing the risk for rupture haemorrhage. It has been shown that the risk for haemorrhage in patients is higher during the night than during the day, and mortality is higher during the day.13 In addition, Mansour et al reported that temperature changes could affect portal vein bleeding.24 In contrast, another study showed that EGVB occurs in all months and seasons, except September.25 The different results may be related to race, climate, eating habits and other factors related to the study population. Few reports have discussed bleeding from the varix, and seasonal variation in the incidence of variceal bleeding was not confirmed in these studies.26 27
The ARIMA prediction model used in this study is a common time-series analysis model that has long been used by researchers to predict medical clinical events. For example, the ARIMA model is widely used in the prediction of infectious diseases such as influenza28 and dengue fever29 and has shown high prediction accuracy. In addition, many studies have applied the ARIMA model and related machine learning algorithms to predict the daily or monthly number of new hospital admissions, and the results have high accuracy.30–32 Cheng et al 33 established a model to predict the emergency room occupancy rate in the next 4 hours by observing every hour of the day in the emergency department. In the early stage of the global outbreak of COVID-19 disease, some researchers established the ARIMA model to predict the number of daily cases in the later stage by collecting the number of confirmed cases over a period. The results showed that the dynamic trends of the predicted and actual values were essentially the same, which is of practical significance in guiding epidemic prevention and control.8 34 The ARIMA model is the most popular and classic time-series forecasting model owing to its relatively simple modelling process, good interpretability and high short-term prediction accuracy. It can solve the problem of autocorrelation of data and comprehensively consider the long-term trend, periodic change and random interference factors of data. This is the first time it has been used in patients with EGVB in cirrhosis. In addition, other models such as clinical-radiomics nomogram16 35 and machine learning-based model15 have been used to predict the risk of EGVB in patients with liver cirrhosis in previous studies. However, the majority of them aimed at the prediction of bleeding risk in patients to prevent the occurrence of EGVB and promote EGVB surveillance strategies. Our study tended to provide better medical services for bleeding patients by allocating resources based on trends of hospitalisation.
However, this model also has inherent shortcomings; for example, it requires high time continuity of data and only considers the characteristics of time series to predict, without considering other factors affecting the number of inpatients. Therefore, it should be combined with the actual situation for comprehensive analysis in practical applications. In addition, there are subjective components of model identification. Owing to differences in personal experience, different researchers may obtain different relative optimal models when modelling the same set of data, which will also lead to bias and affect the accuracy of model prediction. Moreover, because EGVB in different regions has its onset characteristics, the latest and optimal model should be fitted according to the regional differences and the latest data of EGVB to make the theoretical value closer to reality. Finally, we hope to continue learning more advanced models to achieve more accurate predictions in medical research.
Conclusion
Through a time-series analysis of the number of hospitalised patients with EGVB in cirrhosis at our hospital, this study found that the long-term trend of onset time, high incidence season and month, other laws and the established ARIMA model have good short-term prediction effects on the number of hospitalised patients, which can provide a reference for hospitals to formulate appropriate medical preparation and prevention strategies.
Supplementary Material
Footnotes
Contributors: Study conception and design: XT, JP, XZe. Drafting of manuscript: JP, XZe, SH, HZ. Acquisition of data and critical revision: HX, KZ, WZ, XS, LS, XZh, ML. Revision of manuscript and final approval of manuscript: XT, YP. XT accepts full responsibility for the finished work and/or the conduct of the study, had access to the data, and controlled the decision to publish.
Funding: The authors have not declared a specific grant for this research from any funding agency in the public, commercial or not-for-profit sectors.
Competing interests: None declared.
Patient and public involvement: Patients and/or the public were not involved in the design, or conduct, or reporting, or dissemination plans of this research.
Provenance and peer review: Not commissioned; externally peer reviewed.
Supplemental material: This content has been supplied by the author(s). It has not been vetted by BMJ Publishing Group Limited (BMJ) and may not have been peer-reviewed. Any opinions or recommendations discussed are solely those of the author(s) and are not endorsed by BMJ. BMJ disclaims all liability and responsibility arising from any reliance placed on the content. Where the content includes any translated material, BMJ does not warrant the accuracy and reliability of the translations (including but not limited to local regulations, clinical guidelines, terminology, drug names and drug dosages), and is not responsible for any error and/or omissions arising from translation and adaptation or otherwise.
Data availability statement
Data may be obtained from a third party and are not publicly available.
Ethics statements
Patient consent for publication
Not applicable.
Ethics approval
The Institutional Review Board of the Affiliated Hospital of Southwest Medical University considered ethical review is not required for the current study (AHSWMU-HR20230403). Participants gave informed consent to participate in the study before taking part.
References
- 1. GBD 2017 Cirrhosis Collaborators . The global, regional, and national burden of cirrhosis by cause in 195 countries and territories, 1990-2017: a systematic analysis for the Global Burden of Disease Study 2017. Lancet Gastroenterol Hepatol 2020;5:245–66. [DOI] [PMC free article] [PubMed] [Google Scholar]
- 2. Gunarathne LS, Rajapaksha H, Shackel N, et al. Cirrhotic portal hypertension: From pathophysiology to novel therapeutics. World J Gastroenterol 2020;26:6111–40. [DOI] [PMC free article] [PubMed] [Google Scholar]
- 3. Koya Y, Shibata M, Watanabe T, et al. Influence of gastroesophageal flap valve on esophageal variceal bleeding in patients with liver cirrhosis. Dig Endosc 2021;33:100–9. [DOI] [PubMed] [Google Scholar]
- 4. Xu B, Liu J, Liu S, et al. Clinical effect of single covered stent and double covered stent on TIPS in the treatment of hemorrhage due to rupture of esophageal and gastric varices in cirrhosis and its influence on immune function. Exp Ther Med 2019;18:4259–64. [DOI] [PMC free article] [PubMed] [Google Scholar]
- 5. Chen Y, Li X. New model predicting gastroesophageal varices and variceal hemorrhage in patients with chronic liver disease. Ann Hepatol 2021;21:100275. [DOI] [PubMed] [Google Scholar]
- 6. Collins GS, Moons KGM. Reporting of artificial intelligence prediction models. Lancet 2019;393:1577–9. [DOI] [PubMed] [Google Scholar]
- 7. Chen L. Overview of clinical prediction models. Ann Transl Med 2020;8:71. [DOI] [PMC free article] [PubMed] [Google Scholar]
- 8. Alabdulrazzaq H, Alenezi MN, Rawajfih Y, et al. On the accuracy of ARIMA based prediction of COVID-19 spread. Results Phys 2021;27:104509. [DOI] [PMC free article] [PubMed] [Google Scholar]
- 9. Zhai M, Li W, Tie P, et al. Research on the predictive effect of a combined model of ARIMA and neural networks on human brucellosis in Shanxi Province, China: a time series predictive analysis. BMC Infect Dis 2021;21:280. [DOI] [PMC free article] [PubMed] [Google Scholar]
- 10. Garbuzenko DV, Arefyev NO. Primary prevention of bleeding from esophageal varices in patients with liver cirrhosis: An update and review of the literature. J Evid Based Med 2020;13:313–24. [DOI] [PubMed] [Google Scholar]
- 11. Binmoeller KF. Endoscopic Ultrasound-Guided Coil and Glue Injection for Gastric Variceal Bleeding. Gastroenterol Hepatol (N Y) 2018;14:123–6. [PMC free article] [PubMed] [Google Scholar]
- 12. Rodrigues SG, Cárdenas A, Escorsell À, et al. Balloon Tamponade and Esophageal Stenting for Esophageal Variceal Bleeding in Cirrhosis: A Systematic Review and Meta-analysis. Semin Liver Dis 2019;39:178–94. [DOI] [PubMed] [Google Scholar]
- 13. Liu R, Sun Y, Xu K, et al. A Histogram Model to Predict the Risk of Bleeding from Oesophageal and Gastric Variceal Rupture in Cirrhosis. J Coll Physicians Surg Pak 2022;32:586–90. [DOI] [PubMed] [Google Scholar]
- 14. Duan X, He X, Yan H, et al. Analysis of Complications and Risk Factors Other than Bleeding before and after Endoscopic Treatment of Esophagogastric Variceal Bleeding in Patients with Liver Cirrhosis. Can J Gastroenterol Hepatol 2023;2023:7556408. [DOI] [PMC free article] [PubMed] [Google Scholar]
- 15. Hou Y, Yu H, Zhang Q, et al. Machine learning-based model for predicting the esophagogastric variceal bleeding risk in liver cirrhosis patients. Diagn Pathol 2023;18:29. [DOI] [PMC free article] [PubMed] [Google Scholar]
- 16. Luo R, Gao J, Gan W, et al. Clinical-radiomics nomogram for predicting esophagogastric variceal bleeding risk noninvasively in patients with cirrhosis. World J Gastroenterol 2023;29:1076–89. [DOI] [PMC free article] [PubMed] [Google Scholar]
- 17. Huang J, Lei XF, Xu D, et al. Laparoscopic splenectomy and azygoportal disconnection to treat liver cirrhosis with hypersplenism and esophagogastric variceal bleeding: A video vignette. Asian Journal of Surgery 2023;46:3122–3. [DOI] [PubMed] [Google Scholar]
- 18. Whitford RC, Liebman J, Baez J. Bougie-Facilitated Tamponade Balloon Placement for Massive Esophagogastric Variceal Hemorrhage: A Case Series and Novel Procedural Technique Description. J Emerg Med 2023;64:338–44. [DOI] [PubMed] [Google Scholar]
- 19. Haukeland JW, Småstuen MC, Pålsdatter PP, et al. Effect of gender on mortality and causes of death in cirrhotic patients with gastroesophageal varices. A retrospective study in Norway. PLoS One 2020;15:e0230263. [DOI] [PMC free article] [PubMed] [Google Scholar]
- 20. Wolf K, Schneider A, Breitner S, et al. Air temperature and the occurrence of myocardial infarction in Augsburg, Germany. Circulation 2009;120:735–42. [DOI] [PubMed] [Google Scholar]
- 21. Zhang F, Liu Z, Gao L, et al. Short-term impacts of floods on enteric infectious disease in Qingdao, China, 2005-2011. Epidemiol Infect 2016;144:3278–87. [DOI] [PMC free article] [PubMed] [Google Scholar]
- 22. Guo CG, Tian L, Zhang F, et al. Associations of seasonal variations and meteorological parameters with incidences of upper and lower gastrointestinal bleeding. J Gastroenterol Hepatol 2021;36:3354–62. [DOI] [PubMed] [Google Scholar]
- 23. Yen FS, Wu JC, Wang LM, et al. Seasonal variation in the incidence of peptic ulcer and esophageal variceal bleeding in Taiwan. Zhonghua Yi Xue Za Zhi (Taipei) 1996;57:22–7. [PubMed] [Google Scholar]
- 24. Mansour L, El-Kalla F, El-Bassat H, et al. Randomized controlled trial of scleroligation versus band ligation alone for eradication of gastroesophageal varices. Gastrointest Endosc 2017;86:307–15. [DOI] [PubMed] [Google Scholar]
- 25. Sezgin O, Altintaş E, Tombak A. Effects of seasonal variations on acute upper gastrointestinal bleeding and its etiology. Turk J Gastroenterol 2007;18:172–6. [PubMed] [Google Scholar]
- 26. No authors listed . Seasonal incidence of upper gastrointestinal tract bleeding. Report of the Standing Committee on Upper Gastrointestinal Bleeding, William Beaumont Society, US Army. Jama 1966;198:184–5. [PubMed] [Google Scholar]
- 27. Nomura T, Ohkusa T, Araki A, et al. Influence of climatic factors in the incidence of upper gastrointestinal bleeding. J Gastroenterol Hepatol 2001;16:619–23. [DOI] [PubMed] [Google Scholar]
- 28. Song X, Xiao J, Deng J, et al. Time series analysis of influenza incidence in Chinese provinces from 2004 to 2011. Medicine (Baltimore) 2016;95:e3929. [DOI] [PMC free article] [PubMed] [Google Scholar]
- 29. Polwiang S. The time series seasonal patterns of dengue fever and associated weather variables in Bangkok (2003-2017). BMC Infect Dis 2020;20:208. [DOI] [PMC free article] [PubMed] [Google Scholar]
- 30. Zhu T, Luo L, Zhang X, et al. Time-series Approaches for Forecasting the Number of Hospital Daily Discharged Inpatients. IEEE J Biomed Health Inform 2017;21:515–26. [DOI] [PubMed] [Google Scholar]
- 31. Zhou L, Zhao P, Wu D, et al. Time series model for forecasting the number of new admission inpatients. BMC Med Inform Decis Mak 2018;18:39. [DOI] [PMC free article] [PubMed] [Google Scholar]
- 32. Tello M, Reich ES, Puckey J, et al. Machine learning based forecast for the prediction of inpatient bed demand. BMC Med Inform Decis Mak 2022;22:55. [DOI] [PMC free article] [PubMed] [Google Scholar]
- 33. Cheng Q, Argon NT, Evans CS, et al. Forecasting emergency department hourly occupancy using time series analysis. Am J Emerg Med 2021;48:177–82. [DOI] [PubMed] [Google Scholar]
- 34. Fang L, Wang D, Pan G. Analysis and Estimation of COVID-19 Spreading in Russia Based on ARIMA Model. SN Compr Clin Med 2020;2:2521–7. [DOI] [PMC free article] [PubMed] [Google Scholar]
- 35. Liu CH, Liu S, Zhao YB, et al. Development and validation of a nomogram for esophagogastric variceal bleeding in liver cirrhosis: A cohort study in 1099 cases. J Dig Dis 2022;23:597–609. [DOI] [PubMed] [Google Scholar]
Associated Data
This section collects any data citations, data availability statements, or supplementary materials included in this article.
Supplementary Materials
bmjopen-2023-074608supp002.pdf (40.1KB, pdf)
bmjopen-2023-074608supp001.pdf (157.3KB, pdf)
Data Availability Statement
Data may be obtained from a third party and are not publicly available.