

Abstract
Background:
Triple-negative breast cancer (TNBC) is an aggressive disease with limited treatment options. Eribulin, a chemotherapeutic drug, induces epigenetic changes in cancer cells, suggesting a unique mechanism of action.
Materials & methods:
MDA-MB 231 cells were treated with eribulin and paclitaxel, and the samples from 53 patients treated with neoadjuvant eribulin were compared with those from 14 patients who received the standard-of-care treatment using immunohistochemistry.
Results:
Eribulin treatment caused significant DNA methylation changes in drug-tolerant persister TNBC cells, and it also elicited changes in the expression levels of epigenetic modifiers (DNMT1, TET1, DNMT3A/B) in vitro and in primary TNBC tumors.
Conclusion:
These findings provide new insights into eribulin’s mechanism of action and potential biomarkers for predicting TNBC treatment response.
Keywords: breast cancer, chemotherapy, DNA methylation, epigenetic, epithelial-to-mesenchymal transition
Triple-negative breast cancer (TNBC) is characterized by the absence of expression of estrogen receptor, progesterone receptor and HER2. TNBC accounts for approximately 15% of all breast cancer cases and is associated with poorer prognosis compared with other subtypes due to its aggressive nature and limited repertoire of targeted therapeutics [1,2]. The current standard of care for most TNBC cases includes a combination of conventional chemotherapy, radiation therapy, immunotherapy and surgery [3,4].
In eukaryotes, DNA methylation is an epigenetic mark known for its functions in regulating transcription and occurs on cytosine residues that are linked to a guanine base (CpGs). DNA methylation is controlled mainly by two enzyme families: DNA methyltransferases (DNMTs: DNMT1, DNMT3A, DNMT3B) and 10–11 translocation (TET) methylcytosine dioxygenases (TET1, TET2, TET3). DMNTs add methyl groups to cytosine residues, and TET enzymes oxidize methyl groups as a part of an active demethylation pathway [5]. The dysregulation of these enzymes has been implicated in the development and progression of cancers. Altered DNA methylation patterns contribute to oncogene activation and the silencing of tumor suppressors, driving the aggressive behavior of TNBC [6,7]. In breast and ovarian cancers, the tumor suppressor gene BRCA1 is often silenced due to hypermethylation [8,9]. Overexpression of DNMT1 and DNMT3B has been observed in TNBC, leading to DNA hypermethylation and silencing of tumor suppressors, whereas the level of TET1 is often downregulated in TNBC [10–12]. Moreover, DNA methylation patterns may serve as biomarkers for early detection, prognosis and treatment response [9]. Therapeutic targeting of such altered enzymes may restore precancer DNA methylation patterns and improve TNBC outcomes. Indeed, DNMT inhibitors such as azacytidine, decitabine, clofarabine and arsenic trioxide are currently approved for the treatment of patients with hematological malignancies [13,14]. Decitabine has been suggested to enhance preclinical outcomes by increasing the sensitivity of pancreatic cancer cells to sorafenib [13]. Additionally, combined treatment with decitabine and navitoclax substantially reduced tumor volume in a xenograft model of KRAS-mutant ovarian cancer more than either single agent [13,15]. Therefore, co-targeting epigenetic modifiers may improve outcomes for patients with TNBC.
Eribulin is a chemotherapeutic microtubule dynamics inhibitor approved by the US FDA for the treatment of metastatic breast cancer [16]. The clinical evaluation demonstrated eribulin increases overall survival compared with conventional chemotherapy (14.4 vs 9.4 months) in patients with metastatic TNBC [17]. Preclinical work showed eribulin induces a mesenchymal-to-epithelial transition (MET), and treatment of cancer cells with eribulin leads to the formation of epithelial-like drug-tolerant persisters compared with both parental cells and cells pretreated with paclitaxel [18]. Epithelial-to-mesenchymal transition (EMT) and its reverse process, MET, are recognized as crucial events in cancer progression and metastasis. EMT enables cancer cells to acquire invasive and migratory properties, facilitating their escape from a tumor site and dissemination to distant organs. Conversely, MET allows disseminated cancer cells to undergo a phenotypic transition, enabling them to establish secondary tumor colonies in new microenvironments. The dynamic interplay between EMT and MET contributes to tumor heterogeneity, plasticity, treatment resistance and poor patient outcomes [19,20]. We previously described significant changes in transcriptional programs upon eribulin selection in TNBC cells [18]. This led us to hypothesize that such changes resulted from modifications to the chromatin state. Specifically, we found a reduction in levels of the histone 3 lysine 4 trimethylation (H3K4me3) activation mark and the H3K27me3 repressive mark in TNBC cells that persisted despite eribulin treatment, while paclitaxel-enduring cells showed no such alterations. Considering the association between, first, alterations in transcriptional programs and DNA methylation patterns and second, EMT [18,21], we posited that the antitumor effects of eribulin in TNBC may be attributed to its capacity to modulate DNA methylation and consequently the expression of cancer-associated genes.
Materials & methods
Cell lines & culture conditions
The MMTV-PyMT-derived PB3 cell line was a gift from B Weinberg (Whitehead Institute for Biomedical Research, MA, USA). PB3 cells were cultured in Dulbecco’s modified Eagle medium/F12 medium supplemented with 5% adult bovine serum (ABS; ThermoFisher Scientific, MA, USA), l-glutamine, and non-essential amino acids (NEAA; Gibco™, MA, USA). Human breast cancer cell lines, MDA-MB-231 (RRID: CVCL_0062), were sourced from American Type Culture Collection (VA, USA). They were cultured in Dulbecco’s modified Eagle medium enriched with 10% fetal bovine serum, 1 IU/ml penicillin and 50 μg/ml streptomycin, and maintained in an environment with 5% CO2 at 37°C. The cells were treated with Plasmocin® to eliminate and treat mycoplasma (InvivoGen™, CA, USA) as per the manufacturer’s instructions. These cell lines underwent authentication through short tandem repeats (STRs) analysis and functional assays (tumor formation capability). Additionally, they were periodically checked to ensure they were mycoplasma-free.
Drug treatment
Stock solutions for eribulin were prepared in water, and paclitaxel was prepared in dimethyl sulfoxide. The half-maximal inhibitory concentration (IC50) was determined using a range of 0.5–100 nM drugs in MDA-MB-231 cells. To generate drug-tolerant persister cancer cells, the cells were treated first with 25 nM of the drug followed by 50 nM.
Cytokine profiling
To assess cytokine levels, equivalent numbers of cells from parental, PAC2 and ERI2 clones were cultured for 24 h. The collected supernatant was centrifuged to remove debris and then analyzed using the Human 48-Plex Cytokine Assay Kit (MilliporeSigma, HCYTA-60K-PX48, MA, USA) following the manufacturer’s instructions. After incubation with supernatant or fresh medium (negative control), the magnetic bead plate underwent washing to remove unbound material. Detection antibodies and streptavidin–phycoerythrin were used for visualization and quantification. The Luminex® 200 (ThermoFisher Scientific) multiplex assay platform measured fluorescence intensity that reflected relative cytokine levels.
CUT&RUN sequencing
CUT&RUN (‘cleavage under targets and release using nuclease’) sequencing was performed using the CUTANA™ Kit (EpiCypher 14–1048, NC, USA) with minor modifications. Briefly, 5 × 10⁵ cells were washed and bound to concanavalin A-coated magnetic beads. Cells were permeabilized with wash buffer (20 mM HEPES pH 7.5, 150 mM NaCl, 0.5 mM spermidine and 1× Roche (Basel, Switzerland) complete protease inhibitor, ethylenediaminetetraacetic acid [EDTA]-free) containing 0.025% digitonin (digitonin buffer) and 2 mM EDTA, and incubated with primary antibody (Bethyl Laboratories, TX, USA, anti-ZEB1- A301-922A, 1:100 or IgG isotype control) overnight at 4°C. The cell–bead slurry was washed twice with digitonin buffer and incubated with 1× Protein-A/G-MNase (pAG-MNase) in digitonin buffer for 10 min at room temperature. The slurry was washed twice with digitonin buffer and incubated in digitonin buffer containing 2 mM CaCl2 for 2 h at 4°C to activate pAG-MNase digestion. Digestion was stopped by addition of 2× stop buffer (340 mM NaCl, 20 mM EDTA, 4 mM ethylene glycol-bis(β-aminoethyl ether)-N,N,N′,N′-tetraacetic acid, 50 μg/ml RNase A, 50 μg/ml glycogen), and samples were incubated for 10 min at 37°C to release chromatin to the supernatant and degrade RNA. The supernatant was recovered, and DNA was isolated using MinElute Reaction Cleanup Kit (Qiagen, MD , USA, 28206). Isolated CUT&RUN DNA fragments were quantified by Qubit™ (ThermoFisher Scientific), and 5–10 ng was used for library preparation with the New England Biolabs (MA, USA) Ultra II DNA Kit. Library amplification was performed using the modified PCR cycling conditions described in Step 39 of the CUTANA Kit protocol (EpiCypher 14–1048) [18]. Barcoded libraries were pooled for sequencing on a NextSeq500 Mid Output flow cell (Illumina, Inc., CA, USA) to generate 10 million 50-bp paired-end reads per sample that were analyzed as described previously [18].
Immunoblotting
Protein extraction was performed by pelleting cells and resuspending in cold radioimmunoprecipitation assay buffer (Thermo Fisher Scientific) supplemented with phosphatase/protease inhibitors (Thermo Fisher Scientific) and incubating for 1 h on ice. Protein extracts were collected by centrifugation at 20,000 × g for 10 min at 4°C. Protein concentrations in the supernatant were quantified using Quick Start Bradford Protein Assay kit (Bio-Rad, CA, USA, 5000202). Protein was diluted with NuPAGE™ LDS sample buffer (Thermo Fisher Scientific) and NuPAGE Sample Reducing Agent (Life Technologies NP0009). Samples were heated at 72°C for 15 min before resolving on 4–12% Bis-Tris gradient gels. Gels were either wet- or semi-dry-transferred using Mini Blot module or iBlot 2 Gel Transfer Device (Thermo Fisher Scientific) respectively. The membranes were blocked using a blocking buffer composed of 2.5% milk and 2.5% bovine serum albumin in Tris-buffered saline with 0.1% Tween 20. Primary antibodies (DNMT1, 5032 [1:1000]; DNMT3A, 3598 [1:1000]; tubulin, 2148 [1:2000] from Cell Signaling Technology (MA, USA); and TET1, 124207 [1:1000] from GeneTex (CA, USA) were incubated overnight with membranes in Tris-buffered saline (TBS) blocking buffer supplemented with 0.1% Tween® 20 (Sigma-Aldrich, MO, USA, P1379), while secondary antibodies (horseradish peroxidase-conjugated) were incubated at room temperature with agitation for 1 h in primary blocking buffer. Membranes were developed using SuperSignal™ western blot substrate (Thermo Fisher Scientific).
Human tissue specimens
Human formalin-fixed, paraffin-embedded TNBC tissue specimens were obtained from two sources: the SOLTI-1007-NeoEribulin study [22] and Dartmouth-Hitchcock Medical Center pathology archives. SOLTI-1007-NeoEribulin was done in accordance with good clinical practice guidelines and the Declaration of Helsinki. The study protocol was approved by independent ethics committees at each center and the Agencia Española de Medicamentos y Productos Sanitarios. All patients provided written informed consent. Specimens from Dartmouth-Hitchcock Medical Center were obtained through clinically indicated procedures for diagnostic purposes. Use of these specimens for this research was approved by the Dartmouth Health Human Research Protection Program (STUDY02000731).
Immunohistochemistry
Tissue sections were deparaffinized in xylene for 10 min and rehydrated in a series of graded ethanol solutions (100, 95, 80 and 70%) to water. Antigen retrieval was performed by heating tissue sections in citrate buffer (pH 6.0) at 95–100°C for 20 min. Endogenous peroxidase activity was blocked by incubating sections in 3% hydrogen peroxide for 10 min, followed by blocking of nonspecific binding sites using blocking buffer (2.5% horse serum and 2.5% bovine serum albumin in phosphate-buffered saline [PBS]) for 30 min at room temperature. Primary antibodies (Cell Signaling Technology: DNMT1, 5032 [1:500] and DNMT3A, 3598 [1:500]; GeneTex: TET1 124207 [1:1000]) diluted in antibody dilution buffer were applied to sections and incubated at 4°C overnight. Sections were then washed with PBS three times for 5 min each, and biotinylated secondary antibody diluted in blocking buffer was applied for 1 h at room temperature. Sections were washed with PBS three times for 5 min each and incubated with avidin–biotin–peroxidase complex (ABC kit, Vector Laboratories, CA, USA, PK-8800) for 30 min at room temperature. The signal was developed by incubating sections with 3,3′-diaminobenzidine for 5 min, followed by counterstaining with hematoxylin for 2 min. Sections were dehydrated in a series of graded ethanol solutions (70, 80, 95 and 100%) for 30 sec each, cleared in xylene for 5 min, then mounted. Microscopic images of stained tissue sections were captured for analysis. Staining patterns and intensities were analyzed, and staining was quantified by measuring optical density using a pathologist expert from Dartmouth Cancer Center. The overall percentage change was calculated using the formula:
DNA methylation data collection & preprocessing
DNA extracted from cells in duplicate or triplicate was converted with bisulfite treatment and hybridized to an Illumina Human MethylationEPIC array [23]. Raw data files from the methylation array were preprocessed with the SeSAMe Bioconductor pipeline for normalization and β-value calculation [24]. Quality control was performed using the ENmix R package [25]. Low-quality probes, SNP-associated probes and cross-reactive probes were removed, leaving 690,483 CpGs for downstream analyses [24].
Statistical analysis
The methylation dysregulation index (MDI), a cumulative departure of methylation levels in comparison to untreated cells, was calculated according to the method of O’Sullivan et al. [26] as follows:
The MDIs of each treatment group were compared by a two-sided Wilcoxon test.
Methylation β-values were logit2 transformed to M-values for a more normal distribution of the methylation dataset with the logit2 function in the minfi R package. Epigenome-wide association studies to identify differentially methylated CpGs associated with the different treatment groups were identified by fitting M-values into linear regression models. Linear regression models were fitted by using the lmFit and eBayes functions in the limma R package [27]. The p-values were adjusted for multiple comparisons to q-values using the q-value R package (https://github.com/StoreyLab/qvalue). Differentially methylated CpGs were determined to be significant under the q-value threshold of 0.05.
Enrichment at genomic contexts for CpGs was compared with the 690,483 CpGs using Fisher’s exact tests. Annotations of CpGs for genomic context were provided in the IlluminaHumanMethylationEPICanno.ilm10b5.hg38 R package [23]. From the Illumina-provided CpG annotation file, promoter regions were defined as within either 200 or 1500 bp of a transcription start site. Enhancers within the Illumina methylation array annotation files were based on annotation from FANTOM5 enhancer regions. The Genomic Regions Enrichment of Annotations Tool was used to assess the functional significance of the differentially methylated CpGs [28]. The enrichKEGG function in the clusterProfiler R package was used to determine pathways associated with genes that had associated differentially methylated CpGs [29,30]. Over-representations of transcription factor binding site motifs with differentially methylated CpGs within ZEB1 binding sites were tested against all ZEB1 binding sites determined from ZEB1 CUT&RUN experiments using hypergeometric testing with the phyper R function [21]. Transcription factor binding site motifs curated in the JASPAR database, downloaded with JASPAR2022 and TFBStools R packages, were used for analyses [31,32]. Transcription factor motifs with the false discovery rate adjusted p ≤ 0.05 were considered over-represented.
Results
Eribulin treatment alters DNA methylation patterns in TNBC cells
MDA-MB 231 TNBC cells were treated with two rounds of eribulin to generate drug-tolerant persister cancer cells. As comparators, we also analyzed cells treated with two rounds of the microtubule inhibitor paclitaxel or parental controls (Figure 1A). Treatment with eribulin at its IC50 resulted in the emergence of an eribulin-resistant cell population with a cobblestone-like morphology compared with parental and paclitaxel-resistant derivatives (Figure 1B). We then measured epigenome-wide DNA methylation patterns at each time point. Principal component analysis showed that the DNA methylation profiles of eribulin-treated cells were distinct from those of parental and paclitaxel-treated cells (Figure 1C & Supplementary Figure 1A). Supporting the principal component analysis results, unsupervised hierarchical clustering of the top 5% most variable CpGs (34,525 CpGs) revealed that the DNA methylation profiles of eribulin-treated cells were distinct from those of paclitaxel-treated and parental cells (Figure 1D). To quantify the cumulative burden of drug treatments on DNA methylation, we calculated the MDI, a summary measure of cumulative departure of DNA methylation levels compared with parental cells. The MDI of eribulin-treated cells was significantly (two-sided Wilcoxon test, p = 0.03) higher than that of paclitaxel-treated cells, and the MDI increased with the second round of eribulin treatment compared with the first round (Figure 1E).
Figure 1. . Eribulin treatment alters DNA methylation patterns in triple-negative breast cancer cells.
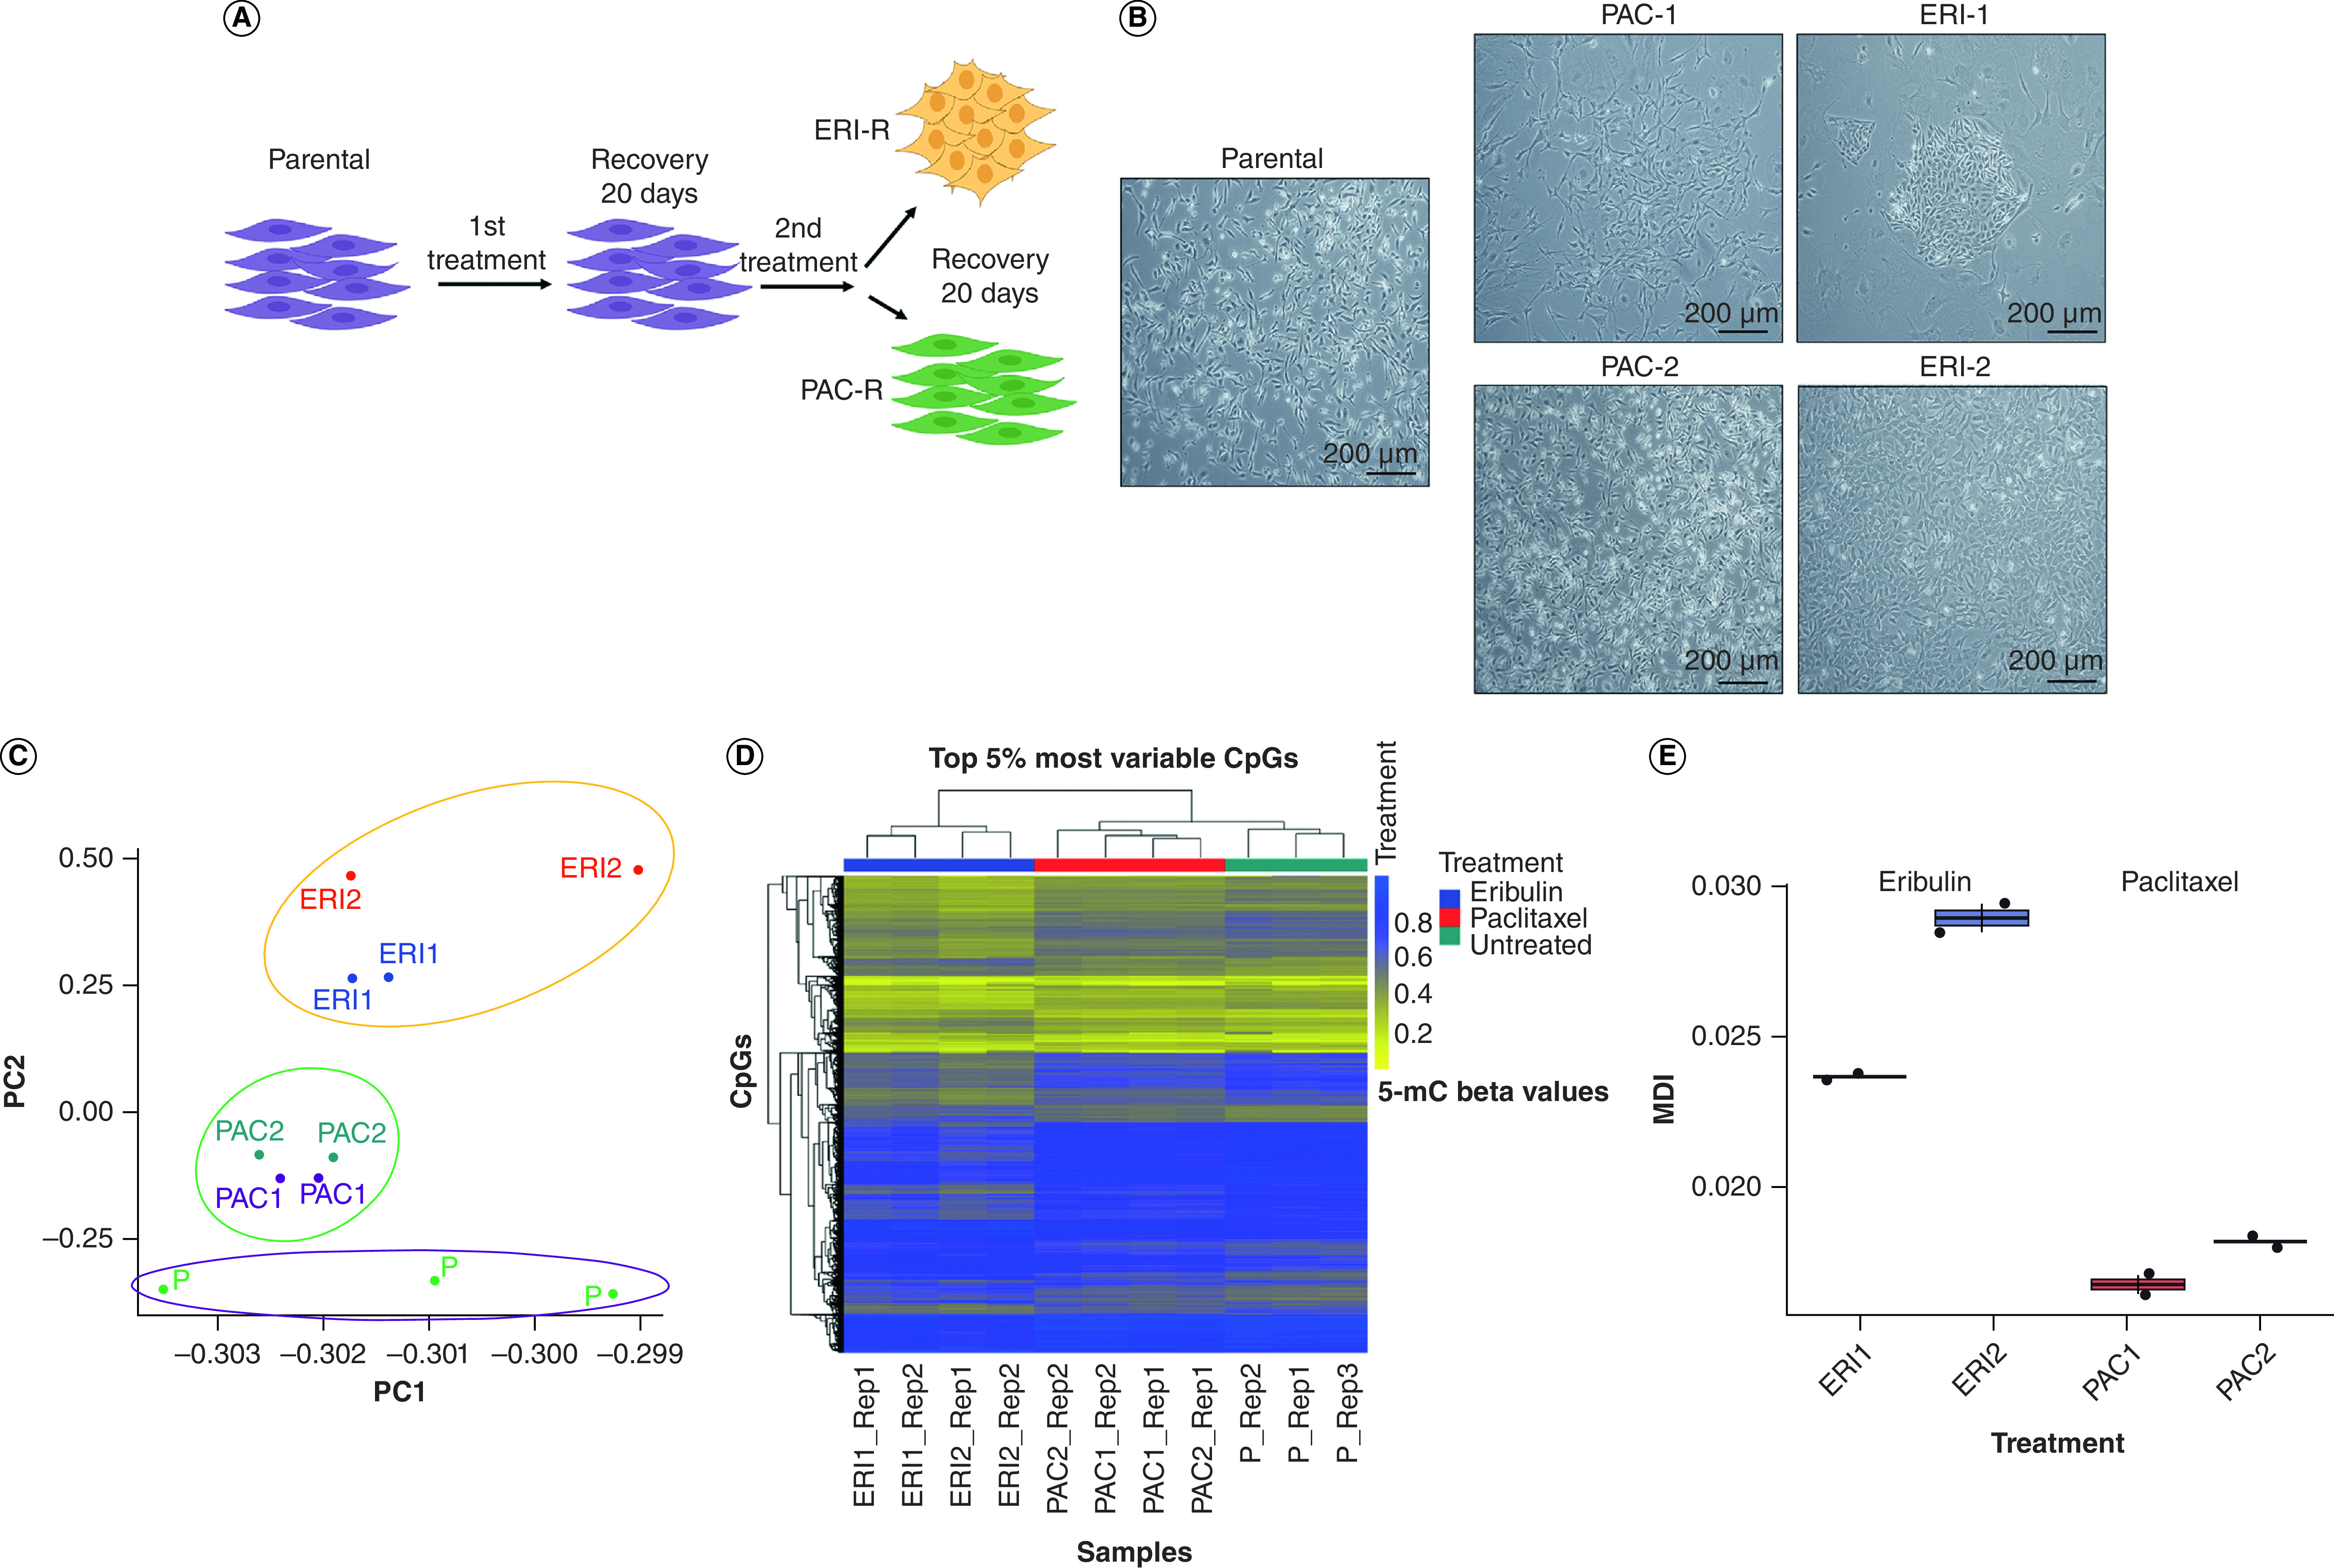
(A & B) Schematic and brightfield representation of multi-round drug treatment procedure that resulted in the generation of resistant clones. (C) Principal component analysis of the most variable genes between MDA MB-231 parental, ERI1, ERI2, PAC1 and PAC2 from DNA methylation array. (D) Heat map of unsupervised hierarchical clustering of methylation β-values of the top 5% most variable CpGs (34,525 CpGs). Horizontal tracking bars indicate the treatment status. (E) Methylation dysregulation index of eribulin-treated and paclitaxel-treated cells at each treatment point.
ERI: Eribulin; MDI: Methylation dysregulation index; PAC: Paclitaxel.
To determine which differentially methylated CpGs (dmCpGs) were associated with eribulin and paclitaxel treatments compared with controls, we conducted epigenome-wide association tests. After the first round of eribulin, 47,758 dmCpGs were detected (26,383 hypomethylated; 21,375 hypermethylated) (Figure 2A). The number of dmCpGs increased to 101,949 after the second round of eribulin (64,351 hypomethylated CpGs; 37,598 hypermethylated CpGs) (Figure 2B). There were more hypomethylated CpGs after each eribulin treatment than hypermethylated CpGs (first round: 55% of dmCpGs; second round: 63% of dmCpGs; Figure 2C). The first and second rounds of eribulin resulted in the same direction of change in methylation levels at nearly all methylated CpGs (Figure 2D). In all, 24,024 hypomethylated CpGs (91% of single-treatment sites) and 17,003 hypermethylated CpGs (80% of single-treatment sites) were shared between the first and second eribulin treatments. Furthermore, the dmCpGs associated with the secondary eribulin treatment were located within similar sets of genes as the dmCpGs related to the initial eribulin treatment. Thousands of genes had an increase in the proportion of dmCpGs per gene (Figure 2E & Supplementary Figure 2A). The biological processes associated with hypermethylated and hypomethylated CpGs across both eribulin hits were similar (Supplementary Figure 2B).
Figure 2. . Additional eribulin treatment increases alterations in DNA methylation patterns.

(A) Volcano plot of dmCpGs associated with first eribulin treatment compared with the methylation status of parental cells determined by an epigenome-wide association study. (B) Volcano plots of dmCpGs associated with second eribulin treatment compared with the methylation status of parental cells determined by an epigenome-wide association study. Those colored in red are considered to be differentially methylated at a q-value < 0.05. (C) Comparison of number of dmCpGs based on treatment type and number of treatments. Those colored in red are the number of hypomethylated CpGs compared with the methylation status of parental cells. Colored in blue are the number of hypermethylated CpGs compared with methylation status of parental cells. (D) Venn diagram of dmCpGs associated with the first treatment of eribulin and associated with the second treatment of eribulin. (E) Number of genes that have either decreased, unchanged, or increased proportion of CpGs that are differentially methylated with the second treatment of eribulin as compared with the proportion of CpGs that are differentially methylated with the first treatment of eribulin.
dmCpG: Differentially methylated CpG.
While tens of thousands of CpGs were identified to be differentially methylated in eribulin-treated TNBC cells compared with untreated cells, we observed relatively few dmCpGs following paclitaxel treatment. Only 12 and nine CpGs were differentially methylated after the first and second rounds of paclitaxel treatment, respectively (Supplementary Figure 3A–C).
To identify patterns of differential methylation levels at specific genomic loci, we tested dmCpGs induced by drug treatment for enrichment at genomic contexts, first in relation to the gene structure and second in relation to the location of the CpG. Both hypermethylated and hypomethylated CpGs associated with eribulin treatment exhibited significant enrichment, particularly within enhancer regions (Figure 3A). Specifically, hypermethylated CpGs displayed an enrichment in regions of open chromatin. Conversely, hypomethylated CpGs demonstrated an enrichment in sites corresponding to transcription factor binding sites. Notably, the distribution differed further; hypermethylated CpGs exhibited an enrichment within shore/shelf and open sea regions (these regions refer to inter-CpG island regions or areas with sparser clusters of CpGs), while hypomethylated CpGs were enriched exclusively within open sea regions (Figure 3B). These observations collectively propose the existence of potentially distinct regulatory roles for hypermethylation and hypomethylation, contributing to the modulation of gene expression and cellular processes within specific genomic landscapes in response to eribulin treatment.
Figure 3. . Eribulin treatment associated with differentially methylated CpGs are enriched.

Enrichment of differentially methylated CpG sites (dmCpGs) in various genomic contexts: (A) according to gene structure and (B) in association with CpG islands. Odds ratios were calculated by Fisher’s exact test. Blue points and confidence intervals indicate enrichment from dmCpGs associated with the first eribulin treatment. Yellow points and confidence intervals indicate enrichment from dmCpGs associated with the second eribulin treatment. Circular points indicate CpGs with increased methylation levels in treated cells. Triangular points indicate CpGs with decreased methylation levels in treated cells.
Differential methylation patterns are detected in EMT-associated genes
We found that MDA-MB 231 cells treated with eribulin exhibited a significant increase in the expression of genes encoding epithelial markers such as E-cadherin (CDH1) and a decrease in mesenchymal markers like N-cadherin (CDH2), ZEB1 and VIM compared with control and paclitaxel-treated cells (Figure 4A & B). This suggests that eribulin induces MET, consistent with previous findings [18]. Subsequently, we investigated the differential methylation patterns in genes related to EMT. Among 21 EMT-associated genes (CDH1, CLDN1, EPCAM, ITGB4, KRT8, KRT14, OCLN, CDH2, FN1, ITGB1, MMP19, MMP2, VIM, SNAI1, SNAI2, TWIST1, ZEB1, ZEB2, OVOL1, OVOL2, GHRL), 40 and 94 dmCpGs were associated with the first and second eribulin treatments, respectively. dmCpGs were notably hypomethylated in eribulin-treated cells within EMT-associated transcription factor-encoding genes (SNAI1, SNAI2, TWIST1, ZEB1, ZEB2; Figure 4C). Like other dmCpGs, the number of dmCpGs increased with additional eribulin treatment in 80% of the EMT-associated genes (Supplementary Figure 4). A large proportion of dmCpGs, exceeding 50 and 70%, were situated within the gene bodies and DNase-hypersensitive sites of EMT-associated genes, respectively. Additionally, a substantial number of dmCpGs, approximately 10%, were identified in the promoter regions of EMT-associated genes (Figure 4D).
Figure 4. . Differential methylation patterns are detected in mesenchymal-to-epithelial transition-associated genes.

(A & B) RT-PCR and immunoblot analysis of epithelial-to-mesenchymal transition markers in cells treated with eribulin and paclitaxel. (C) Heat map of the direction of methylation level change (β coefficient from epigenome-wide association study) in CpGs located in mesenchymal-to-epithelial transition (MET)-associated genes. Tiles with * indicate a significant difference in methylation levels compared with untreated cells. The vertical tracking bar indicates which MET-associated gene the CpG is located in. (D) Proportion of dmCpGs in different genomic regions of MET-associated genes by direction of methylation change and number of eribulin treatments. (E) Heat map of the level of significance for transcription factor motifs associated with dmCpGs in ZEB1 binding sites.
*p < 0.05; **p < 0.001; ***p < 0.0005; ****p < 0.0001; t-test.
We observed that dmCpGs were enriched in enhancers, transcription factor binding sites and open chromatin regions (Figure 3A). Eribulin has been shown to modify the ZEB1-SWI/SNF complex interaction and induce MET [18]. To further explore the changes in DNA methylation patterns associated with eribulin treatment, we conducted CUT&RUN experiments for cross-referencing with ZEB1 cistromes. Our objective was not only to map open chromatin regions but to understand the specific effects of eribulin on DNA methylation in particular genomic regions, with a special emphasis on genes involved in EMT. For a deeper understanding of the epigenetic modifications due to eribulin treatment, we analyzed the DNA methylation patterns at ZEB1 binding sites. We sought to determine whether differential methylation influences other transcription factors present at ZEB1 binding regions. To this end, we performed transcription factor motif enrichment tests on ZEB1 binding sites (as identified from our CUT&RUN experiment) that contain dmCpGs. Our analysis revealed that after the first and second eribulin treatments, there were 19 and 15 significantly enriched transcription factor motifs for dmCpG-containing ZEB1 binding sites, respectively (Figure 4E). Interestingly, motifs for CEBP proteins (CEBPA, CEBPB, CEBPD, CEBPE), NF-κB1/2, TCF proteins (TCF12, TCF3, TCF4) and ZEB1 were enriched by eribulin. These findings suggest that eribulin treatment may affect the binding of specific transcription factors to ZEB1 binding sites, or the binding of ZEB1 to different regions containing dmCpGs.
We aimed to investigate signaling pathways epigenetically impacted by eribulin. We identified 91 pathways associated with genes that had significantly hypermethylated CpGs and 57 pathways associated with genes that had significantly hypomethylated CpGs (q-value < 0.05; Supplementary Tables 1 & 2). Specifically, our analysis demonstrated that eribulin resulted in differential methylation of CpGs in genes associated with the VEGF signaling pathway (Figure 5A). Also, differential methylation was observed in the PI3K-AKT and MAPK signaling pathways (Supplementary Figure 5A & Supplementary Tables 1 & 2). qRT-PCR analysis further validated the downregulation of VEGFA and NFKB1/2 in cells treated with eribulin (Figure 5B). Furthermore, eribulin caused altered methylation levels of the CpGs in different VEGF genes (VEGFA/B/C) and altered ZEB1 interactions with the NF-κB1/2 transcription factor locus, as shown through CUT&RUN (Figure 5C–E & Supplementary Tables 3 & 4). Cytokine array analysis and qRT-PCR revealed alterations in cytokine expression levels in eribulin-treated cells compared with parental control. Specifically, CXCL1 and VEGF exhibited significant decreases, corroborating the notion of increased DNA methylation within these pathways in eribulin-persisting cells (Figure 5F & Supplementary Figure 5B). In addition, we observed differential methylation at CpGs of genes involved in cell adhesion, focal adhesion and gap junction pathways after both the first and second rounds of eribulin (Supplementary Figure 5C & D). These results suggest that eribulin may suppress the VEGF signaling pathway while promoting cell adhesion and intercellular communication through alterations in DNA methylation. These findings provide insight into the mechanisms underlying eribulin-induced cellular changes and suggest potential therapeutic strategies for resistant cancer cells.
Figure 5. . Genes with differentially methylated CpGs are associated with key biological processes in the mesenchymal-to-epithelial transition.

(A) The VEGF signaling pathway was associated with hypermethylated CpGs from the second eribulin treatment. (B) RT-PCR analysis was conducted on genes within pathways that were differentially methylated. (C–E) ZEB1 localization at genomic loci genes was evaluated by CUT&RUN signal track analysis across all conditions. (F) Heat map depicting the levels of cytokines and chemokines determined through a multiplex cytokine assay.
*p < 0.05; **p < 0.001; ***p < 0.0005; ****p < 0.0001; t-test.
Eribulin treatment in patients with TNBC alters tumor expression of DNA methylation regulatory enzymes
To explore the mechanism underlying eribulin-induced modification of DNA methylation in MDA-MB-231 cells, we employed RT-qPCR analysis to measure the expression of enzymes regulating DNA methylation. Our results revealed significant increases in the expression of TET1, DNMT3A and DNMT3B in eribulin-treated cells compared with parental and paclitaxel-treated cells. In contrast, the expression of TET2, DNMT1 and DNMT3L remained unchanged or was downregulated (Figure 6A). Those findings were confirmed by immunoblot analysis (Figure 6B). Additionally, we utilized RT-qPCR and western blot analyses to investigate the expression levels of Dnmt1, Dnmt3a and Tet1 in PB3 cancer cells. These cells originate from an MMTV-PyMT transgene-driven murine mammary tumor and exist in a quasi-mesenchymal state. We examined both untreated PB3 cells and those treated with eribulin and paclitaxel [18]. Our findings in these cells were consistent with the results observed in MDA-MB-231 cells (Supplementary Figure 6A & B).
Figure 6. . Eribulin treatment in primary human triple-negative breast cancers alters the expression of DNA methylation regulatory enzymes.

(A) Quantitative RT-PCR was performed to assess the expression levels of DNA methylation markers in the MDA MB-231 parental line and its resistant counterparts. (B) Immunoblotting was performed to assess the protein levels of DNA methylation markers in the MDA MB-231 parental line and its resistant counterparts. (C & D) Representative images and quantification of DNMT1 and DNMT3A were obtained through immunohistochemical analysis of specimens treated with AC-T and ERI. Statistical analysis was conducted using the t-test.
AC-T: Adriamycin/cyclophosphamide followed by paclitaxel; ERI: Eribulin.
We conducted immunohistochemical staining for TET1, DNMT1 and DNMT3A on TNBC diagnostic core biopsy specimens (pre-treatment) and surgical specimens (post-treatment) obtained from patients who received neoadjuvant chemotherapy. We compared samples from 53 patients who participated in the SOLTI1007 NeoEribulin clinical trial [22] and received four cycles of neoadjuvant eribulin versus 14 patients who underwent the standard-of-care neoadjuvant treatment: four cycles of adriamycin/cyclophosphamide followed by four cycles of paclitaxel (AC-T). The immunohistochemistry results confirmed our in vitro findings, demonstrating that levels of DNMT1 remained relatively stable, with only a minor (4.37%) reduction in AC-T treated tumors. On the other hand, tumors treated with eribulin showed a significant decrease in DNMT1 levels, with an overall reduction of 83.4%. Delving deeper, 56.82% of these specimens had no DNMT1 expression, while 13.64% displayed DNMT1 expression in 10% or fewer malignant cells (Figure 6C). The levels of DNMT3A did not show significant changes in AC-T-treated specimens; however, eribulin-treated specimens exhibited a remarkable 86% increase in DNMT3A expression overall. Specifically, among the post-eribulin specimens, 30.43% of tumors displayed 90–100% DNMT3A expression, and 39.13% demonstrated 50–89.9% expression. In comparison, pretreated samples exhibited only 4.35 and 13.04% DNMT3A expression in 90–100 and 50–89.9% of malignant cells, respectively (Figure 6D). Notably, the levels of TET1 did not exhibit any significant temporal changes in the tumors of any of the patients (Supplementary Figure 6).
Discussion
We previously demonstrated that treatment with eribulin induces widespread changes in chromatin and gene expression patterns in TNBC cells [18]. As DNA methylation plays a critical role in gene expression regulation and maintaining genome stability, we measured genome-scale DNA methylation patterns in eribulin-treated cells to understand the associated epigenetic changes. Our findings indicate that eribulin has a broad impact on the DNA methylation of breast cancer cells, by increasing the expression of DNMT3A/B and decreasing the expression of DNMT1. Eribulin causes distinct changes in DNA methylation patterns in MDA-MB-231 cells when compared with untreated or paclitaxel-treated cells (Figure 1). These changes are more noticeable in drug-tolerant persister cells that arise after repeated eribulin treatments. An intriguing aspect of our study is the exploration of the reversibility of DNA methylation changes following eribulin treatment. We specifically focused on drug-resistant cells that had survived the treatment, examining them at different time points when they were not actively undergoing drug exposure. This approach provided unique insights into the persistence of epigenetic alterations post treatment. The results suggest the existence of an epigenetic memory effect in these cells. Such an effect could have profound implications on cell behavior, indicating that the influence of eribulin on DNA methylation may extend beyond the active treatment phase. This observation adds a new dimension to our understanding of how cancer cells adapt and respond to chemotherapy at the epigenetic level. Moreover, our results align with previous reports of chemotherapy-induced epigenetic modifications, including DNA methylation variations [5,33]. Intriguingly, we observed that eribulin treatment leads to more significant methylation dysregulation compared with paclitaxel. This might be a contributing factor to the eribulin-induced MET and the development of epithelial-like persistent cells (Figure 1C) [18,21].
The numbers of differentially methylated CpGs increased with additional eribulin treatments, with a higher proportion of hypomethylated CpGs compared with hypermethylated CpGs. This finding supports the concept of epigenetic plasticity [9], which refers to the ability of cancer cells to adapt to environmental changes by altering the epigenetic landscape. On the other hand, few CpGs were differentially methylated with paclitaxel treatment, consistent with previous studies demonstrating that paclitaxel does not significantly alter DNA methylation patterns in breast cancer cells (Figure 2 & Supplementary Figure 3) [34,35]. Eribulin, a microtubule dynamics inhibitor, exerts its primary mode of action by impeding the process of tubulin polymerization. This interference can impact various cellular processes, including transcriptional regulation, which might indirectly influence the expression and activity of DNA methyltransferases and demethylases. Previous literature has shown that microtubule-targeting agents can alter the nuclear structure and chromatin organization, thereby affecting gene expression [36,37]. Such changes can have indirect effects on the activity and expression of DNMTs and demethylases. Our results suggest that eribulin induces significant changes in DNA methylation patterns that may contribute to the acquisition of drug tolerance/resistance in cancer cells. Moreover, these findings highlight the potential of epigenetic-targeted therapies as a complementary approach to conventional chemotherapy to treat TNBC [36,37]. Further studies are needed to investigate the functional consequences of eribulin-induced DNA methylation changes and their role in drug tolerance/resistance acquisition in cancer cells.
We aimed to identify patterns of differential DNA methylation associated with eribulin treatment in TNBC cells. Our results revealed both hypermethylated and hypomethylated CpGs associated with eribulin treatment enriched in enhancers, with hypermethylated CpGs also enriched in open chromatin regions and hypomethylated CpGs enriched in transcription factor binding sites (Figure 3). Transcription factor motif enrichment tests revealed that eribulin might affect the binding of specific transcription factors to ZEB1 binding sites, or the binding of ZEB1 to different regions containing dmCpGs, providing new insights into molecular mechanisms underlying eribulin-induced MET (Figure 4) [38,39]. Additionally, our findings suggest that eribulin can regulate multiple cellular pathways, including the VEGF signaling pathway, cell adhesion, focal adhesion and gap junction pathways (Figure 5 & Supplementary Figure 5A), by altering DNA methylation patterns [39]. Specifically, eribulin treatment led to hypermethylation of genes involved in VEGF-related signaling pathways, critical pathways for cancer cell survival, proliferation and metastasis [40], and hypomethylation of genes involved in maintaining normal cellular functions and tissue architecture. Moreover, our results showed that eribulin altered interactions between ZEB1 and NF-κB1/2 transcription factors, highlighting its potential role in regulating EMT and providing new insights into the molecular mechanisms underlying eribulin-induced MET [41].
The balance between maintenance and de novo methylation is essential for the epigenetic landscape of cells. The maintenance methyltransferase DNMT1 preserves methylation patterns, while an increase in the de novo methyltransferases DNMT3A/B can introduce new methylation marks [42]. In cancer, a decrease in DNMT1 expression or function can cause genome instability and aberrant gene expression, while upregulation of DNMT3A/B has been associated with promoter hypermethylation of specific genes involved in tumorigenesis. It has been suggested that DNMT3A/B help correct errors made by DNMT1 after DNA synthesis [43,44]. Our study revealed that eribulin-tolerant persister cells exhibited downregulation of DNMT1 and upregulation of DNMT3A/B and TET, which is involved in active DNA demethylation. The concurrent decrease in DNMT1 and increase in DNMT3A/B and TET1 suggest a dynamic reconfiguration of the methylation landscape. The dynamic we observed is similar to studies where DNMT3A and TET1 were reported to work together in a competitive yet complementary way to regulate gene expression and epigenetic landscapes. DNMT3A is mainly found at distal promoters and the periphery of low-methylated regions, while TET1 is more prevalent at proximal promoters and within these regions [45]. Our clinical data further supported these findings by demonstrating that eribulin-treated human tumor specimens had higher levels of DNMT3A and lower levels of DNMT1 compared with pretreatment specimens (Figure 6 & Supplementary Figure 6).
The implications of altered DNA methylation patterns in cancer have been well documented [46,47]. In breast cancer, aberrant DNA methylation patterns have been linked to tumor aggressiveness, and targeting DNA methylation pathways has been explored as a therapeutic strategy [48]. Our study adds to this body of literature by providing evidence that eribulin treatment may broadly affect DNA methylation patterns in TNBC. Our clinical data also support our in vitro findings, as we observed changes in the expression of DNMT1 and DNMT3A in TNBC specimens obtained from patients treated with eribulin compared with those treated with standard-of-care chemotherapy. These findings are consistent with previous studies that have reported alterations in DNA methylation patterns in response to chemotherapy [49,50]. In previous research, we established that eribulin triggers the MET, leading to the development of eribulin-resistant epithelial cells [18]. The specific mechanisms underlying this resistance, however, were not fully understood. Our current study sheds light on this area, revealing a correlation between eribulin treatment and DNA methylation changes, which may be linked to MET. We hypothesize that these epigenetic modifications could alter the expression of cancer-related genes, thereby affecting drug sensitivity or resistance. These findings enhance our understanding of the complex relationship between MET and drug response, particularly in the context of eribulin treatment.
Conclusion
Microtubule dynamics inhibitors such as eribulin interfere with the tubulin polymerization process, disrupting mitotic spindle formation and subsequently arresting the cell cycle. This impacts various cellular processes, including transcriptional regulation. Previous studies showed that microtubule-targeting agents can influence the expression of genes by altering nuclear structure and chromatin organization. Changes in gene expression can indirectly affect DNMTs and demethylases, but the underlying mechanisms are not well understood [36,51]. Moreover, we found that eribulin induces the MET, which influences drug-responsiveness. Despite the eribulin-induced MET, the resulting epithelial cells develop resistance to the drug. Our findings suggest that this resistance may be linked to eribulin-associated DNA methylation changes, which could affect the expression of genes related to cancer progression and drug sensitivity. Our study sheds light on the mechanism(s) of action of eribulin in breast cancer and suggests that eribulin alters DNA methylation patterns in primary human TNBC tumors by upregulating DNMT3A/B and downregulating DNMT1. These findings have clinical implications for the use of eribulin as a therapeutic agent for breast cancer.
Summary points.
Eribulin, a chemotherapeutic drug, induces significant epigenetic changes in triple-negative breast cancer cells, affecting DNA methylation and epigenetic modifier expression.
The study compared eribulin treatment with standard-of-care treatment in 53 patients, revealing a unique mechanism of action through epigenetic modulation.
Eribulin showed a higher efficacy in altering DNA methylation patterns than paclitaxel, particularly in drug-tolerant persister cells.
DNA methylation changes were associated with gene expression alterations in the epithelial-to-mesenchymal transition process, suggesting a mesenchymal-to-epithelial transition.
Eribulin-treated cells displayed increased expression of DNMT3A/B and decreased DNMT1, suggesting a reconfiguration of DNA methylation patterns.
Eribulin impacts several signaling pathways, including VEGF, PI3K-AKT and MAPK, through epigenetic modifications.
The study provides evidence of eribulin’s role in reprogramming the tumor microenvironment, as seen by the downregulation of the VEGFA and NFKB1/2 genes and alterations in cytokine profiles.
The results highlight the potential of eribulin as a therapeutic agent for breast cancer, significantly affecting tumor epigenetics and gene regulation.
Supplementary Material
Acknowledgments
The authors thank O Wilkins at the Center for Quantitative Biology at Dartmouth for providing code for statistical analysis. They also thank the Dartmouth Cancer Center Genomics and Molecular Biology Shared Resource (RRID: SCR_021293) and Pathology Shared Resource (RRID: SCR_023479). Funding and resources for the shared resources were supported in part by a core grant (P30CA023108; Dartmouth Cancer Center).
Footnotes
Supplementary data
To view the supplementary data that accompany this paper please visit the journal website at: www.futuremedicine.com/doi/suppl/10.2217/epi-2023-0339
Author contributions
The project was conceived and designed by M Bagheri and M Lee. The methodology was developed by M Bagheri, M Lee, K Muller, T Miller and B Christensen. Data acquisition was carried out by M Bagheri and M Lee. Data analysis and interpretation were performed by M Bagheri, M Lee, K Muller, T Miller and B Christensen. The manuscript was written, reviewed and/or edited by M Bagheri, M Lee, K Muller, T Miller, B Christensen and D Pattabiraman. T Miller, B Christensen and D Pattabiraman supervised the study.
Financial disclosure
Research reported in this publication was supported through the Geisel School of Medicine at Dartmouth’s Center for Quantitative Biology through a grant from the NIGMS Award P20GM130454, an NIH S10 (S10OD025235) grant, and funding from The Elmer R Pfefferkorn & Allan U Munck Education and Research Fund at Dartmouth (D Pattabiraman). This work was supported by funding from METAvivor (D Pattabiraman) and NIH (R00CA201574 [D Pattabiraman], R01CA267691 [D Pattabiraman and T Miller] and R01CA216265, R01CA253976 [B Christensen]). This study received partial support through a Sponsored Research Agreement from Eisai, Inc. to D Pattabiraman; the authors and Eisai, Inc. declare no competing interests related to this study. B Christensen is an advisor to Guardant Health, which had no role in this research. All other authors report that they have no conflicts of interest to declare. The authors have no other relevant affiliations or financial involvement with any organization or entity with a financial interest in or financial conflict with the subject matter or materials discussed in the manuscript apart from those disclosed. This includes employment, consultancies, honoraria, stock ownership or options, expert testimony, grants or patents received or pending, or royalties.
Competing interests disclosure
This study was partially supported by Eisai Inc. through a Sponsored Research Agreement, which was reviewed and approved by Eisai Inc. The authors and Eisai Inc. declare no competing interests related to the study. The authors have no other competing interests or relevant affiliations with any organization or entity with the subject matter or materials discussed in the manuscript apart from those disclosed. This includes employment, consultancies, honoraria, stock ownership or options, expert testimony, grants or patents received or pending, or royalties.
Writing disclosure
No writing assistance was utilized in the production of this manuscript.
Ethical conduct of research
SOLTI-1007-NeoEribulin was done in accordance with Good Clinical Practice guidelines and the Declaration of Helsinki. The study protocol was approved by independent ethics committees at each center and the Agencia Española de Medicamentos y Productos Sanitarios. All patients provided written informed consent. Specimens from Dartmouth-Hitchcock Medical Center were obtained through clinically indicated procedures for diagnostic purposes. Use of these specimens for this research was approved the Dartmouth Health Human Research Protection Program (STUDY02000731).
Data sharing statement
The raw and analyzed data were submitted to the Gene Expression Omnibus with the accession number GSE234881.
References
Papers of special note have been highlighted as: • of interest; •• of considerable interest
- 1.Nguyen HT, Huynh LAK, Nguyen TV et al. Multimodal analysis of ctDNA methylation and fragmentomic profiles enhances detection of nonmetastatic colorectal cancer. Future Oncol. 18(35), 3895–3912 (2022). [DOI] [PubMed] [Google Scholar]
- 2.Lehmann BD, Bauer JA, Chen X et al. Identification of human triple-negative breast cancer subtypes and preclinical models for selection of targeted therapies. J. Clin. Invest. 121(7), 2750–67 (2011). [DOI] [PMC free article] [PubMed] [Google Scholar]
- 3.Foulkes WD, Smith IE, Reis-Filho JS. Triple-negative breast cancer. N. Engl. J. Med. 363(20), 1938–48 (2010). [DOI] [PubMed] [Google Scholar]
- 4.Houvenaeghel G, Sabatier R, Reyal F, Classe JM et al. Axillary lymph node micrometastases decrease triple-negative early breast cancer survival. Br. J. Cancer 115(9), 1024–1031 (2016). [DOI] [PMC free article] [PubMed] [Google Scholar]
- 5.Wang N, Ma T, Yu B. Targeting epigenetic regulators to overcome drug resistance in cancers. Sig. Transduct. Target Ther. 8, 69 (2023). [DOI] [PMC free article] [PubMed] [Google Scholar]; • Understanding epigenetic regulation in tumor resistance is crucial because it offers new avenues for cancer treatment, particularly in overcoming drug resistance, a major hurdle in effective cancer therapy.
- 6.Sharma S, Kelly TK, Jones PA. Epigenetics in cancer. Carcinogenesis 31(1), 27–36 (2010). [DOI] [PMC free article] [PubMed] [Google Scholar]
- 7.Sharma P, Kumar S. Metabolic reprogramming in triple-negative breast cancer. Front. Oncol. 10, 428 (2021). [DOI] [PMC free article] [PubMed] [Google Scholar]
- 8.Branham MT, Marzese DM, Laurito SR et al. Methylation profile of triple-negative breast carcinomas. Oncogenesis 1(7), e17 (2012). [DOI] [PMC free article] [PubMed] [Google Scholar]; •• The interest in this study lies in its potential to improve our understanding and treatment of triple-negative breast cancers by identifying a unique methylation profile in triple-negative tumors, which are notably comparable to our finding.
- 9.Esteller M, Silva JM, Dominguez G et al. Promoter hypermethylation and BRCA1 inactivation in sporadic breast and ovarian tumors. J. Natl Cancer Inst. 92(7), 564–9 (2000). [DOI] [PubMed] [Google Scholar]
- 10.Jones PA, Baylin SB. The epigenomics of cancer. Cell 128(4), 683–92 (2007). [DOI] [PMC free article] [PubMed] [Google Scholar]
- 11.Lu Y, Roy S, Nuovo G et al. Anti-microRNA-222 (anti-miR-222) and -181B suppress the growth of tamoxifen-resistant xenografts in mouse by targeting TIMP3 protein and modulating mitogenic signal. J. Biol. Chem. 293(10), 3588 (2011). [DOI] [PMC free article] [PubMed] [Google Scholar]
- 12.Fackler MJ, Umbricht CB, Williams D et al. Genome-wide methylation analysis identifies genes specific to breast cancer hormone receptor status and risk of recurrence. Cancer Res. 71(19), 6195–207 (2011). [DOI] [PMC free article] [PubMed] [Google Scholar]
- 13.Ma Y, Chai N, Jiang Q et al. DNA methyltransferase mediates the hypermethylation of the microRNA 34a promoter and enhances the resistance of patient-derived pancreatic cancer cells to molecular targeting agents. Pharmacol. Res. 160, 105071 (2020). [DOI] [PubMed] [Google Scholar]
- 14.Zhang Z, Wang G, Li Y et al. Recent progress in DNA methyltransferase inhibitors as anticancer agents. Front. Pharmacol. 13, 1072651 (2022). [DOI] [PMC free article] [PubMed] [Google Scholar]
- 15.Stewart ML, Tamayo P, Wilson AJ et al. KRAS genomic status predicts the sensitivity of ovarian cancer cells to decitabine. Cancer Res. 75(14), 2897–906 (2015). [DOI] [PMC free article] [PubMed] [Google Scholar]
- 16.US Food and Drug Administration. FDA approves eribulin mesylate injection for the treatment of breast cancer (2010). www.fda.gov/news-events/press-announcements/fda-approves-eribulin-mesylate-injection-treatment-breast-cancer
- 17.Twelves C, Cortes J, Vahdat L et al. Efficacy of eribulin in women with metastatic breast cancer: a pooled analysis of two phase 3 studies. Breast Cancer Res. Treat. 149(1), 313 (2014). [DOI] [PMC free article] [PubMed] [Google Scholar]
- 18.Bagheri M, Mohamed GA, Pattabiraman DR et al. Pharmacological induction of mesenchymal–epithelial transition chemosensitizes breast cancer cells and prevents metastatic progression. bioRxiv (2023) (Preprint). [Google Scholar]
- 19.Thiery JP, Acloque H, Huang RY, Nieto MA. Epithelial–mesenchymal transitions in development and disease. Cell 139(5), 871–90 (2009). [DOI] [PubMed] [Google Scholar]
- 20.Nieto MA, Huang RY, Jackson RA, Thiery JP. EMT: 2016. Cell 166(1), 21–45 (2016). [DOI] [PubMed] [Google Scholar]
- 21.Lee M, Brown SM, Wilkins MO, Pattabiraman RD, Christensen CB. Distinct cytosine modification profiles define epithelial-to-mesenchymal cell-state transitions. Epigenomics 14(9), 519–535 (2022). [DOI] [PMC free article] [PubMed] [Google Scholar]
- 22.Pascual T, Oliveira M, Villagrasa P et al. Neoadjuvant eribulin in HER2-negative early-stage breast cancer (SOLTI-1007-NeoEribulin): a multicenter, two-cohort, non-randomized phase II trial. NPJ Breast Cancer 7, 145 (2021). [DOI] [PMC free article] [PubMed] [Google Scholar]
- 23.Illumina Human methylation EPIC annotation to use with IlluminaHumanMethylationEPICB5manifest and minfi. https://github.com/achilleasNP/IlluminaHumanMethylationEPICanno.ilm10b5.hg38
- 24.Zhou W, Triche JT, Laird WP, Shen H. SeSAMe: reducing artifactual detection of DNA methylation by Infinium BeadChips in genomic deletions. Nucleic Acids Res. 46(20), e123 (2018). [DOI] [PMC free article] [PubMed] [Google Scholar]; • SeSAMe is a potent tool to analyze methylation data. It provides bioinformatics support for our research to analyze methylation data accurately.
- 25.Xu Z, Niu L, Taylor JA. The ENmix DNA methylation analysis pipeline for Illumina BeadChip and comparisons with seven other preprocessing pipelines. Clin. Epigenet. 13(1), 216 (2021). [DOI] [PMC free article] [PubMed] [Google Scholar]
- 26.O’Sullivan DE, Johnson KC, Skinner L, Koestler DC, Christensen BC. Epigenetic and genetic burden measures are associated with tumor characteristics in invasive breast carcinoma. Epigenetics 11(5), 344–53 (2016). [DOI] [PMC free article] [PubMed] [Google Scholar]
- 27.Ritchie EM, Phipson B, Wu D et al. Limma powers differential expression analyses for RNA-sequencing and microarray studies. Nucleic Acids Res. 43(7), e47 (2015). [DOI] [PMC free article] [PubMed] [Google Scholar]
- 28.McLean CY, Bristor D, Hiller M. GREAT improves functional interpretation of cis-regulatory regions. Nat. Biotechnol. 28, 495–501 (2010). [DOI] [PMC free article] [PubMed] [Google Scholar]
- 29.Yu G, Wang LG, Han Y, He QY. ClusterProfiler: an R package for comparing biological themes among gene clusters. Omics 16, 284–287 (2012). [DOI] [PMC free article] [PubMed] [Google Scholar]
- 30.Wu T, Hu E, Xu S et al. ClusterProfiler 4.0: a universal enrichment tool for interpreting omics data. Innovation 2(3), 100141 (2021). [DOI] [PMC free article] [PubMed] [Google Scholar]
- 31.Castro-Mondragon AJ, Riudavets-Puig R, Rauluseviciute L et al. JASPAR: the 9th release of the open-access transcription factor binding profiles database. Nucleic Acids Res. 50(D1), D165–D173 (2022). [DOI] [PMC free article] [PubMed] [Google Scholar]
- 32.Tan G, Lenhard B. TFBSTools: an R/bioconductor package for transcription factor binding site analysis. Bioinformatics 15, 1555–1556 (2016). [DOI] [PMC free article] [PubMed] [Google Scholar]
- 33.Yang X, Lay F, Han H, Jones PA. Targeting DNA methylation for epigenetic therapy. Trends Pharmacol. Sci. 31, 536–546 (2010). [DOI] [PMC free article] [PubMed] [Google Scholar]
- 34.Rea M, Eckstein M, Eleazer R et al. Genome-wide DNA methylation reprogramming in response to inorganic arsenic links inhibition of CTCF binding, DNMT expression and cellular transformation. Sci Rep 7, 41474 (2017). [DOI] [PMC free article] [PubMed] [Google Scholar]
- 35.Cowling VH, Cole MD. E-cadherin repression contributes to c-Myc-induced epithelial cell transformation. Oncogene 26 (24), 3582–3586 (2007). [DOI] [PubMed] [Google Scholar]
- 36.Hamadneh L, Abu-Irmaileh B, Al-Majawleh M, Bustanji Y, Jarrar Y, Al-Qirim T. Doxorubicin–paclitaxel sequential treatment: insights of DNA methylation and gene expression changes of luminal A and triple negative breast cancer cell lines. Mol. Cell. Biochem. 476, 3647–3654 (2021). [DOI] [PubMed] [Google Scholar]; •• Fascinating study that emphasizes the intricate connection between DNA methylation, changes in gene expression and response to chemotherapy in various breast cancer cell lines. It supports our research on the relationship between DNA methylation, gene expression changes and chemotherapy response.
- 37.Pedersen CA, Cao MD, Fleischer T et al. DNA methylation changes in response to neoadjuvant chemotherapy are associated with breast cancer survival. Breast Cancer Res. 24, 43 (2022). [DOI] [PMC free article] [PubMed] [Google Scholar]; • This study is significant because it reveals that DNA methylation patterns in breast cancer tumors change in response to neoadjuvant chemotherapy, similar to our study, and these changes can predict long-term survival.
- 38.Yu J, Zayas J, Qin B, Wang L. Targeting DNA methylation for treating triple-negative breast cancer. Pharmacogenomics 20, 1151–1157 (2019). [DOI] [PMC free article] [PubMed] [Google Scholar]
- 39.Serrano-Gomez SJ, Maziveyi M, Alahari SK. Regulation of epithelial–mesenchymal transition through epigenetic and post-translational modifications. Mol. Cancer 15, 18 (2016). [DOI] [PMC free article] [PubMed] [Google Scholar]
- 40.Bianchini G, Balko JM, Mayer IA, Sanders ME, Gianni L. Triple-negative breast cancer: challenges and opportunities of a heterogeneous disease. Nat. Rev. Clin. Oncol. 13, 674–690 (2016). [DOI] [PMC free article] [PubMed] [Google Scholar]
- 41.Bulle A, Dekervel J, Libbrecht L et al. Gemcitabine induces epithelial-to-mesenchymal transition in patient-derived pancreatic ductal adenocarcinoma xenografts. Am. J. Transl. Res. 15, 765–779 (2019). [PMC free article] [PubMed] [Google Scholar]
- 42.Chen T, Ueda Y, Dodge JE, Wang Z, Li E. Establishment and maintenance of genomic methylation patterns in mouse embryonic stem cells by Dnmt3a and Dnmt3b. Mol. Cell. Biol. 23(16), 5594–5605 (2003). [DOI] [PMC free article] [PubMed] [Google Scholar]
- 43.Man X, Li Q, Wang B, Zhang H, Zhang S, Li Z. DNMT3A and DNMT3B in breast tumorigenesis and potential therapy. Front. Cell. Dev. Biol. 10, 916725 (2022). [DOI] [PMC free article] [PubMed] [Google Scholar]
- 44.Baylin S, Jones P. A decade of exploring the cancer epigenome– biological and translational implications. Nat. Rev. Cancer 11(10), 726–34 (2011). [DOI] [PMC free article] [PubMed] [Google Scholar]
- 45.Gu T, Lin X, Cullen SM et al. DNMT3A and TET1 cooperate to regulate promoter epigenetic landscapes in mouse embryonic stem cells. Genome Biol. 19(1), 88 (2018). [DOI] [PMC free article] [PubMed] [Google Scholar]
- 46.Zolota V, Tzelepi V, Piperigkou Z et al. Epigenetic alterations in triple-negative breast cancer – the critical role of extracellular matrix. Cancers 13(4), 713 (2021). [DOI] [PMC free article] [PubMed] [Google Scholar]
- 47.Cheng Y, He C, Wang M et al. Targeting epigenetic regulators for cancer therapy: mechanisms and advances in clinical trials. Signal Transduct. Target. Ther. 4, 62 (2019). [DOI] [PMC free article] [PubMed] [Google Scholar]
- 48.Baylin SB, Jones PA. Epigenetic determinants of cancer. Cold. Spring. Harb. Perspect. Biol. 8(9), a019505 (2016). [DOI] [PMC free article] [PubMed] [Google Scholar]
- 49.Fang F, Turcan S, Rimner A, Kaufman A, Giri D, Morris LGT. Breast cancer methylomes establish an epigenomic foundation for metastasis. Sci. Transl. Med. 3(75), 75ra25 (2011). [DOI] [PMC free article] [PubMed] [Google Scholar]; •• Provides specific DNA methylation patterns in breast cancer that relate to metastatic risk and patient survival, providing insights into cancer progression and the potential for developing novel prognostic biomarkers that support our study.
- 50.Foulks JM, Parnell KM, Nix RN et al. Epigenetic drug discovery: targeting DNA methyltransferases. J. Biomol. Screen. 17(1), 2–17 (2012). [DOI] [PubMed] [Google Scholar]
- 51.Krushkal J, Silvers T, Reinhold WC et al. Epigenome-wide DNA methylation analysis of small cell lung cancer cell lines suggests potential chemotherapy targets. Clin. Epigenet. 12, 93 (2020). [DOI] [PMC free article] [PubMed] [Google Scholar]
Associated Data
This section collects any data citations, data availability statements, or supplementary materials included in this article.