

Abstract
Approximately 20–68% of traumatic brain injury (TBI) patients exhibit trauma-associated olfactory deficits (OD) which can compromise not only the quality of life but also cognitive and neuropsychiatric functions. However, few studies to date have examined the impact of experimental TBI on OD. The present study examined inflammation and neuronal dysfunction in the olfactory bulb (OB) and the underlying mechanisms associated with OD in male mice using a controlled cortical impact (CCI) model. TBI caused a rapid inflammatory response in the OB as early as 24 h post-injury, including elevated mRNA levels of proinflammatory cytokines, increased numbers of microglia and infiltrating myeloid cells, and increased IL1β and IL6 production in these cells. These changes were sustained for up to 90 days after TBI. Moreover, we observed significant upregulation of the voltage-gated proton channel Hv1 and NOX2 expression levels, which were predominantly localized in microglia/macrophages and accompanied by increased reactive oxygen species production. In vivo OB neuronal firing activities showed early neuronal hyperexcitation and later hypo-neuronal activity in both glomerular layer and mitral cell layer after TBI, which were improved in the absence of Hv1. In a battery of olfactory behavioral tests, WT/TBI mice displayed significant OD. In contrast, neither Hv1 KO/TBI nor NOX2 KO/TBI mice showed robust OD. Finally, seven days of intranasal delivery of a NOX2 inhibitor (NOX2ds-tat) ameliorated post-traumatic OD. Collectively, these findings highlight the importance of OB neuronal networks and its role in TBI-mediated OD. Thus, targeting Hv1/NOX2 may be a potential intervention for improving post-traumatic anosmia.
Keywords: Neuroinflammation, olfactory dysfunction, traumatic brain injury, Hv1, NOX2
1. Introduction
Millions of traumatic brain injury (TBI) survivors live for decades after the initial injury with varying degrees of neurological impairment, including long-term cognitive deficits and neuropsychiatric complications. However, neuroanatomical and kinetic factors render the peripheral and central olfactory structures highly vulnerable to TBI-related damage. Hence, the reduced or distorted ability to smell defined as olfactory dysfunction (OD) is often reported in TBI patients (Bratt et al., 2018; Howell et al., 2018; Schofield et al., 2014; Sumner, 1964; Tai et al., 2022). Although common, post-traumatic OD often goes undetected because life-threatening neurological and orthopedic injuries are given top priority in the initial stabilization and management of trauma patients. Despite the fact that significance of olfactory disturbance is often discounted as a public health problem, TBI patients with OD are at increased risk for depression (Logan et al., 2021) with impaired quality of life (Howell et al., 2018) and moreover, an increased incidence of both Alzheimer’s disease (AD) and non-AD forms of dementia (Lee et al., 2013; Nordstrom et al., 2014; Wang et al., 2012). Although post-traumatic anosmia has been documented in the medical literature for more than a century, surprisingly, only few studies (Marin et al., 2022; Powell et al., 2018, 2019; Siopi et al., 2012; Yoon et al., 2022) to date have examined effects of experimental TBI on olfactory function; moreover, neither the cause nor the related molecular mechanisms are understood.
Numerous experimental observations (Kumar and Loane, 2012; Ritzel et al., 2018; Witcher et al., 2015) including ours (Ritzel et al., 2021; Ritzel et al., 2020) indicate that TBI induces widespread alterations of central and peripheral immune responses. As the major cellular component of the innate immune system in the central nervous system (CNS), microglia can be dysregulated and produce high levels of pro-inflammatory and cytotoxic mediators which can injure cells and hinder brain repair (Faden et al., 2016; Loane and Kumar, 2016). After TBI, the brain is also invaded by blood-borne leukocytes. Both microglia and infiltrating peripheral monocytes contribute to pathobiology after TBI. The olfactory bulb (OB) contains a high number of microglia, which allows investigation of the role of microglia in TBI-mediated OD (Sato, 2015). Increased glial reactivity and phagocytosis are observed in the OB after mild fluid percussion injury (Powell et al., 2018). However, neither the underlying mechanisms nor treatment remain clear. The nicotinamide adenine dinucleotide phosphate oxidase 2 (NOX2) is major producer of reactive oxygen species (ROS) that is upregulated in activated microglia/macrophages after TBI (Kumar et al., 2016a). The voltage-gated proton channel Hv1 is a newly discovered ion channel that is primarily expressed in the immune system (Ramsey et al., 2006; Sasaki et al., 2006). We recently reported (Li et al., 2021; Murugan et al., 2020; Ritzel et al., 2021) that Hv1 interacts with NOX2 in regulating ROS and cytosolic pH, which are the key mechanisms mediating neuroinflammation and neurodegeneration after neurotrauma. Whether neuroinflammation is prominent in the OB and NOX2/Hv1 is involved in the pathogenesis of OD after TBI remains unknown.
Microglia participate in the arrangement of the appropriate neural circuits during development of the OB and systemically microglial depletion reduces OB neuroblasts migrating from the subventricular zone in rodents (Ashwell, 1991; Caggiano and Brunjes, 1993; Fiske and Brunjes, 2000; Ribeiro Xavier et al., 2015), indicating appropriate microglial activation might be essential for the maintenance of normal olfaction. However, under pathological conditions, OB neural damage is often accompanied by neuroinflammation in response to pathologic stimuli (Seo et al., 2018). Although activated microglia can aggravate OD by mediating neuronal death in the OB of neurodegenerative disorders (Doorn et al., 2014; Seo et al., 2016; Seo et al., 2014), the crosstalk between microglia and neurons to elucidate the mechanisms underlying extensive microgliosis in the TBI-affected OB remain exclusive.
Here we utilize a controlled cortical impact (CCI) mouse model to examine microglia/macrophage-mediated inflammation and neuronal dysfunction in the OB. Genetic and pharmacological manipulation of Hv1/NOX2 signaling was applied to investigate the underlying mechanisms associated with OD after TBI. Importantly, we demonstrate that TBI causes activation of microglia, infiltration of myeloid cells, and upregulation of Hv1/NOX2 signaling in the OB, leading to disruption of the OB neuronal networks. We also demonstrate that TBI-induced early hypo-neuronal activity in the glomerular layer (GL) but neuronal hyperexcitation and later hypo-neuronal activity in the mitral cell layer (MCL) of the OB are improved in the absence of Hv1. TBI reduced synaptic density in the OB GL which is improved in the Hv1 KO mice at 4w post-injury. After TBI, we observed OD up to 6 months post-injury, evidenced by poorer performance in the tests of buried food, two-bottle odor discrimination, and odor memory. Inhibition of Hv1/NOX2 signaling improves brain injury-mediated olfactory dysfunction, suggesting activation of Hv1/NOX2 pathway as a potential therapeutic intervention for treatment of post-traumatic OD.
2. Materials and Methods
2.1. Mouse controlled cortical impact model and drug delivery
All animal experiments and surgical procedures were performed according to protocols approved by the Institutional Animal Care and Use Committee (IACUC) from both the University of Maryland School of Medicine and Howard University College of Medicine. Young adult male C57BL/6 mice of 10–12 weeks old were purchased from The Jackson Laboratory. Hv1 knock out (KO) mice (Li et al., 2021; Ritzel et al., 2021) breeders were obtained from Dr. Long-Jun Wu’s laboratory at Mayo Clinic and NOX2 KO mice breeders were received from The Jackson Laboratory (B6.129S-Cybbtm1Din/J, stock 002365). All transgenic mice were bred at the University of Maryland School of Medicine and housed on a 12 hours light/dark cycle with food and water provided for them ad libitum. Controlled cortical impact was performed with a TBI-0310 impactor (Precision Systems & Instrumentation, VA). Briefly, mice were anesthetized with isoflurane and a 10-mm midline incision was made over the skull, followed by a 4-mm craniotomy was made in the center of the left parietal bone of mice (Fig. S1). A mild-moderate injury was induced by a 3.5-mm diameter tip with impact velocity of 3.5 m/s, a deformation depth of 1.1 mm, and a dune time of 100 ms (Ritzel et al., 2020; Ritzel et al., 2022). Sham mice went through the same procedures without craniotomy and impaction.
Intranasal administration of NOX2 inhibitor:
NOX2ds-tat, a potent selective NOX2 inhibitor, was purchased from Anaspec peptide (AnaSpec Inc. Fremont, CA) and reconstituted in sterile saline. C57BL/6 male mice subjected to CCI received NOX2 ds-tat 1.4 mg/kg/day or Vehicle (Veh) control (scrambled ds-tat), beginning at 3 h post-injury and twice daily for 7 days through bilateral intranasal delivery (Hanson et al., 2013). This dose was based on reported therapeutic effects in mice (Abais et al., 2013; Kumar et al., 2016b; Sabirzhanov et al., 2019) and our pilot data. After TBI, mice were assigned to a treatment group according to a randomized block experimental design.
The surgical procedures and the behavioral tests were performed by the same investigators blinded to genotypes or drug treatments. All mice were assigned to the groups according to a randomized block experimental design. The number of mice in each study was indicated in the figure legends.
2.2. RNA extraction and quantitative PCR
After euthanasia and perfusion with 50 mL ice cold saline, total RNA was extracted from the OB of sham and CCI mice with a miRNeasy isolation kit (Cat# 217084, Qiagen) and complementary DNA (cDNA) was synthesized by a Verso cDNA RT kit (Cat# AB1453B, Thermo Scientific). Real-time qPCR for target mRNAs was performed using TaqMan gene expression assays for TNFα, Mm00443258_m1; IL1β, Mm00434228_m1; IL6, Mm00446190_m1; MIP2 (CXCL2, Mm00436450_m1); Arginase-1 (Arg1), Mm00475988_m1; IL10, Mm00439614_m1; Mb21d1 (cGAS, Mm01147496_m1), C1qc (Mm00776126_m1), Lcn2 (Mm01324470_m1), Cybb (NOX2), Mm01287743_m1; Hvcn1 (Hv1), Mm01199507_m1; GAPDH, Mm99999915_g1 (Applied Biosystems, Carlsbad, CA] on an QuantStudio™ 5 Real-Time PCR System (Applied Biosystems). Gene expression was normalized by GAPDH and compared to the control sample to determine relative expression values by the 2−ΔΔCt method (Sabirzhanov et al., 2019).
2.3. Immunohistochemistry (IHC) and quantification
At the designed time point, mice were perfused intracardially with normal saline followed by 4% paraformaldehyde. The brain containing the OB was extracted and embedded in Tissue-Tek OCT compound (Sakura). OB coronal sections of 20μm thickness were placed on Superfrost Plus slides (ThermoFisher) for IHC staining followed procedures described previously (Li et al., 2022; Sabirzhanov et al., 2019). The following primary and secondary antibodies were used: rabbit anti-Ionized calcium binding adaptor molecule 1 (Iba-1, 1:1000, Cat# 019–19741, Wako Chemicals), rabbit anti-Iba1 (1:200, Cat# 17198S, Cell Signaling), goat anti-Iba1 (1:200, Cat# NB100–1028, Novus Biologicals), rat anti-CD68 (1:1000, Cat# ab53444, Abcam), rat anti-CD68 (1:1000, Cat# 137002, BioLegend), mouse anti-CD16/32 (1:1000, Cat# 553142, Pharmigen), rat anti-CD16/32 (1:100, Cat# 553142, BD Bioscience), rat anti-F4/80 (1:600, Cat# ab6640, Abcam), rat anti-F4/80 (1:100, Cat# 123116, BioLegend), mouse anti-NOX2 (gp91, 1:1000, Cat# 611414, BD), mouse anti-8-hydroxyguanosine (8-OHG, 1:1000, Cat# ab62623, Abcam), rabbit 8-OHG (1:300, Cat# bs-1278R, Bioss), rabbit anti-Hv1 (1:500, Cat# anc-001, Alomone), rabbit anti-Tmem119 (1:300, Cat# 90840S, Cell Signaling), rabbit anti-Bassoon (1:400, Cat# 6897S, Cell Signaling), Alexa FluorTM 488 goat anti-mouse IgG (1:800, Cat# A28175, Invitrogen), Alexa FluorTM 594 goat anti-rat IgG (1:800, Cat# A11007, Invitrogen), Alexa FluorTM 546 goat anti-rabbit IgG (1:800, Cat# A11035, Invitrogen), and Alexa FluorTM 647 goat anti-rat IgG (1:800, Cat# A21247, Invitrogen), Alexa FluorTM 488 donkey anti-rat IgG (1:800, Cat# A21208, Invitrogen), Alexa FluorTM 594 donkey anti-goat IgG (1:800, Cat# A11058, Invitrogen), Alexa FluorTM 594 donkey anti-rabbit IgG (1:800, Cat# A21207, Invitrogen), and Alexa FluorTM 647 donkey anti-rabbit IgG (1:800, Cat# A31573, Invitrogen). After counterstaining with 4’,6-diamidino-2-phenylinodole (DAPI, Cat# D9542, Sigma-Aldrich), sections were mounted onto glass slides with coverslips using an anti-fade Hydromount solution (National Diagnostics). All images were captured using a fluorescent Nikon Ti-E inverted microscope, at 20X (CFI Plan APO VC 20X NA 0.75 WD 1 mm) magnification, with n = 10–15 images from at least 5 sections per mouse. The number of positive cells in the GL of the OB in each image was manually quantified. The average values of all sections were taken into next statistical analysis. The whole OB was imaged by tile-scan method under identical parameters across all groups. The glomerular layer (GL) was recognized by DAPI signal and measured in Fiji ImageJ to calculate its area percentage for Sham or 1dTBI group (n=6 sections per mouse). In the same way, the average fluorescence intensity of Bassoon staining in total GL at 7d or 4w post-TBI sections was measured in Fiji ImageJ. Meanwhile, a 100 μm × 100 μm area was randomly selected and sampled in the medial GL (n=6 per section), and further analyzed in Fiji ImageJ for synaptic puncta counts. All IHC staining experiments were performed with appropriate positive control tissue, as well as primary/secondary only negative controls.
2.4. Flow cytometry and ex vivo functional assays
Mice were perfused with 40 mL of cold saline in a staggered order between the groups. OB were dissected and placed in complete Roswell Park Memorial Institute (RPMI) 1640 (Cat# 22400105, Invitrogen) medium. The elapsed time between the first and last mouse was approximately 60–90 minutes. Tissue was then mechanically and enzymatically digested in collagenase/dispase (1 mg/ml; Cat# 10269638001, Roche Diagnostics), papain (5 U/ml; Cat# LS003119, Worthington Biochemical), 0.5 M EDTA (1:1000; Cat# 15575020, Invitrogen), and DNAse I (10 mg/ml; Cat# 10104159001, Roche Diagnostics) for 1 h at 37°C on a shaking incubator (200 rpm). The isolated cells followed procedures described previously (Ritzel et al., 2020; Ritzel et al., 2022) stained for the following surface antigens: CD45-eF450 (1:100, Cat# 48-0451-82, eBioscience), CD11b-APC-eF780 (1:100, Cat# 47-0112-82, eBioscience), F4/80-BV421 (1:100, Cat# 565411, BD), and Zombie Aqua fixable viability dye (Cat# 423102, Biolegend). Intracellular staining included NOX2-AF647 (1:500, Cat# bs-3889R-A647, Bioss Antibodies), IL1β-eF450 (1:250, Cat# 48-7114-82, Invitrogen), IL1β-PerCPeF710 (1:50, Cat# 420601, Biolegend), TNF-PECy7 (1:50, Cat# 46-7114-82, Biolegend), and IL6-PE (1:100, Cat# 504504, Biolegend). Cellular ROS was measured using the cell-permeant fluorescent probe H2DCFDA (DCF, 5 μM; ThermoFisher Scientific).
Data from 24h after TBI were acquired on Cytek® Aurora spectrum cytometer (Cytek Bioscience, MD) and analyzed with FCS Express 7 (De Novo Software). Data from 90 days after TBI were acquired on a BD LSR Fortessa cytometer using FACSDiva 6.0 (BD Biosciences) and analyzed using FlowJo (Treestar Inc.). At least 5–10 million events were collected for each sample. Countbright™ Absolute Counting Beads (Invitrogen) were used to estimate cell counts per the manufacturer’s instructions. Leukocytes were first gated using a splenocyte reference (SSC-A vs. FSC-A). Singlets were gated (FSC-H vs. FSC-W), and live cells were gated based on Zombie Aqua exclusion (SSC-A vs. Zombie Aqua-Bv510). Resident microglia were identified as the CD45intCD11b+ population, whereas peripheral leukocytes were identified as CD45hiCD11b+ myeloid cells. Cell type-matched fluorescence minus one (FMO) controls were used to determine the positivity of each antibody and indicator dye (Ritzel et al., 2021).
2.5. In vivo electrophysiological recording of spontaneous neuronal firing and network activities
Recordings were performed in animals anesthetized by i.p. injecting a mixture of ketamine (90–100 mg/kg body weight) and xylazine (9–10 mg/kg body weight). Preparation of anesthesia and surgery for recordings was conducted as previously described (Liu et al., 2016). To extracellularly measure neuronal excitability and network activities, a neural probe with 16 linearly aligned and circular detection channels (25 μm diameter and 50 μm inter-channel distance) was inserted into the glomerular layer or mitral cell layer of medial side the olfactory bulb ipsilateral to the TBI through a craniotomy on the dorsal skull with the following coordinates: AP 4.3 mm from Bregma, ML 0.2 mm for GL recording and 0.4 mm for MCL recording; DV 1.5–1.8 mm from the dorsal OB surface to the probe tip. The probe tip was perpendicularly advanced into the OB dorsal surface with an initial depth at 1.5 mm followed by further fine advancement to maximize recorded neuronal firing activities and optimize the neuronal firing signals to noise ratio with a final DV depth around 1.7–1.8 mm. The spontaneous firing activity of neurons was recorded in one or two positions for MCL only or both MCL and GL in each animal, respectively. Electrophysiological signals were detected by the neural probe and passed through a digital headstage to a 16-channel amplifier (Plexon DigiAmp, Plexon, Dallas, TX, USA), where they were sampled at 1 kHz and bandpass filtered at 300–5,000 Hz for spikes and at 0.1–300 Hz for local field potential (LFP) before being sampled at 40 kHz by a Plexon Omniplex recording system (Plexon, Dallas, TX). Spikes were sorted from the raw data with Offline Sorter V4 software (Plexon) or MATLAB with customized scripts. The separation of different units was performed by principal component analysis based on criteria of waveform parameters and multi-dimensional clusters.
Both spike and LFP data were further analyzed with NeuroExplorer V5.204 (Nex Technologies) and graphed with Origin 2020. Instant spike frequency (ISF) calculated from inter-spike interval of individual units was utilized to assess neuronal excitability. At the population level, an average of ISF across multiple units was used to present each recording. A cumulative probability of ISF averaged across multiple animals in each group was applied to compare neuronal excitability among multiple groups.
Power spectrum density of LFP signals ranging from 0.1 to 200 Hz, which covers different frequency bands including theta (2–12 Hz), beta (15–35 Hz), and gamma (low gamma, 30–100 Hz), was measured to reflect oscillatory activities that are derived from interactions among excitatory and inhibitory neurons thus reflect network operation.
2.6. Buried food test
To increase animal’s motivation of food search in the test, mice were individually housed and given water ad libitum but deprived of food for 24 h. On the night before test day, a piece of mini cookie was placed in each subject’s cage for odor familiarization and consumption was checked next morning to determine whether it was palatable for the mice. The subject mouse was placed in a clean test cage (46 cm L × 23.5 cm W × 20 cm H, with 3 cm of clean bedding in depth) for 10 min of acclimation, then returned to its home cage. A piece of mini cookie (~ 1g with a uniform size) was buried beneath 2–3 cm of bedding in a random corner of the test cage. After smoothing out the bedding surface, the mouse was reintroduced to the test cage. The latency for the mouse to find and start consuming the buried cookie was recorded. If the subject failed to find the buried cookie after 15 min, the test was stopped. This test assesses how fast the animal finds buried (invisible) food by using odor (smell) as a search cue (Seo et al., 2016; Seo et al., 2014).
2.7. Two-bottle discrimination test
To examine the animal’s detection threshold for the odor isovaleric acid (IVA), a widely employed odor used in olfactory behavioral testing, mice were individually housed and given food ad libitum but with water for 1 h in the middle of a total of 23 h water deprivation (Tordoff and Bachmanov, 2002). Before the test, mouse was exposed to the monomolecular odorant IVA (10−3 M) for 10 min and then returned to a clean cage. Two hours later, each mouse was provided two bottles, one with the saccharin phthalic acid solution as vehicle control and the another with the same solution plus IVA. Tests were continued for 4 different IVA concentrations in 10-folds units every 2 h from 10−3 to 10−6 M in random order. The positions of the odor versus no-odor bottles in each cage were reversed every test. The number of mice in each minute to drink IVA water and the latency to drink IVA water was recorded.
2.8. Odor memory test
To determine olfactory discrimination learning and memory in mice, the animals were single housed for overnight. A clean, dry cotton-tipped wooden applicator (6-inch length) was inserted through a hole in the animal’s cage lid to allow it to familiarize itself with the applicator for 30 min. The applicator was changed each mouse. The cinnamon powder (100 ng/ml) was dissolved in water in clean vials and kept tightly capped when not in use. In the first trial (T1), the subject mouse was exposed to the novel odor stimuli. After dipping the cotton tip part of the applicator in the odor stimuli solution for 2 seconds, the applicator was inserted through the cage’s lid with a depth of about 2.5 cm. The cumulative time spent sniffing the tip during the 5 min trial (only when an animal is oriented towards the cotton tip with its nose 2 cm or closer to the tip) was recorded. At the end of the trial, the applicator was removed. After 60 min of resting, the second trial (T2) was performed in the same cage. After recording T2 with the same setting of T1, the relative ratio of sniffing time of trial-2 to trial-1 ((T2/T1) X 100) was calculated. A significant decrease in the relative ratio of sniffing time indicates that mice had spent less time exploring the odor on the second trial, and was able to recognize and memorize the odor stimuli that had been previously presented in the first trial (Tillerson et al., 2006).
2.9. Y-maze test
To evaluate hippocampus-dependent spatial working memory, Y-maze spontaneous alternation test was performed as previously reported (Ritzel et al., 2021). The percentage of alternation is calculated when the mouse entered three different arms in consecutive order following equation: total alternations ×100/(total arm entries − 2). If a mouse scored significantly above 50% alternations (the chance level for choosing the unfamiliar arm), this is indicative of intact working memory.
2.10. Statistical analyses
Data from each experiment are presented as mean ± SEM, and individual data points are shown for each graph. Statistical analysis was performed using the GraphPad Prism Software v. 6.0 (GraphPad Software, Inc., La Jolla, CA). Comparison between two groups was analyzed using Mann Whitney test, or Two-tailed unpaired t-test. Group effects were determined by two-way ANOVA analysis with Tukey post hoc correction for multiple comparisons. Statistic comparison of spike data presented as cumulative probability of frequencies between two different animal groups was conducted with the nonparametric Two Sample Kolmogorov-Smirnov (K-S) test in Origin 2020. Behavioral data were also analyzed by two-way repeated measures ANOVA and Bonferroni’s test or using Tukey’s multiple comparison test to determine differences between sham and TBI. p ≤ 0.05 was considered statistically significant.
3. Results
3.1. TBI induces sustained microglial/macrophage activation in the OB
To examine whether the CCI model of experimental TBI could cause inflammatory changes in the site remote to impact area, OB were dissected for qPCR, IHC, and flow cytometry analysis. At 1 day and 3 days post-injury, total RNA was extracted from the OB and qPCR was performed to examine both pro- and anti-inflammatory marker mRNA levels. We found that several pro-inflammatory cytokines (TNFα, IL6, MIP2, and IL1β) were significantly increased at 24 h (p<0.05, p<0.0001, n=10–12 for sham, n=12 for 1d TBI), remaining at the high levels of IL6, MIP2, and IL1β for the 3 days (p<0.01, p<0.001, n=11–12 for sham, n=9–12 for 3d TBI) after injury (Fig. 1A–D). The anti-inflammatory markers Arg1 and IL10 were also significantly increased during this time. Furthermore, several other pro-inflammatory markers including cGAS, C1qc, and Lcn2 were found significant elevated at 1d post-injury, remaining at the high level of C1qc gene for the 3 days (Fig. S2). Next, we performed immunofluorescence staining of the OB sections from 1 d post-injury for assessment of microglial activation and infiltrating myeloid cells. We found increased numbers of microglia and macrophages (positive cells of Iba-1, CD16/32, and F4/80) predominantly in the glomerular layer (GL), compared to sham OB (p<0.001, n=4/group, Fig. 1E–F). In addition, we used the marker cluster of differentiation 68 (CD68) to further identified activated microglia and macrophages (Fig. S3). Quantified CD68+ cells showed robust elevation in the OB GL from 1d TBI mice (p<0.01). As CD68 is a transmembrane glycoprotein protein expressed by microglia and other myeloid cells that indicates phagocytic activity (Chistiakov et al., 2017), increased CD68+ cells present in the OB suggest elevated phagocytic status of microglia/macrophages at 24h post-injury. To examine if GL size is changed due to brain injury, we quantified the ratio of GL layer to the whole OB. Fig S4 indicate that TBI at 1d post-injury does not change the size of GL layer of the OB.
Figure 1. TBI induces inflammatory changes and activates microglia/macrophages in the olfactory bulb (OB).

(A-D) Quantitative real-time PCR revealed significant higher levels of pro-inflammatory [TNFα, IL6, CXCL2 (MIP2), IL1β] and anti-inflammatory (Arg1, IL10) cytokines in the OB at 1d (A-B) and 3d (C-D) after TBI compared to Sham mice. N=10–12 (A-B) and 9–12 mice (C-D). Mann Whitney test. (E-F) Representative IHC images of Iba-1, CD16/32, F4/80, and CD68 staining (red) and quantification of the positive cells in the glomerular layer (GL) of the OB at 1d after TBI. N=4 mice/group. Two-tailed unpaired t-test. Scale bar=100 μm. *p<0.05, **p<0.01, ***p<0.001, ****p<0.0001 vs. sham. MCL: mitral cells layer.
To understand the inflammatory changes at the cellular level, we used flow cytometry as a complementary technique to assess inflammation in resident microglia (CD45intCD11b+) and infiltrating myeloid cells (CD45hiCD11b+) of the OB. At 24 h post-injury, we found significantly increased microglia and myeloid cells (p<0.01, n=6/group) as well as F4/80+/CD11b+ macrophages (p<0.05), compared to sham mice (Fig. 2A–B). Increased IL1β and IL6 cytokines production in those cells was also observed in the OB isolated from 1d TBI group (p<0.01 or 0.001, n=6/group, Fig. 2C–F). To determine whether activated microglia sustained chronically, flow cytometry was performed in the OB from 90 days post-injury. Although reduced counts of CD45intCD11b+ microglia (p<0.05, n=4 for sham, n=7 for TBI) were observed in chronic injury mice, there was no difference in infiltrating myeloid cells between two groups (Fig. S5A–C). Surprisingly, we observed significantly increased granularity, IL6+, and TNF+ microglia in OB from 90 days post-injury mice compared to sham group (p<0.05 or 0.001, n=4 for sham, n=7 for TBI, Fig. 2G–I). The mean fluorescence intensity of DCF+ microglia was also enhanced in the injured samples (p=0.0971, Fig. S5D–E), suggesting increased ROS production.
Figure 2. TBI causes microglial activation and macrophages infiltration in the OB.

Young adult male C57BL/6 mice were subjected to TBI and flow cytometry was used to examine OB microglia and macrophages at 1d or 90d post-injury. (A) Representative contour plots (A, left panels) and quantification (A, right panels) of CD45intCD11b+ microglia and CD45hiCD11b+ monocytes in OB at 1d after TBI. (B) Representative density plots and quantification of F4/80+/CD11b+ cells in the OB. (C-F) Representative histograms and quantification of IL1β and IL6 in microglia (C-D) and myeloid cells (E-F). (G-I) Representative histograms, dot plots, and quantification of granularity [side scatter (SSC), G], IL-6 (H), and TNF (I) in microglia in OB at 90d after TBI. N=6 (A-F) and 4–7 (G-I) mice/group. Two-tailed unpaired t-test. *p<0.05, **p<0.01, ***p<0.001 vs. sham. FMO: fluorescence minus one.
Together, these data show that cortical contusion TBI causes a rapid microglial activation and infiltration of myeloid cells in the OB as early as 24 h post-injury, sustained up to 90 days post-injury, demonstrating TBI-mediated pro-inflammatory changes in the OB.
3.2. NOX2 and Hv1 signaling are upregulated in the microglia/macrophages of OB after TBI
We have recently reported robust increases of gene and protein expression of NOX2 and Hv1 in the injured site after TBI, which were predominantly upregulated by activated microglia/macrophages (Ritzel et al., 2021). Given the close regulation between NOX2/Hv1 and ROS production after brain injury and the link between TBI-mediated OB inflammation and primary expression of NOX2/Hv1 in the microglia/macrophages, we speculate that these molecules could play an important role in modulating OB inflammation after brain injury. To test this hypothesis, we first performed flow cytometry and IHC to examine whether NOX2/Hv1 are dysregulated in the OB following TBI. At 24 h post-injury, flow cytometry analysis showed significantly increased counts of NOX2+ microglia and myeloid cells in OB (p<0.01, n=6/group, Fig. 3A–B). Immunofluorescence assay to co-stain OB sections with antibodies against NOX2 showed significantly increased NOX2+ cells, highly co-localized with Iba-1+ microglia/macrophages, predominantly in the GL of the OB (p<0.001, n=4/group, Fig. 3C–D). Further IHC analysis revealed that NOX2+ cells were also highly co-localized with CD68+, CD16/32+, F4/80+ microglia/macrophages (p<0.01 or 0.001, n=4/group, Fig. 3E–F, Fig. S6A–C). Moreover, NOX2+ cells highly expressed 8-OHG (p<0.01, n=4/group, Fig. 3G–H, Fig. S6D), suggesting increased ROS production in those cells.
Figure 3. TBI upregulates NOX2 expression by activated microglia and monocytes in the OB at 1d post-injury.

(A-B) Representative histograms and quantification of NOX2 in CD45intCD11b+ microglia and CD45hiCD11b+ monocytes in the OB. N=6 mice/group. Two-tailed unpaired t-test. (C-D) Representative IHC images of NOX2 (green) and Iba-1 (red) and quantification of the positive cells in the glomerular layer (GL) of the OB. (E-H) Representative IHC images and quantification of NOX2/CD68, NOX2/CD16/32, NOX2/F4/80, NOX2/8-OHG positive cells in the GL of the OB. **p<0.01, ***p<0.001 vs. sham. N=4 mice/group. Two-tailed unpaired t-test. Scale bar=100 μm.
It is known that the Hv1 proton channel is primarily expressed in immune cells including microglia and macrophages (He et al., 2021). We found that Hv1+ cells were highly co-localized with NOX2+ microglia/macrophages at 24 h post-injury, predominantly in the GL, compared to sham OB (p<0.05, n=4/group, Fig. 4A–B). At 3 days post-injury when microglia/macrophages activation reached the peak, qPCR analysis showed significantly increased mRNA levels of hvcn1 and cybb in the OB compared to sham mice (p<0.05 or 0.001, n=12 for sham, n=9 for 3d TBI, Fig. 4C). Reduction of NOX2 expression has been reported in the absence of Hv1 following CNS injury (Li et al., 2021; Murugan et al., 2020; Ritzel et al., 2021), suggesting that NOX2 might be a downstream target of Hv1 signaling. To examine Hv1 expression in the absence of NOX2, qPCR analysis was performed in injured cortex from NOX2 KO mice at 3 days post-injury. We found increased mRNA levels of hvcn1 in both NOX2 KO and WT mice, confirming Hv1 as an upstream of regulator of NOX2 signaling (p<0.001, n=9/group, Fig. 4D). Together, these data provide evidence that Hv1/NOX2-mediated microglia/macrophages activation contributes to OB inflammation following TBI.
Figure 4. NOX2 and Hv1 signaling are upregulated in the OB after acute brain injury.

(A-B) Representative IHC images of Hv1 (red) and NOX2 (green) and quantification of the positive cells in the glomerular layer (GL) of the OB at 24h post-injury. N = 4 mice/group. *p<0.05, vs. sham. Two-tailed unpaired t-test. Scale bar= 100 μm. (C) qPCR analysis showed significantly increased mRNA levels of hvcn1 (Hv1) and cybb (NOX2) in the OB at 3d after TBI. N=9–12 mice/group. *p<0.05, ***p<0.001 vs. sham. Two-tailed unpaired t-test. (D) qPCR analysis showed robust increased mRNA levels of hvcn1 in both NOX2 knock out (KO) and WT mice in the injured cortex at 3d after TBI. N=9 mice/group. ***p<0.001 vs. sham. Two-way ANOVA followed by Tukey’s multiple comparison.
3.3. TBI alters neuronal excitability and network function in the OB which is improved in the absence of Hv1
Emerging evidence suggests that pathological activation of microglia dysregulates neural network and synaptic functions in the OB (Lazarini et al., 2012; Sellgren et al., 2019; Testa et al., 2019). To test this, we performed in vivo electrophysiological recordings with the powerful linear 16-channel probe to determine neuronal excitability and network function in the OB at both early and chronic periods after brain injury. To examine whether Hv1-mediated inflammation after TBI disrupts neuronal networks in the OB, we subjected Hv1 KO mice and WT littermate controls to CCI and measured neuronal firing activities and local field potential (LFP) from the OB glomerular layer (GL) and mitral cell layer (MCL) ipsilateral to the TBI injury side in anesthetized mice.
We first assessed the neuronal excitability and network function by inserting the 16-channel probe in the OB GL of anesthetized mice at 7 d post-injury (Fig. 5A). In WT mice, TBI group animals showed fewer neuronal spiking activities in the GL presented as reduced instant inter-spike frequencies (IISF) compared to Sham group mice (Fig. 5B top panels, p<0.05, n=5/group, Fig. 5C). However, this effect was reversed in the Hv1 KO mice, in which TBI group exhibited increased neuronal firing activities in the GL compared to Sham group (Fig. 5B bottom panels, p<0.01, n=4–5/group, Fig. 5D). No significant difference between the Sham/WT and Sham/Hv1 KO groups (n=4–5/group, Fig. 5E) suggests the Hv1-expressing microglia do not contribute to regulation of neuronal excitability in the GL under normal condition. However, the robust difference between TBI/WT and TBI/Hv1 KO groups (p<0.001, n=5/group, Fig. 5F) in addition to the opposite effects of TBI on WT and Hv1 KO mice supports an important role of the Hv1-expressing microglia in the TBI-reduced neuronal excitability in the GL at this time point of post-injury. These effects are also consistent with preceding findings of the TBI-enhanced microglia activities in the GL.
Figure 5. TBI effects on neuronal spiking activities in the OB glomerular layer of anesthetized mice at the 7 days post-injury.

(A) Schematic drawings showing the recording setup with a 16-channel inserted into the glomerular layer (GL) on the OB medial side. Top: lateral view; bottom: coronal section of the OB at the plane 4.3 mm away from the Bregma. (B) Typical traces comparing TBI effects of spike activities detected by 16 channels between Sham and 7d TBI groups in WT mice (top) or Hv1KO mice (bottom). (C-F) Line graphs presenting cumulative probability (cumul. prob.) vs instant inter-spike frequency to compare between Sham/WT and TBI/WT groups (C, N=5 mice/group), Sham/Hv1KO (N=4 mice) and TBI/Hv1KO (N=5 mice) groups (D), Sham/WT and Sham/Hv1KO groups (E), and TBI/WT and TBI/Hv1KO groups (F).
Neural oscillations of LFP, which reflect network synchrony and interactions among excitatory and inhibitory neurons at the population level, are widely present and play important roles in signal processing in the CNS with particular conspicuousness in the OB (Buzsaki and Draguhn, 2004; Kay et al., 2009; Traub et al., 2004). By analyzing LFP recorded from the same groups of animals (n=4–5/group), we found that TBI caused a reduction of oscillations measured as power of spectrum density (PSD) in the frequency ranges of 1–2 Hz and 22–30 Hz in both WT and Hv1 KO mice (Fig. 6A–C). However, TBI increased PSD at 3 Hz in Hv1 KO mice compared to its trending inhibitory effect in WT mice (Fig. 6B–C). Differences of oscillatory power in the ranges 1–4 Hz and 22–30 Hz in sham mice between WT and Hv1KO groups and in TBI mice between WT and Hv1KO group were observed (Fig. 6D–E), implying a role of microglia activation-induced neuroinflammation in modulating GL network operation in normal and TBI conditions. But consistent effects were detected in the frequency ranges of neither 4–21 Hz nor 30–200 Hz (Fig. S4).
Figure 6. TBI effects on LFP oscillatory activities at low-frequencies in the OB glomerular layer of anesthetized mice at the 7 days post-injury.

(A) Typical traces comparing TBI effects of LFP oscillatory activities detected by 16 channels between Sham and 7d TBI groups in WT mice (top) or Hv1KO mice (bottom). (B-E) Line graphs presenting cumulative probability (cumul. prob.) vs instant inter-spike frequency to compare between Sham/WT and TBI/WT groups (B, N=5 mice/group), Sham/Hv1KO (N=4 mice) and TBI/Hv1KO (N=5 mice) groups (C), Sham/WT and Sham/Hv1KO groups (D), and TBI/WT and TBI/Hv1KO groups (E). *p<0.05, **p<0.01, ***p<0.001, two-way ANOVA test.
The vast majority (>85%) of neurons in the GL are GABAergic inhibitory interneurons (Burton, 2017; Parrish-Aungst et al., 2007). Thus, our recordings in the GL most likely reflect excitability of local inhibitory interneurons and oscillatory activities of the related networks. Previous work (Burton, 2017; Liu et al., 2016; Parrish-Aungst et al., 2007; Shao et al., 2012) revealed powerful GL-derived inhibition of mitral cells (MCs), the main OB output neurons projecting to a variety of downstream brain centers, leading us to predict that TBI-induced and microglia activation-mediated inflammation alters MC excitability and related network operation. To test this idea, we recorded from the MC layer in the same groups of mice (Fig. 7A). Although IISF did not show significant difference between Sham/WT and TBI/WT groups (Fig. 7B top panels, n=5/group, Fig. 7C), TBI/Hv1 KO mice displayed reduced spike activities than Sham/Hv1 KO mice (Fig. 7B bottom panels, p<0.05, n=4–5/group, Fig. 7D), consistent with increased excitability of inhibitory interneurons in the GL. The difference of MCL neuronal spike activities between the Sham/WT and Sham/Hv1KO groups (p<0.001, n=4–5/group, Fig. 7E) as well as between TBI/WT and TBI/Hv1KO groups (p<0.001, n=5/group, Fig. 7F) suggests roles of Hv1-expressing microglia in regulating MC excitability in both normal and TBI conditions. At the network level, LFP analysis showed consistent difference only in the high-frequency band 30–200 Hz (Fig. 8, Fig. S7) but not in the low-frequency bands (Fig. S8) between Sham/WT and TBI/WT, Sham/Hv1KO and TBI/Hv1KO, Sham/WT and Sham/Hv1KO, TBI/WT and TBI/Hv1KO groups, indicating TBI effects on MC-related networks and roles of microglia. These results are consistent with previous findings that MC-granule cell interactions contribute to high-frequency oscillation in the OB (Burton and Urban, 2021; Fukunaga et al., 2014).
Figure 7. TBI effects on neuronal spiking activities in the mitral cell layer of anesthetized mice at the 7 days post-injury.

(A) Schematic drawings showing the recording setup with a 16-channel inserted into the mitral cell layer (MCL) on the OB medial side. Top: lateral view; bottom: coronal section of the OB at the plane 4.3 mm away from the Bregma. (B) Typical traces comparing TBI effects of spike activities detected by 16 channels between Sham and 7d TBI groups in WT mice (top) or Hv1KO mice (bottom). (C-F) Line graphs presenting cumulative probability (cumul. prob.) vs instant inter-spike frequency to compare between Sham/WT and TBI/WT groups (C, N=5 mice/group), Sham/Hv1KO (N=4 mice) and TBI/Hv1KO (N=5 mice) groups (D), Sham/WT and sham/Hv1KO groups (E), and TBI/WT and TBI/Hv1KO groups (F).
Figure 8. TBI effects on LFP oscillatory activities at high-frequencies in the OB mitral cell layer of anesthetized mice at the 7 days post-injury.

(A) Typical traces comparing TBI effects of LFP oscillatory activities detected by 16 channels between sham and 7d TBI groups in WT mice (top) or Hv1KO mice (bottom). (B-E) Line graphs presenting cumulative probability (cumul. prob.) vs instant inter-spike frequencies ranging 30–200 Hz to compare between Sham/WT and TBI/WT groups (B, N=5 mice/group), Sham/Hv1KO (N=4 mice) and TBI/Hv1KO (N=5 mice) groups (C), Sham/WT and Sham/Hv1KO groups (D), and TBI/WT and TBI/Hv1KO groups (E). *p<0.05, **p<0.01, ***p<0.001, two-way ANOVA test.
To examine the chronic effects of TBI and roles of microglia, we expanded our in vivo electrophysiological work to animals at 4 weeks post-TBI by focusing on only the MCL (Fig. 9A), which reflects OB output to downstream olfactory centers. In WT mice, TBI group showed reduced neuronal spike activities compared to the sham group (Fig. 9B top panels, p<0.05, n=5/group, Fig. 9C). In contrast, no difference was detected between Sham and TBI groups in Hv1 KO mice (n=4–5/group, Fig. 9D). There was a trending but not significant difference between Sham/WT and Sham/Hv1KO groups (n=5/group, Fig. 9E). Remarkably, this is consistent with the significant difference between the TBI/WT and TBI/Hv1KO groups (p<0.05, n=4–5/group, Fig. 9F), indicating active roles of Hv1-expressing microglia in mediating the TBI-reduced excitability of MCs. At the network level, we found that TBI induced opposite effects on LFP oscillatory activities in the MCL in the whole frequency range from 1 Hz to 200 Hz between WT and Hv1 KO mice (n=4–5/group, Fig. 10A–C and Fig. 11A–B), supporting the detrimental effects of TBI on operation of MC-related networks and active contribution of Hv1-expressing microglia. The consistent differences between WT and Hv1 KO groups in both Sham and TBI mice (Fig. 10D–E, Fig. 11E–F) suggest active contribution of Hv1-expressing microglia to modulation of MC-related network function in both normal and TBI conditions.
Figure 9. TBI effects on neuronal spiking activities in the mitral cell layer of anesthetized mice at the 4 weeks post-injury.
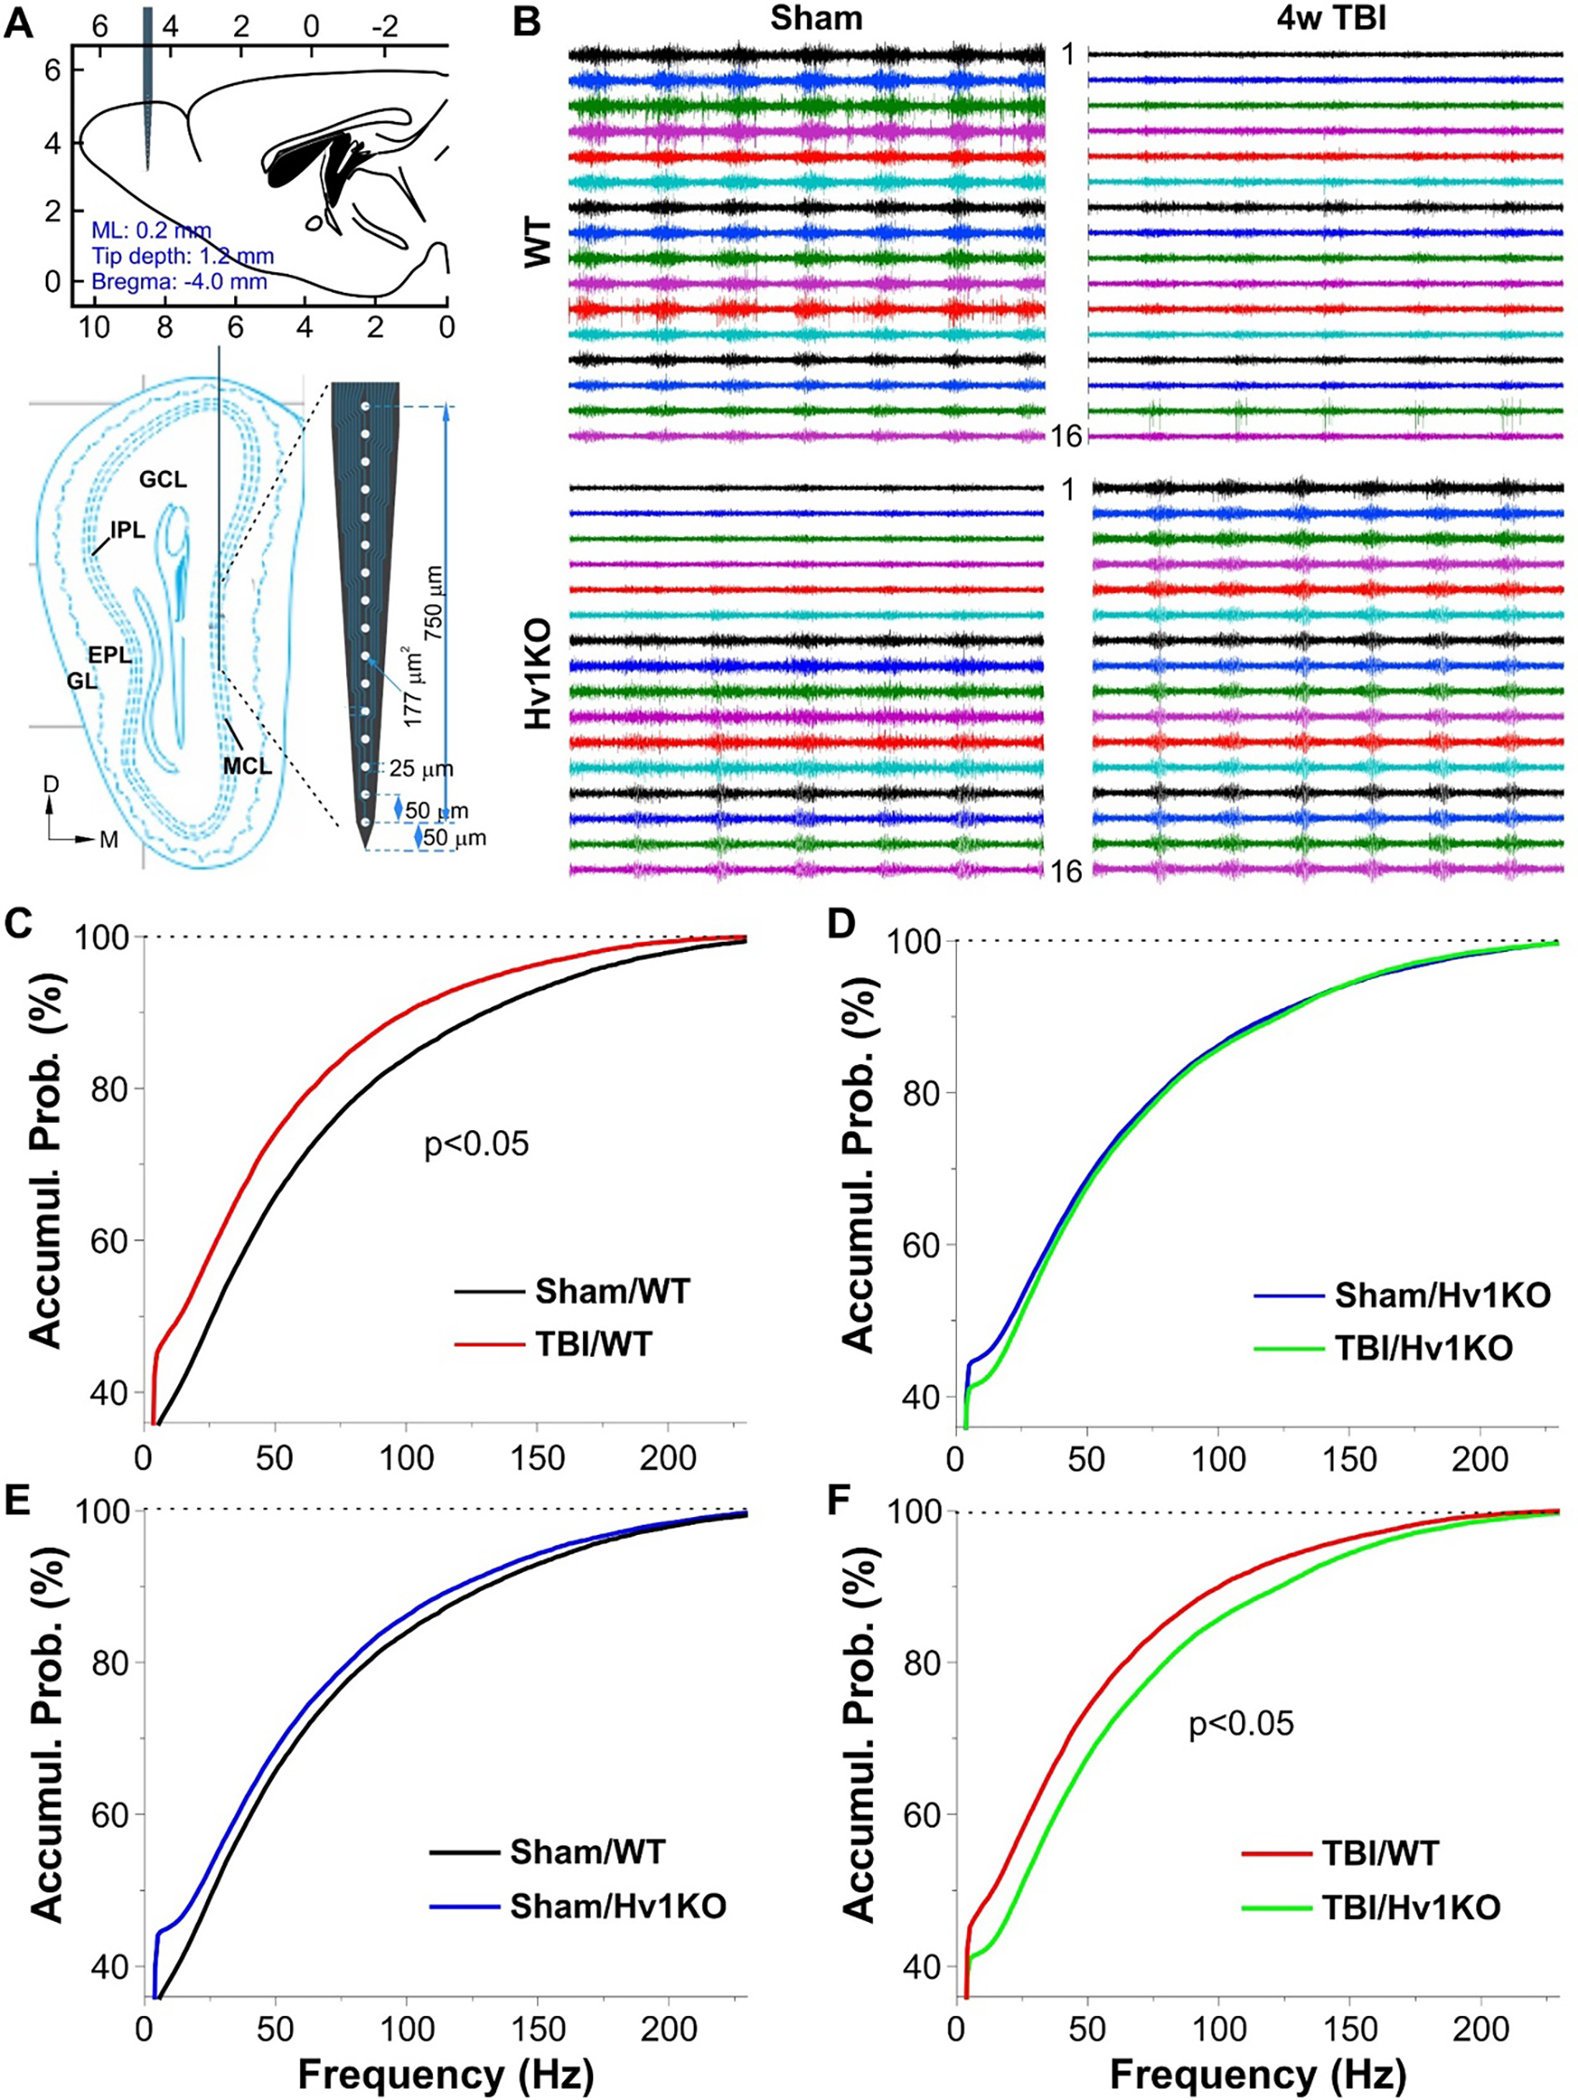
(A) Schematic drawings showing the recording setup with a 16-channel inserted into the mitral cell layer (MCL) on the OB medial side. Top: lateral view; bottom: coronal section of the OB at the plane 4.3 mm away from the Bregma. (B) Typical traces comparing TBI effects of spike activities detected by 16 channels between Sham and 4w TBI groups in WT mice (top) or Hv1KO mice (bottom). (C-F) Line graphs presenting cumulative probability (cumul. prob.) vs instant inter-spike frequency to compare between Sham/WT and TBI/WT groups (C, N=5 mice/group), Sham/Hv1KO (N=5 mice) and TBI/Hv1KO (N=4 mice) groups (D), Sham/WT and Sham/Hv1KO groups (E), and TBI/WT and TBI/Hv1KO groups (F).
Figure 10. TBI effects on LFP oscillatory activities at low-frequencies in the OB mitral cell layer of anesthetized mice at 4 weeks post-injury.

(A) Typical traces comparing TBI effects of LFP oscillatory activities detected by 16 channels between sham and TBI groups in WT mice (top) or Hv1KO mice (bottom). (B-E) Line graphs presenting cumulative probability (cumul. prob.) vs instant inter-spike frequencies ranging 0–12 Hz (top) to compare between Sham/WT and TBI/WT groups (B, N=5 mice/group), Sham/Hv1KO (N=5 mice) and TBI/Hv1KO (N=4 mice) groups (C), Sham/WT and Sham/Hv1KO groups (D), and TBI/WT and TBI/Hv1KO groups (E). Middle and bottom graphs are blown-up of the corresponding top ones to highlight the differences. *p<0.05, **p<0.01, ***p<0.001, two-way ANOVA test.
Figure 11. TBI effects on LFP oscillatory activities at high-frequencies in the OB mitral cell layer of anesthetized mice at 4 weeks post-injury.

(A-D) Line graphs presenting cumulative probability (cumul. prob.) vs instant inter-spike frequencies (12–30 Hz) to compare between Sham/WT and TBI/WT groups (A, N=5 mice/group), Sham/Hv1KO (N=5 mice) and TBI/Hv1KO (N=4 mice) groups (B), Sham/WT and sham/Hv1KO groups (C), and TBI/WT and TBI/Hv1KO groups (D). Middle and bottom graphs are blown-up of the corresponding top ones to highlight the differences. (E-H) Line graphs presenting cumulative probability (cumul. prob.) vs instant inter-spike frequencies (30–200 Hz) to compare between Sham/WT and TBI/WT groups (E, N=5 mice/group), Sham/Hv1KO (N=5 mice) and TBI/Hv1KO (N=4 mice) groups (F), Sham/WT and Sham/Hv1KO groups (G), and TBI/WT and TBI/Hv1KO groups (H). *p<0.05, **p<0.01, ***p<0.001, two-way ANOVA test.
To rule out if TBI affects the olfactory sensory neurons (OSNs) axon, spiking or LFP oscillatory activities were recorded from the OB of sham and TBI group of mice at 1d post-injury. The oscillatory LFP activities in the GL in the respiratory frequency range (1–2 Hz) was utilized to assess the functional integrity of OSN axon following brain injury (Fig. S9). We observed no alteration in this low-frequency neural oscillation at 1day post TBI, indicating that TBI-mediated OD in our model is not a consequence of OSN axon injury.
3.4. TBI reduces synaptic density in the OB which is improved in the absence of Hv1
To further assess the effects of brain injury on neuronal function in the OB GL, we examined synaptic marker at 7 d and 4 w post-injury in the presence and absence of Hv1 gene. We first quantified the ratio of GL layer to the whole OB and showed that chronic TBI does not change the size of GL layer of the OB in both Hv1 KO and WT mice (Fig. S10). Next, synaptic marker bassoon was selected for IHC to quantify their immunofluorescence intensity (Fig. 12). Compared to Sham group, TBI in both WT and Hv1 KO mice significantly reduced fluorescence intensity of bassoon expression, suggesting disrupted presynaptic vesicles. There were no differential changes in the expression of bassoon between two sham groups or two injured groups. Furthermore, we analyzed the synaptic puncta in the GL area where the electrophysiological recording was made (Fig. 12C, F). Quantitative analysis showed significantly reduced numbers of the synaptic puncta in both injured groups, suggesting reduced presynaptic vesicles release or transmitter synthesis in these injured mice. No significant difference was found between the Sham/WT and Sham/Hv1 KO groups. However, the robust difference between TBI/WT and TBI/Hv1 KO groups at 4w TBI (p<0.05, n=6 mice/group, Fig. 12F) supports an important role of the Hv1-expressing microglia in the TBI-disrupted neuronal synaptic function in the GL at chronic time point of post-injury.
Figure 12. TBI significantly reduces synaptic density of the glomerular layer (GL) in the OB at 7d and 4w post-injury.

(A) Representative presynaptic marker Bassoon images of the OB from Sham and 7d TBI groups. (B) Quantification of the fluorescent intensity in the GL of the OB at 7d post-injury. N=4 mice/group. (C) Quantification of the synaptic puncta density in the GL area where the electrophysiological recording was made at 7d post-injury. N=4 mice/group. (D) Representative presynaptic marker Bassoon images of the OB from Sham and 4w TBI groups. (E-F) Quantification of the fluorescent intensity and the synaptic puncta in the OB GL at 4w post-injury. N=6 mice/group. *p<0.05, **p<0.01, ***p<0.001 vs. sham; #p<0.05 vs. TBI/WT. Two-way ANOVA followed by Tukey’s multiple comparison. Scale bar=500 μm (A, D) and 30 μm (inserts).
3.5. TBI causes olfactory dysfunction which is diminished in the absence of Hv1
Recent studies (Kobayashi and Costanzo, 2009; Seo et al., 2018) have associated OD with the presence of a local inflammatory response. We have recently shown marked motor and cognition improvement in Hv1 KO mice after TBI (Ritzel et al., 2021). To that end, we performed olfactory behavioral tests to determine the impact of TBI on olfaction in the presence and absence of Hv1. TBI in WT mice showed OD symptoms as evidenced by taking longer time to find the buried food and decreased odor sensitivity to isovaleric acid (IVA) at 5–6 weeks post injury (n=11–17/group, Fig. 13A–E). In two-bottle discrimination test, 80% mice in Sham/WT group showed positive responses to high concentration of IVA (10−3 M) within 1 min, and 100% mice respond within 2 min. However, WT/TBI mice showed delayed positive responses (only 20% mice within 1 min, 85% in 2 min). In response to lower concentration of IVA (10−6 M), 30% mice in Sham/WT group showed positive within 1 min, 90% in 2 min. But no mice in WT/TBI group showed positive in 1 min, 13% in 2 min. Thus, WT/TBI mice displayed significant impairment of olfactory function in each test compared with Sham mice. Remarkably, TBI-mediated OD sustained up to 26-weeks post-injury (n=11–13/group, Fig. 13F–K). In contrast to WT/TBI mice, Hv1 KO/TBI mice exhibited significant better performance in these tests, indicating improved olfactory function. Although increased latency in the buried food test was observed in the middle-aged sham mice (Fig. 13F) compared to young adult sham animals (Fig. 13A), there were no differential changes of olfaction between Sham/WT and Sham/Hv1 KO mice. These data are consistent with the hypothesis that Hv1 signaling is involved in the pathogenesis of OD after TBI.
Figure 13. TBI causes olfactory dysfunction which is diminished in the absence of Hv1.

(A) Buried food test was performed in both Hv1 KO and WT mice at 5 weeks after TBI. N=11–17 mice/group. ***p<0.001 vs. Sham/WT; #p<0.05 vs. TBI/WT. Two-way ANOVA followed by Tukey’s multiple comparison. (B-E) Two-bottle discrimination test of various concentration of isovaleric acid (IVA) at 6 weeks after TBI. 80% mice in Sham/WT group showed positive responses to high concentration of isovaleric acid (IVA, 10−3 M) within 1 min, 100% mice respond within 2 min. However, WT/TBI mice showed delayed positive responses (only 20% mice within 1 min, 85% in 2 min). In response to lower concentration of IVA (10−6 M), 30% mice in sham/WT group showed positive within 1 min, 90% in 2 min. But no mice in WT/TBI group showed positive in 1 min, 13% in 2 min. WT/TBI mice displayed significant impairment of olfactory function in each test compared with sham mice. In contrast, Hv1 KO/TBI mice displayed significant better performance in these tests, indicating improved olfactory function. (F) Buried food test at 24 weeks post-injury. N=11–13 mice/group. ***p<0.001 vs. Sham/WT; ###p<0.001 vs. TBI/WT. Two-way ANOVA followed by Tukey’s multiple comparison. (G-K) Two-bottle discrimination test of various concentration of isovaleric acid at 26 weeks post-injury. In response to lower concentration of IVA (10−5 M), % of mice in each group with latency less than 2 min are shown in K [N=10 (Sham/WT), 6 (Sham/Hv1 KO), 3 (TBI/WT), and 8 (TBI/Hv1 KO)]. ***p<0.001 vs. Sham/WT; #p<0.05 vs. TBI/WT. Two-way ANOVA followed by Tukey’s multiple comparison.
3.6. NOX2 activation contributes to olfactory dysfunction after TBI
Next, we evaluated the effect of NOX2 activation on the OD after TBI. The buried food and odor memory tests were used to determine for the ability to smell volatile odors and olfactory sensory, separately, in both NOX2 KO and WT mice subjected to CCI. No differences were observed in two genotypes before injury. While TBI impaired olfactory function as early as 16 days post-injury, NOX2 KO/TBI mice displayed significant better performance in these tests, indicating improved olfactory function in the absence of NOX2 (n=8–12/group, Fig. 14A–B). However, we did not see differential changes of the percentage of spontaneous alterations in the Y-maze test between the groups in the current CCI injury model (Fig. S11), indicating intact hippocampus-dependent spatial memory. To examine the effect of inhibiting NOX2 on TBI-mediated OD, the C57BL/6 mice subjected to a mild/moderate CCI or sham received a bilateral intranasal delivery of NOX2ds-tat (1.4 mg/kg), a potent selective NOX2 inhibitor or vehicle beginning at 3 h post-injury and twice daily for 7 days. NOX2ds-tat-treated mice exhibited ameliorated post-traumatic olfactory dysfunction evaluated in buried food test at 24 days post-injury and two-bottle discrimination test at 28 days post-injury (n=7–12/group, Fig. 14C–G). Thus, genetic depletion and the pharmacological inhibition of NOX2 improve TBI-mediated olfactory dysfunction.
Figure 14. NOX2 activation contributes to OB dysfunction after TBI.

(A-B) The buried food and odor memory tests were performed in both NOX2 KO and WT mice subjected to CCI. N=8–12 mice/group. **p<0.01, ***p<0.001 vs. Sham/WT; #p<0.05, ##p<0.01 vs. TBI/WT. Two-way ANOVA followed by Tukey’s multiple comparison. (C-G) Intranasal delivery of NOX2 inhibitor (NOX2ds-tat, 1.4 mg/kg/day, twice/day) for 7 days after TBI reserved post-traumatic olfactory dysfunction evaluated in buried food test at 24 days post-injury and two-bottle discrimination test at 28 days post-injury. N=7–12 mice/group. ***p<0.001 vs. Sham/Veh; ##p<0.01 vs. TBI/Veh. Two-way ANOVA followed by Tukey’s multiple comparison.
4. Discussion
Olfactory dysfunction following head trauma has been reported in both clinical and experimental TBI research. However, the mechanisms of how glial reactivity of the olfactory bulb may contribute to TBI-mediated OD are not fully understood. In the present study, we investigated the cellular and molecular mechanisms of OD after experimental brain injury. Increased microglial activation, infiltrated myeloid cells, pro-inflammatory changes, ROS production, and neuronal dysfunction in the olfactory bulb were demonstrated in a well-characterized, mouse CCI model, with impaired olfactory function persisting for months. Furthermore, the expression of NOX2 and Hv1 was upregulated in activated microglia/macrophages predominantly in the glomerular layer of the OB after TBI. As demonstrated in Hv1-deficient mice, the improvement of the OB neuronal network in both acute and chronic periods after TBI limited subsequent olfactory deficit. Finally, we demonstrated that manipulation of NOX2 through genetic depletion or intranasal pharmacological inhibition improved TBI-mediated olfactory dysfunction.
OD, a common sensory disorder in TBI survivors, not only has a significant impact on the quality of life but can also signal an increased likelihood of adverse cognitive and other neuropsychiatric and functional outcomes. Currently, most of our knowledge of TBI OD is derived from clinical studies, so our understanding of this secondary injury mechanism is limited. However, the manifestations and etiology of OD might be shared among many diseases including stroke (Wehling et al., 2015), TBI (Proskynitopoulos et al., 2016), PD (Yoo et al., 2020), AD (Alves et al., 2014), and most recently COVID-19 (Brann et al., 2020). Several mechanisms were proposed on the pathology of OD at the cellular level, which includes a decline in the number of functioning mature olfactory sensory neurons (Yaldizli et al., 2016), non-neuronal cells infection in COVID-19 patients (Brann et al., 2020), and activation of microglia/macrophage and excessive expression of proinflammatory mediators in OB after stroke (Yeh et al., 2019). However, the cellular and molecular mechanisms of TBI-mediated OD are understudied.
A key anatomical structure for processing odor information is the olfactory bulb, which receives the signals from the sensory neurons residing in the olfactory epithelium and presents olfactory information to other downstream centers after local synaptic processing and integration (Basser et al., 1994; Costanzo, 2005). Given its pivotal position in the olfactory system and direct interconnections with all other olfactory centers including the piriform cortex and hippocampus that are subject to pathological alteration at the early stage of TBI, OB is the potential structural candidate responsible for OD in injured brain. After TBI, there is a rapid and localized glial reactivity, including microglia and monocytes infiltration. Our data clearly demonstrate that increased microglia and myeloid cells occur in the GL of OB acutely after head injury and that the elevated inflammatory cytokines and ROS production in these cells sustained for at least three months, indicating TBI-mediated OB microgliosis. These findings are consistent with a study showing that OB microglial shift from ramified to reactive phenotype, concurrent with acute inflammatory response after mild fluid percussion injury (mFPI) (Powell et al., 2018). Due to the contusive and diffuse nature of our injury, we also observed some of the activated microglia distributed among the external plexiform layer (EPL) and the mitral cell layer (MCL). This is consistent with a recently report showing activated microglia presented in tufted cells of the EPL and mitral cells of the MCL in mice mFPI model (Powell et al., 2018), suggesting facilitated microglial generation of pro-inflammatory cytokines. However, activated microglia/macrophages can adopt a phagocytic phenotype accompanied by the release of anti-inflammatory mediators such as IL10, Arg1, and CD68 observed in the present study. These inflammatory responses may function as defensive mechanisms to limit further injury to the system before the initiation of repair processes. Nevertheless, out data showing prolonged and chronic microglial activation for up to 3-months post-injury demonstrated TBI-mediated neurotoxic environment in the OB.
To determine the molecular mechanism mediating microglial activation in the OB after TBI, our data indicate TBI-elevated expression of NOX2/ROS, the down-stream targets of the Hv1, in the OB. It is known that NOX2 is a major producer of ROS and Hv1 is required for NOX-dependent generation of ROS (He et al., 2021). We and others have previously identified a role for Hv1/NOX2 signaling in modulating inflammation and neurodegeneration in multiple models of CNS injury and disease including mice CCI model (Li et al., 2020; Li et al., 2021; Murugan et al., 2020; Ritzel et al., 2021; Tian et al., 2016; Wu et al., 2012). Increased expression levels of Hv1 and NOX2 in the microglia/macrophages of the OB as early as 24h post-injury and mitigated posttraumatic OD in both of Hv1 KO and NOX2 KO mice lead us to postulate a causative role for the Hv1/NOX2 pathway in OB inflammation and subsequent olfactory impairment after TBI. As our data indicate increased total numbers of both microglia and infiltrating myeloid cells at 24h post-injury, thus, both Hv1/NOX2-expressing immune cells contribute to early OB inflammation. However, myeloid counts return to sham levels by 90 days while pro-inflammatory cytokines IL6+ and TNF+ microglia are highly sustained in TBI groups, suggesting microglia may be the predominant drivers of Hv1/NOX2-mediated chronic inflammation in the OB. Further studies are needed to determine whether Hv1/NOX2-expressing microglia can regulate chronic OB inflammation and function after head injury.
It has been increasingly recognized that microglia-neuron interactions via a variety of mechanisms play important roles in both physiological and pathophysiological conditions (Cserep et al., 2021; Eyo and Wu, 2013). However, the functional significance of this glia-neuron cross talk in olfactory processing and especially the TBI-induced dysfunction remains elusive (Grier et al., 2016; Herbert et al., 2012; Kohl et al., 2017; Reshef et al., 2017). In the present study, we provided multiple lines of evidence support crucial roles of microglia activation in the TBI-altered neuronal excitability and network operation but in normal physiology in the OB. First, we revealed reduction of neuronal firing activities in the glomerular layer (GL) but not in the mitral cell layer of WT mice on the 7 days of post-TBI. Considering our observations of enhanced microglia activation predominantly in the same layer following TBI, this indicates roles of microglia activation in the injury-altered excitability of local neurons. Second, in contrast to WT mice, TBI increased neuronal firing activities in the GL of Hv1KO mice, where microglia-mediated inflammation was inhibited due to their lack of Hv1 channels. This finding provides direct support of the determinant role of local microglia activation in regulating neuronal excitability at this subacute post-injury stage. On the other hand, no difference in neuronal excitability in the same layer between sham groups of WT and Hv1KO mice was observed, implying that microglia do not contribute to the regulation of neuronal excitability in the OB GL under normal physiological conditions (Caggiano and Brunjes, 1993; Lazarini et al., 2012). Third, consistent with that GL recordings predominantly reflect excitability of local GABAergic interneurons that provide powerful inhibition of OB output neurons activities (Burton, 2017; Liu et al., 2016; Parrish-Aungst et al., 2007; Shao et al., 2012), TBI induced differential or opposite effects on excitability of MCs recorded at the subacute post-injury phase in Hv1KO mice compared to WT animals. In agreement with our observation of the microglia activation-dependent excitation-inhibition imbalance in the OB following TBI, the cytokine IL-6 reduces GABAergic synaptic activities while IL-1β and TNFα enhance glutamatergic synaptic activities in lamina II neurons of the spinal cord (Kawasaki et al., 2008). Fourth, the differential responses of oscillatory activities in both GL and MCL of Hv1KO mice to TBI at the 7 days post-injury compared to WT mice further support the regulatory role of microglia activation in functional operation of local neural networks that are formed among excitatory projection neurons and inhibitory interneurons. Finally, we found that MCs exhibited opposite changes in excitability at post-injury 4 weeks compared to post-TBI 7 days. This might attribute to the phenotypic and functional difference of microglia in acute vs chronic post-TBI stage (Donat et al., 2017; Mira et al., 2021). Since the OB is the initial site of synaptic processing of olfactory signals in the olfactory system thus pivotally positioned to regulate odorant stimulus presentation to downstream centers (Nagayama et al., 2014; Shepherd, 1972; Wachowiak and Shipley, 2006), the microglia activation-dependent alteration of neuronal excitability and network operation in the OB potentially serves as functional mechanisms underlying the TBI-induced olfactory dysfunction. Further research on this topic is necessary in our future work.
The presence and degree of OD and anosmia depend on the severity of head trauma, the duration of posttraumatic amnesia, the injury location, and the age. Olfaction decreases with age, however, OD has been reported after pediatric TBI (Bakker et al., 2014). Moreover, it is prevalent in up to 20% of patients suffering from mild TBI (Proskynitopoulos et al., 2016). Furthermore, persistent OD is common after TBI, and many of these cases have a severe degree of OD (Whitcroft and Hummel, 2019). Clinical results (Schofield et al., 2014; Tai et al., 2022) revealed that anosmia and OD are likely to be linked to severity of injury, neuropathology, and executive dysfunction. In the present study, we established a mouse model to study OD after mild/moderate TBI. Like other sensory systems, olfactory function declines with age evidenced by prolonged latency for the middle-aged sham mice (9-months-old) to find the buried food compared with young adult sham animals (3-months-old). Moreover, we observed OD as early as 3 weeks post injury while hippocampus-dependent spatial memory tested in Y maze was intact, which is consistent with literatures showing anosmia as an early clinical sign in TBI patients. These data are in line with the observation of altered neuronal excitability and network function in the OB as early as 7 days post-injury. It has been reported that OD is an early symptom of many neurodegenerative diseases, particularly of Parkinson disease (PD) and AD and may therefore serve as an early biomarker for the diagnosis of PD/AD and their disease progression (Alves et al., 2014; Marin et al., 2018). Thus, TBI survivors with OD may be an early sign heralding its progression to dementia. Physically, OB is far away from the impact site, where mechanical damage is unlikely to happen. Furthermore, due to the presence of mechanical sensor in the olfactory sensory neurons (OSNs) residing in the olfactory epithelium (Carey et al., 2009; Grosmaitre et al., 2007), the oscillatory LFP activities in the GL in the respiratory frequency range (1–2 Hz) can utilized to assess the functional integrity of OSN axon following brain injury. Our observation of no alteration in this low-frequency neural oscillation at 1day post TBI indicates that the post-TBI OD in our model is not a consequence of OSN axon injury. Thus, TBI-mediated OD is likely the result of secondary injury other than the mechanical damage to OB. Our data demonstrate that after TBI significant olfactory impairment appeared in injured mice up to six months, evidenced by a poor performance in a battery of olfactory behavioral tests. In agreement with the neuroprotective effects of Hv1 and NOX2 deficiency (Kumar et al., 2016b; Ritzel et al., 2021), we demonstrate ameliorated post-traumatic OD in experimental CCI of TBI model, suggesting that reduced the inflammatory profile in the OB was associated with cellular protection.
Despite rapidly progressing research, treatment of OD after TBI remains limited, with systemic steroids being the only pharmacological treatment to date (Seo et al., 2018; Whitcroft and Hummel, 2019). While early treatment with corticosteroids may facilitate regeneration of an injured olfactory nerve and regress of scar tissue (Kobayashi and Costanzo, 2009), the studies showed only improved sense of smell in 12–16% of patients with posttraumatic persistent OD (Ikeda et al., 1995). Olfactory training is a promising treatment for OD of various etiologies (Patel, 2017), however, the effect declined after a few months post-therapy (Langdon et al., 2018). Nonetheless, their partial efficacy and their non-negligible side effects render their use problematic and highlight the need for therapeutic alternatives. To minimize peripheral effects of systemic administration of the drugs examined and to better delineate their effects on olfactory function, local treatment would be the idea. Intranasal delivery of peptides and other drugs using a pipet has been shown to be successful in prior rodent studies (Renner et al., 2012; Thorne et al., 2004). Intranasal administration of drug to the brain bypasses the blood-brain barrier by using olfactory and trigeminal neurons that pass through the cribriform plate (Dhuria et al., 2010; Thorne et al., 2004). Although the drug also distributes to the cortex, cerebellum, hippocampus, and brainstem, it reaches highest concentrations in the olfactory bulb (Brabazon et al., 2017). However, to date, no prior study has attempted to deliver intranasal Hv1/NOX2 inhibitors to mouse following TBI or any other model of brain injury. The neuroprotective effects of a specific NOX2 inhibitor, NOX2ds-tet have been observed in experimental CNS trauma (Kumar et al., 2016b; Sabirzhanov et al., 2019). Here, we demonstrate that intranasal delivery of NOX2 inhibitor for 1 week after TBI reverses post-traumatic OD as evaluated using the buried food test and the two-bottle discrimination test. The pharmacological inhibition of Hv1 proton channel represents an attractive and novel approach for targeting inflammatory disorders. However, the specificity of current Hv1 inhibitors has been debated. Future studies are needed to determine whether selective inhibition of the Hv1 channel through intranasal delivery can reduce OB inflammation and improve olfactory function after head injury.
TBI in humans is more common in men (Hosomi et al., 2021). Despite sex differences have been widely reported in experimental models of TBI (Rubin and Lipton, 2019), the main reason for focusing on male mice in the present study was to reduce the number of animals used and potential confusion across the various experimental paradigms of the study. Hv1- or NOX2-related sex differences in TBI-mediated OD have not been reported and remain an intriguing area for future investigation.
In conclusion, our cellular and molecular findings provided complementary evidence (Table S1) that TBI induced microglia/macrophage-related neuroinflammation in the OB, accompanied by upregulation of Hv1/NOX2 (Fig. 15). OB neuronal firing activities indicate that TBI induced early neuronal hyperexcitation and later hypo-neuronal activity and disrupted network function in the OB which were improved in the Hv1 KO mice. Thus, our results establish a direct connection between inflammation and neuronal function. Finally, we demonstrated that ablation or inhibition of Hv1/NOX2 improved TBI-mediated olfactory dysfunction. Therefore, targeting Hv1/NOX2 may be a potential intervention for improving post-traumatic anosmia.
Figure 15. Hv1/NOX2-mediated proinflammatory changes in the olfactory bulb (OB) disrupt OB neuronal circuits leading to poorer olfactory function after traumatic brain injury (TBI).

TBI induced microglia/macrophages-related neuroinflammation in the glomerular layer (GL) of the OB, accompanied by upregulation of Hv1/NOX2. OB neuronal firing activities indicate that TBI induced early neuronal hyperexcitation and later hypo-neuronal activity and disrupted network function in the OB which were improved in the Hv1 KO mice. TBI significantly reduces synaptic density of the glomerular layer (GL) in the OB which was improved in the Hv1 KO mice at chronic time-point. Genetically or pharmacologically manipulating Hv1/NOX2 signaling can improve TBI-mediated olfactory dysfunction. MCL: mitral cells layer; EPL: external plexiform layer; NOX2: The nicotinamide adenine dinucleotide phosphate oxidase 2.
Supplementary Material
Highlights.
Cortical contusion TBI caused a rapid inflammatory response in the olfactory bulb
Increased Hv1 and NOX2 in the OB were accompanied by elevated ROS production
TBI induced early neuronal hyperexcitation and later hypo-neuronal activity in the OB
TBI-disrupted OB neuronal network function was improved in the Hv1 KO mice
Blocking or inhibiting Hv1/NOX2 signaling improved TBI-mediate olfactory dysfunction
Acknowledgements
The work was supported by the National Institutes of Health Grants R01 AG077541 (JW and SL), R01 NS110825 (JW and LW), 2RF1 NS094527 (JW), RF1 NS110637 (JW), and R01 AG074216 (SL). We would like to thank Ms. Lulu Liu for assistance with the animal care and mice perfusion.
Footnotes
Competing interests
The authors declare no competing interests.
Supplementary Information
Supplementary Information includes Supplemental 11 figures, figure legends, and 1 table.
Publisher's Disclaimer: This is a PDF file of an unedited manuscript that has been accepted for publication. As a service to our customers we are providing this early version of the manuscript. The manuscript will undergo copyediting, typesetting, and review of the resulting proof before it is published in its final form. Please note that during the production process errors may be discovered which could affect the content, and all legal disclaimers that apply to the journal pertain.
Data availability
All study data are included in the article and/or the Supplementary Materials.
References
- Abais JM, Zhang C, Xia M, Liu Q, Gehr TW, Boini KM, Li PL, 2013. NADPH oxidase-mediated triggering of inflammasome activation in mouse podocytes and glomeruli during hyperhomocysteinemia. Antioxidants & redox signaling 18, 1537–1548. [DOI] [PMC free article] [PubMed] [Google Scholar]
- Alves J, Petrosyan A, Magalhaes R, 2014. Olfactory dysfunction in dementia. World J Clin Cases 2, 661–667. [DOI] [PMC free article] [PubMed] [Google Scholar]
- Ashwell K, 1991. The distribution of microglia and cell death in the fetal rat forebrain. Brain Res Dev Brain Res 58, 1–12. [DOI] [PubMed] [Google Scholar]
- Bakker K, Catroppa C, Anderson V, 2014. Olfactory dysfunction in pediatric traumatic brain injury: a systematic review. J Neurotrauma 31, 308–314. [DOI] [PubMed] [Google Scholar]
- Basser PJ, Mattiello J, LeBihan D, 1994. MR diffusion tensor spectroscopy and imaging. Biophys J 66, 259–267. [DOI] [PMC free article] [PubMed] [Google Scholar]
- Brabazon F, Wilson CM, Jaiswal S, Reed J, Frey WHN, Byrnes KR, 2017. Intranasal insulin treatment of an experimental model of moderate traumatic brain injury. J Cereb Blood Flow Metab 37, 3203–3218. [DOI] [PMC free article] [PubMed] [Google Scholar]
- Brann DH, Tsukahara T, Weinreb C, Lipovsek M, Van den Berge K, Gong B, Chance R, Macaulay IC, Chou HJ, Fletcher RB, Das D, Street K, de Bezieux HR, Choi YG, Risso D, Dudoit S, Purdom E, Mill J, Hachem RA, Matsunami H, Logan DW, Goldstein BJ, Grubb MS, Ngai J, Datta SR, 2020. Non-neuronal expression of SARS-CoV-2 entry genes in the olfactory system suggests mechanisms underlying COVID-19-associated anosmia. Sci Adv 6. [DOI] [PMC free article] [PubMed] [Google Scholar]
- Bratt M, Skandsen T, Hummel T, Moen KG, Vik A, Nordgard S, Helvik AS, 2018. Frequency and prognostic factors of olfactory dysfunction after traumatic brain injury. Brain injury : [BI] 32, 1021–1027. [DOI] [PubMed] [Google Scholar]
- Burton SD, 2017. Inhibitory circuits of the mammalian main olfactory bulb. J Neurophysiol 118, 2034–2051. [DOI] [PMC free article] [PubMed] [Google Scholar]
- Burton SD, Urban NN, 2021. Cell and circuit origins of fast network oscillations in the mammalian main olfactory bulb. Elife 10. [DOI] [PMC free article] [PubMed] [Google Scholar]
- Buzsaki G, Draguhn A, 2004. Neuronal oscillations in cortical networks. Science 304, 1926–1929. [DOI] [PubMed] [Google Scholar]
- Caggiano AO, Brunjes PC, 1993. Microglia and the developing olfactory bulb. Neuroscience 52, 717–724. [DOI] [PubMed] [Google Scholar]
- Carey RM, Verhagen JV, Wesson DW, Pirez N, Wachowiak M, 2009. Temporal structure of receptor neuron input to the olfactory bulb imaged in behaving rats. J Neurophysiol 101, 1073–1088. [DOI] [PMC free article] [PubMed] [Google Scholar]
- Chistiakov DA, Killingsworth MC, Myasoedova VA, Orekhov AN, Bobryshev YV, 2017. CD68/macrosialin: not just a histochemical marker. Lab Invest 97, 4–13. [DOI] [PubMed] [Google Scholar]
- Costanzo RM, 2005. Regeneration and rewiring the olfactory bulb. Chem Senses 30 Suppl 1, i133–134. [DOI] [PMC free article] [PubMed] [Google Scholar]
- Cserep C, Posfai B, Denes A, 2021. Shaping Neuronal Fate: Functional Heterogeneity of Direct Microglia-Neuron Interactions. Neuron 109, 222–240. [DOI] [PubMed] [Google Scholar]
- Dhuria SV, Hanson LR, Frey WH, 2nd, 2010. Intranasal delivery to the central nervous system: mechanisms and experimental considerations. Journal of pharmaceutical sciences 99, 1654–1673. [DOI] [PubMed] [Google Scholar]
- Donat CK, Scott G, Gentleman SM, Sastre M, 2017. Microglial Activation in Traumatic Brain Injury. Front Aging Neurosci 9, 208. [DOI] [PMC free article] [PubMed] [Google Scholar]
- Doorn KJ, Goudriaan A, Blits-Huizinga C, Bol JG, Rozemuller AJ, Hoogland PV, Lucassen PJ, Drukarch B, van de Berg WD, van Dam AM, 2014. Increased amoeboid microglial density in the olfactory bulb of Parkinson’s and Alzheimer’s patients. Brain pathology 24, 152–165. [DOI] [PMC free article] [PubMed] [Google Scholar]
- Eyo UB, Wu LJ, 2013. Bidirectional microglia-neuron communication in the healthy brain. Neural plasticity 2013, 456857. [DOI] [PMC free article] [PubMed] [Google Scholar]
- Faden AI, Wu J, Stoica BA, Loane DJ, 2016. Progressive inflammation-mediated neurodegeneration after traumatic brain or spinal cord injury. Br J Pharmacol 173, 681–691. [DOI] [PMC free article] [PubMed] [Google Scholar]
- Fiske BK, Brunjes PC, 2000. Microglial activation in the developing rat olfactory bulb. Neuroscience 96, 807–815. [DOI] [PubMed] [Google Scholar]
- Fukunaga I, Herb JT, Kollo M, Boyden ES, Schaefer AT, 2014. Independent control of gamma and theta activity by distinct interneuron networks in the olfactory bulb. Nat Neurosci 17, 1208–1216. [DOI] [PMC free article] [PubMed] [Google Scholar]
- Grier BD, Belluscio L, Cheetham CE, 2016. Olfactory Sensory Activity Modulates Microglial-Neuronal Interactions during Dopaminergic Cell Loss in the Olfactory Bulb. Frontiers in cellular neuroscience 10, 178. [DOI] [PMC free article] [PubMed] [Google Scholar]
- Grosmaitre X, Santarelli LC, Tan J, Luo M, Ma M, 2007. Dual functions of mammalian olfactory sensory neurons as odor detectors and mechanical sensors. Nat Neurosci 10, 348–354. [DOI] [PMC free article] [PubMed] [Google Scholar]
- Hanson LR, Fine JM, Svitak AL, Faltesek KA, 2013. Intranasal administration of CNS therapeutics to awake mice. Journal of visualized experiments : JoVE. [DOI] [PMC free article] [PubMed] [Google Scholar]
- He J, Ritzel RM, Wu J, 2021. Functions and Mechanisms of the Voltage-Gated Proton Channel Hv1 in Brain and Spinal Cord Injury. Frontiers in cellular neuroscience 15, 662971. [DOI] [PMC free article] [PubMed] [Google Scholar]
- Herbert RP, Harris J, Chong KP, Chapman J, West AK, Chuah MI, 2012. Cytokines and olfactory bulb microglia in response to bacterial challenge in the compromised primary olfactory pathway. J Neuroinflammation 9, 109. [DOI] [PMC free article] [PubMed] [Google Scholar]
- Hosomi S, Kitamura T, Sobue T, Ogura H, Shimazu T, 2021. Sex and age differences in isolated traumatic brain injury: a retrospective observational study. BMC Neurol 21, 261. [DOI] [PMC free article] [PubMed] [Google Scholar]
- Howell J, Costanzo RM, Reiter ER, 2018. Head trauma and olfactory function. World journal of otorhinolaryngology - head and neck surgery 4, 39–45. [DOI] [PMC free article] [PubMed] [Google Scholar]
- Ikeda K, Sakurada T, Takasaka T, Okitsu T, Yoshida S, 1995. Anosmia following head trauma: preliminary study of steroid treatment. Tohoku J Exp Med 177, 343–351. [DOI] [PubMed] [Google Scholar]
- Kawasaki Y, Zhang L, Cheng JK, Ji RR, 2008. Cytokine mechanisms of central sensitization: distinct and overlapping role of interleukin-1beta, interleukin-6, and tumor necrosis factor-alpha in regulating synaptic and neuronal activity in the superficial spinal cord. J Neurosci 28, 5189–5194. [DOI] [PMC free article] [PubMed] [Google Scholar]
- Kay LM, Beshel J, Brea J, Martin C, Rojas-Libano D, Kopell N, 2009. Olfactory oscillations: the what, how and what for. Trends in neurosciences 32, 207–214. [DOI] [PMC free article] [PubMed] [Google Scholar]
- Kobayashi M, Costanzo RM, 2009. Olfactory nerve recovery following mild and severe injury and the efficacy of dexamethasone treatment. Chem Senses 34, 573–580. [DOI] [PMC free article] [PubMed] [Google Scholar]
- Kohl Z, Schlachetzki JC, Feldewerth J, Hornauer P, Munch M, Adame A, Riemenschneider MJ, Winkler J, Masliah E, 2017. Distinct Pattern of Microgliosis in the Olfactory Bulb of Neurodegenerative Proteinopathies. Neural plasticity 2017, 3851262. [DOI] [PMC free article] [PubMed] [Google Scholar]
- Kumar A, Alvarez-Croda DM, Stoica BA, Faden AI, Loane DJ, 2016a. Microglial/Macrophage Polarization Dynamics following Traumatic Brain Injury. J Neurotrauma 33, 1732–1750. [DOI] [PMC free article] [PubMed] [Google Scholar]
- Kumar A, Barrett JP, Alvarez-Croda DM, Stoica BA, Faden AI, Loane DJ, 2016b. NOX2 drives M1-like microglial/macrophage activation and neurodegeneration following experimental traumatic brain injury. Brain Behav Immun 58, 291–309. [DOI] [PMC free article] [PubMed] [Google Scholar]
- Kumar A, Loane DJ, 2012. Neuroinflammation after traumatic brain injury: opportunities for therapeutic intervention. Brain Behav Immun 26, 1191–1201. [DOI] [PubMed] [Google Scholar]
- Langdon C, Lehrer E, Berenguer J, Laxe S, Alobid I, Quinto L, Marino-Sanchez F, Bernabeu M, Marin C, Mullol J, 2018. Olfactory Training in Post-Traumatic Smell Impairment: Mild Improvement in Threshold Performances: Results from a Randomized Controlled Trial. J Neurotrauma 35, 2641–2652. [DOI] [PubMed] [Google Scholar]
- Lazarini F, Gabellec MM, Torquet N, Lledo PM, 2012. Early activation of microglia triggers long-lasting impairment of adult neurogenesis in the olfactory bulb. J Neurosci 32, 3652–3664. [DOI] [PMC free article] [PubMed] [Google Scholar]
- Lee YK, Hou SW, Lee CC, Hsu CY, Huang YS, Su YC, 2013. Increased risk of dementia in patients with mild traumatic brain injury: a nationwide cohort study. PLoS One 8, e62422. [DOI] [PMC free article] [PubMed] [Google Scholar]
- Li X, Yu Z, Zong W, Chen P, Li J, Wang M, Ding F, Xie M, Wang W, Luo X, 2020. Deficiency of the microglial Hv1 proton channel attenuates neuronal pyroptosis and inhibits inflammatory reaction after spinal cord injury. J Neuroinflammation 17, 263. [DOI] [PMC free article] [PubMed] [Google Scholar]
- Li Y, Lei Z, Ritzel RM, He J, Li H, Choi HMC, Lipinski MM, Wu J, 2022. Impairment of autophagy after spinal cord injury potentiates neuroinflammation and motor function deficit in mice. Theranostics 12, 5364–5388. [DOI] [PMC free article] [PubMed] [Google Scholar]
- Li Y, Ritzel RM, He J, Cao T, Sabirzhanov B, Li H, Liu S, Wu LJ, Wu J, 2021. The voltage-gated proton channel Hv1 plays a detrimental role in contusion spinal cord injury via extracellular acidosis-mediated neuroinflammation. Brain Behav Immun 91, 267–283. [DOI] [PMC free article] [PubMed] [Google Scholar]
- Liu S, Puche AC, Shipley MT, 2016. The Interglomerular Circuit Potently Inhibits Olfactory Bulb Output Neurons by Both Direct and Indirect Pathways. J Neurosci 36, 9604–9617. [DOI] [PMC free article] [PubMed] [Google Scholar]
- Loane DJ, Kumar A, 2016. Microglia in the TBI brain: The good, the bad, and the dysregulated. Exp Neurol 275 Pt 3, 316–327. [DOI] [PMC free article] [PubMed] [Google Scholar]
- Logan M, Kapoor S, Peterson L, Oliveira M, Han DY, 2021. Mechanism of olfactory deficit in neurotrauma and its related affective distress: A narrative review. World J Psychiatry 11, 1259–1266. [DOI] [PMC free article] [PubMed] [Google Scholar]
- Marin C, Fuentes M, Alobid I, Tubita V, Rojas-Lechuga MJ, Mullol J, 2022. Olfactory Bulb Excitotoxicity as a Gap-Filling Mechanism Underlying the Link Between Traumatic Brain Injury-Induced Secondary Neuronal Degeneration and Parkinson’s Disease-Like Pathology. Neurochem Res 47, 1025–1036. [DOI] [PubMed] [Google Scholar]
- Marin C, Vilas D, Langdon C, Alobid I, Lopez-Chacon M, Haehner A, Hummel T, Mullol J, 2018. Olfactory Dysfunction in Neurodegenerative Diseases. Curr Allergy Asthma Rep 18, 42. [DOI] [PubMed] [Google Scholar]
- Mira RG, Lira M, Cerpa W, 2021. Traumatic Brain Injury: Mechanisms of Glial Response. Front Physiol 12, 740939. [DOI] [PMC free article] [PubMed] [Google Scholar]
- Murugan M, Zheng J, Wu G, Mogilevsky R, Zheng X, Hu P, Wu J, Wu LJ, 2020. The voltage-gated proton channel Hv1 contributes to neuronal injury and motor deficits in a mouse model of spinal cord injury. Mol Brain 13, 143. [DOI] [PMC free article] [PubMed] [Google Scholar]
- Nagayama S, Homma R, Imamura F, 2014. Neuronal organization of olfactory bulb circuits. Front Neural Circuits 8, 98. [DOI] [PMC free article] [PubMed] [Google Scholar]
- Nordstrom P, Michaelsson K, Gustafson Y, Nordstrom A, 2014. Traumatic brain injury and young onset dementia: a nationwide cohort study. Ann Neurol 75, 374–381. [DOI] [PubMed] [Google Scholar]
- Parrish-Aungst S, Shipley MT, Erdelyi F, Szabo G, Puche AC, 2007. Quantitative analysis of neuronal diversity in the mouse olfactory bulb. The Journal of comparative neurology 501, 825–836. [DOI] [PubMed] [Google Scholar]
- Patel ZM, 2017. The evidence for olfactory training in treating patients with olfactory loss. Curr Opin Otolaryngol Head Neck Surg 25, 43–46. [DOI] [PubMed] [Google Scholar]
- Powell MA, Black RT, Smith TL, Reeves TM, Phillips LL, 2018. Mild Fluid Percussion Injury Induces Diffuse Axonal Damage and Reactive Synaptic Plasticity in the Mouse Olfactory Bulb. Neuroscience 371, 106–118. [DOI] [PMC free article] [PubMed] [Google Scholar]
- Powell MA, Black RT, Smith TL, Reeves TM, Phillips LL, 2019. Matrix Metalloproteinase 9 and Osteopontin Interact to Support Synaptogenesis in the Olfactory Bulb after Mild Traumatic Brain Injury. J Neurotrauma. [DOI] [PMC free article] [PubMed] [Google Scholar]
- Proskynitopoulos PJ, Stippler M, Kasper EM, 2016. Post-traumatic anosmia in patients with mild traumatic brain injury (mTBI): A systematic and illustrated review. Surg Neurol Int 7, S263–275. [DOI] [PMC free article] [PubMed] [Google Scholar]
- Ramsey IS, Moran MM, Chong JA, Clapham DE, 2006. A voltage-gated proton-selective channel lacking the pore domain. Nature 440, 1213–1216. [DOI] [PMC free article] [PubMed] [Google Scholar]
- Renner DB, Svitak AL, Gallus NJ, Ericson ME, Frey WH 2nd, Hanson LR, 2012. Intranasal delivery of insulin via the olfactory nerve pathway. J Pharm Pharmacol 64, 1709–1714. [DOI] [PubMed] [Google Scholar]
- Reshef R, Kudryavitskaya E, Shani-Narkiss H, Isaacson B, Rimmerman N, Mizrahi A, Yirmiya R, 2017. The role of microglia and their CX3CR1 signaling in adult neurogenesis in the olfactory bulb. Elife 6. [DOI] [PMC free article] [PubMed] [Google Scholar]
- Ribeiro Xavier AL, Kress BT, Goldman SA, Lacerda de Menezes JR, Nedergaard M, 2015. A Distinct Population of Microglia Supports Adult Neurogenesis in the Subventricular Zone. J Neurosci 35, 11848–11861. [DOI] [PMC free article] [PubMed] [Google Scholar]
- Ritzel RM, Doran SJ, Barrett JP, Henry RJ, Ma EL, Faden AI, Loane DJ, 2018. Chronic Alterations in Systemic Immune Function after Traumatic Brain Injury. J Neurotrauma 35, 1419–1436. [DOI] [PMC free article] [PubMed] [Google Scholar]
- Ritzel RM, He J, Li Y, Cao T, Khan N, Shim B, Sabirzhanov B, Aubrecht T, Stoica BA, Faden AI, Wu LJ, Wu J, 2021. Proton extrusion during oxidative burst in microglia exacerbates pathological acidosis following traumatic brain injury. Glia 69, 746–764. [DOI] [PMC free article] [PubMed] [Google Scholar]
- Ritzel RM, Li Y, He J, Khan N, Doran SJ, Faden AI, Wu J, 2020. Sustained neuronal and microglial alterations are associated with diverse neurobehavioral dysfunction long after experimental brain injury. Neurobiol Dis 136, 104713. [DOI] [PMC free article] [PubMed] [Google Scholar]
- Ritzel RM, Li Y, Lei Z, Carter J, He J, Choi HMC, Khan N, Li H, Allen S, Lipinski MM, Faden AI, Wu J, 2022. Functional and transcriptional profiling of microglial activation during the chronic phase of TBI identifies an age-related driver of poor outcome in old mice. Geroscience 44, 1407–1440. [DOI] [PMC free article] [PubMed] [Google Scholar]
- Rubin TG, Lipton ML, 2019. Sex Differences in Animal Models of Traumatic Brain Injury. J Exp Neurosci 13, 1179069519844020. [DOI] [PMC free article] [PubMed] [Google Scholar]
- Sabirzhanov B, Li Y, Coll-Miro M, Matyas JJ, He J, Kumar A, Ward N, Yu J, Faden AI, Wu J, 2019. Inhibition of NOX2 signaling limits pain-related behavior and improves motor function in male mice after spinal cord injury: Participation of IL-10/miR-155 pathways. Brain Behav Immun 80, 73–87. [DOI] [PMC free article] [PubMed] [Google Scholar]
- Sasaki M, Takagi M, Okamura Y, 2006. A voltage sensor-domain protein is a voltage-gated proton channel. Science 312, 589–592. [DOI] [PubMed] [Google Scholar]
- Sato K, 2015. Effects of Microglia on Neurogenesis. Glia 63, 1394–1405. [DOI] [PMC free article] [PubMed] [Google Scholar]
- Schofield PW, Moore TM, Gardner A, 2014. Traumatic brain injury and olfaction: a systematic review. Frontiers in neurology 5, 5. [DOI] [PMC free article] [PubMed] [Google Scholar]
- Sellgren CM, Gracias J, Watmuff B, Biag JD, Thanos JM, Whittredge PB, Fu T, Worringer K, Brown HE, Wang J, Kaykas A, Karmacharya R, Goold CP, Sheridan SD, Perlis RH, 2019. Increased synapse elimination by microglia in schizophrenia patient-derived models of synaptic pruning. Nat Neurosci 22, 374–385. [DOI] [PMC free article] [PubMed] [Google Scholar]
- Seo Y, Kim HS, Kang I, Choi SW, Shin TH, Shin JH, Lee BC, Lee JY, Kim JJ, Kook MG, Kang KS, 2016. Cathepsin S contributes to microglia-mediated olfactory dysfunction through the regulation of Cx3cl1-Cx3cr1 axis in a Niemann-Pick disease type C1 model. Glia 64, 2291–2305. [DOI] [PubMed] [Google Scholar]
- Seo Y, Kim HS, Kang KS, 2018. Microglial involvement in the development of olfactory dysfunction. J Vet Sci 19, 319–330. [DOI] [PMC free article] [PubMed] [Google Scholar]
- Seo Y, Kim HS, Shin Y, Kang I, Choi SW, Yu KR, Seo KW, Kang KS, 2014. Excessive microglial activation aggravates olfactory dysfunction by impeding the survival of newborn neurons in the olfactory bulb of Niemann-Pick disease type C1 mice. Biochim Biophys Acta 1842, 2193–2203. [DOI] [PubMed] [Google Scholar]
- Shao Z, Puche AC, Liu S, Shipley MT, 2012. Intraglomerular inhibition shapes the strength and temporal structure of glomerular output. J Neurophysiol 108, 782–793. [DOI] [PMC free article] [PubMed] [Google Scholar]
- Shepherd GM, 1972. Synaptic organization of the mammalian olfactory bulb. Physiological reviews 52, 864–917. [DOI] [PubMed] [Google Scholar]
- Siopi E, Calabria S, Plotkine M, Marchand-Leroux C, Jafarian-Tehrani M, 2012. Minocycline restores olfactory bulb volume and olfactory behavior after traumatic brain injury in mice. J Neurotrauma 29, 354–361. [DOI] [PubMed] [Google Scholar]
- Sumner D, 1964. Post-Traumatic Anosmia. Brain 87, 107–120. [DOI] [PubMed] [Google Scholar]
- Tai K, Leland EM, Seal SM, Schneider ALC, Rowan NR, Kamath V, 2022. Olfactory Dysfunction Following Moderate to Severe Traumatic Brain Injury: A Systematic Review and Meta-Analysis. Neuropsychology review. [DOI] [PMC free article] [PubMed] [Google Scholar]
- Testa G, Mainardi M, Olimpico F, Pancrazi L, Cattaneo A, Caleo M, Costa M, 2019. A triheptanoin-supplemented diet rescues hippocampal hyperexcitability and seizure susceptibility in FoxG1(+/−) mice. Neuropharmacology 148, 305–310. [DOI] [PubMed] [Google Scholar]
- Thorne RG, Pronk GJ, Padmanabhan V, Frey WH 2nd, 2004. Delivery of insulin-like growth factor-I to the rat brain and spinal cord along olfactory and trigeminal pathways following intranasal administration. Neuroscience 127, 481–496. [DOI] [PubMed] [Google Scholar]
- Tian DS, Li CY, Qin C, Murugan M, Wu LJ, Liu JL, 2016. Deficiency in the voltage-gated proton channel Hv1 increases M2 polarization of microglia and attenuates brain damage from photothrombotic ischemic stroke. J Neurochem 139, 96–105. [DOI] [PMC free article] [PubMed] [Google Scholar]
- Tillerson JL, Caudle WM, Parent JM, Gong C, Schallert T, Miller GW, 2006. Olfactory discrimination deficits in mice lacking the dopamine transporter or the D2 dopamine receptor. Behav Brain Res 172, 97–105. [DOI] [PubMed] [Google Scholar]
- Tordoff MG, Bachmanov AA, 2002. Influence of test duration on the sensitivity of the two-bottle choice test. Chem Senses 27, 759–768. [DOI] [PubMed] [Google Scholar]
- Traub RD, Bibbig A, LeBeau FE, Buhl EH, Whittington MA, 2004. Cellular mechanisms of neuronal population oscillations in the hippocampus in vitro. Annual review of neuroscience 27, 247–278. [DOI] [PubMed] [Google Scholar]
- Wachowiak M, Shipley MT, 2006. Coding and synaptic processing of sensory information in the glomerular layer of the olfactory bulb. Semin Cell Dev Biol 17, 411–423. [DOI] [PubMed] [Google Scholar]
- Wang HK, Lin SH, Sung PS, Wu MH, Hung KW, Wang LC, Huang CY, Lu K, Chen HJ, Tsai KJ, 2012. Population based study on patients with traumatic brain injury suggests increased risk of dementia. J Neurol Neurosurg Psychiatry 83, 1080–1085. [DOI] [PubMed] [Google Scholar]
- Wehling E, Naess H, Wollschlaeger D, Hofstad H, Bramerson A, Bende M, Nordin S, 2015. Olfactory dysfunction in chronic stroke patients. BMC Neurol 15, 199. [DOI] [PMC free article] [PubMed] [Google Scholar]
- Whitcroft KL, Hummel T, 2019. Clinical Diagnosis and Current Management Strategies for Olfactory Dysfunction: A Review. JAMA Otolaryngol Head Neck Surg 145, 846–853. [DOI] [PubMed] [Google Scholar]
- Witcher KG, Eiferman DS, Godbout JP, 2015. Priming the inflammatory pump of the CNS after traumatic brain injury. Trends in neurosciences 38, 609–620. [DOI] [PMC free article] [PubMed] [Google Scholar]
- Wu LJ, Wu G, Akhavan Sharif MR, Baker A, Jia Y, Fahey FH, Luo HR, Feener EP, Clapham DE, 2012. The voltage-gated proton channel Hv1 enhances brain damage from ischemic stroke. Nat Neurosci 15, 565–573. [DOI] [PMC free article] [PubMed] [Google Scholar]
- Yaldizli O, Penner IK, Yonekawa T, Naegelin Y, Kuhle J, Pardini M, Chard DT, Stippich C, Kira JI, Bendfeldt K, Amann M, Radue EW, Kappos L, Sprenger T, 2016. The association between olfactory bulb volume, cognitive dysfunction, physical disability and depression in multiple sclerosis. Eur J Neurol 23, 510–519. [DOI] [PubMed] [Google Scholar]
- Yeh CF, Chuang TY, Lan MY, Chin YC, Wang WH, Lin YY, 2019. Excessive Expression of Microglia/Macrophage and Proinflammatory Mediators in Olfactory Bulb and Olfactory Dysfunction After Stroke. In Vivo 33, 1893–1899. [DOI] [PMC free article] [PubMed] [Google Scholar]
- Yoo HS, Chung SJ, Lee YH, Ye BS, Sohn YH, Lee PH, 2020. Association between Olfactory Deficit and Motor and Cognitive Function in Parkinson’s Disease. J Mov Disord 13, 133–141. [DOI] [PMC free article] [PubMed] [Google Scholar]
- Yoon Y, Kim S, Seol Y, Im H, Park U, Han HB, Choi JH, Ryu H, 2022. Increases of Phosphorylated Tau (Ser202/Thr205) in the Olfactory Regions Are Associated with Impaired EEG and Olfactory Behavior in Traumatic Brain Injury Mice. Biomedicines 10. [DOI] [PMC free article] [PubMed] [Google Scholar]
Associated Data
This section collects any data citations, data availability statements, or supplementary materials included in this article.
Supplementary Materials
Data Availability Statement
All study data are included in the article and/or the Supplementary Materials.