Abstract
Background:
Understanding the global burden of gout in the past and future can provide important references for optimizing prevention and control strategies in healthcare systems.
Objectives:
This study aimed to report variations in the global disease burden and risk factors of gout in 204 countries and territories from 1990 to 2019.
Design:
We conducted a retrospective analysis of gout based on the latest Global Burden of Disease (GBD) 2019 database.
Methods:
We collected data on the prevalence, incidence, and disability-adjusted life years (DALYs) of gout from 1990 to 2019. The data were then stratified by age, sex, and economic development level. Decomposition analysis, frontier analysis, and prediction models were used to analyze the changes and influencing factors influencing each indicator.
Results:
Globally, there were 53,871,846.4 [95% uncertainty interval (UI): 43,383,204.6–66,342,327.3] prevalent cases, 92,228,86.8 (95% UI: 7419,132.1–11,521,165) incident cases, and 1673,973.4 (95% UI: 1,068,061.1–2,393,469.2) cases of DALYs of gout in 2019, more than double those in 1990. Moreover, the pace of increase in the age-standardized prevalence rate (ASPR), age-standardized incidence rate (ASIR), and age-standardized DALY rate (ASDR) accelerated during 1990–2019, with estimated annual percentage changes (EAPC) of 0.94 [95% confidence interval (CI): 0.85–1.03], 0.77 (95% CI: 0.69–0.84), and 0.93 (95% CI: 0.84–1.02), respectively, especially among men. The disease burden of gout has increased in all the other 20 GBD regions in the past 30 years, except Western Sub-Saharan Africa. The highest risk of high body mass index (BMI) and kidney dysfunction was in high-income countries such as North America and East Asia. The global prevalence rate, incidence rate, and DALYs rate of gout in 2030 will reach 599.86, 102.96 per 100,000 population, and 20.26 per 100,000 population, respectively, roughly the same as in 2019.
Conclusion:
With the development of society, the disease burden of gout will become increasingly severe. It is very important to study the accurate epidemiological data on gout for clinical diagnosis and treatment and health policy.
Keywords: decomposition analysis, frontier analysis, global disease burden, gout, prediction, risk factor
Introduction
Gout is the most common chronic inflammatory arthritis characterized by an increase in serum uric acid levels and the deposition of monosodium urate crystals in joint tissues. 1 Clinical studies have shown that gout flares are related to the transient increase in cardiovascular events after a gout attack, 2 and are independently associated with an increased risk of death from kidney disease. 3 These factors cause patients to suffer greatly. 4 The global prevalence of gout is 1–4%, and the incidence rate is 0.1–0.3%. 5 Epidemiological studies have shown that the incidence rate and prevalence of gout increase with age.
With rapid economic development and urbanization, the burden of gout has increased in many parts of the world, and the burden on the health system has also gradually increased, 6 becoming an increasingly serious public health problem. The overall planning of the health system requires careful assessment of the epidemiology of gout.
Epidemiological studies require the use of up-to-date comprehensive databases. The Global Burden of Disease (GBD) 2019 can provide the most comprehensive estimate of the gout burden to date. 7 At present, most studies on the global disease burden of gout are limited to 2017 data and prior, and some are limited to a single country, or even categorize gout for combined research.8–10
Moreover, targeted quantitative analyses of the global burden of gout in the past 30 years and future predictions are not available, which is also the key information needed for improving health policy. This study used GBD 2019 data to describe the epidemiological status of gout in various regions worldwide, study how population and epidemiologic drivers have affected changes in the burden of gout in the past 30 years, and finally predict the burden of gout in 2030.
Materials and methods
Data sources
This research queried relevant data through the Global Health Data Exchange GBD Results Tool (https://vizhub.healthdata.org/gbd-results/). We used the International Classification of Diseases 10th Revision to classify and code diseases. The disease classification code of gout is M10. 7 We selected ‘gout’ as the cause, and ‘prevalence’, ‘incidence’, and ‘disability-adjusted life years (DALYs)’ as measures. The retrieved data were further collected and analyzed according to different geographical locations, socioeconomic development levels, gender, and different age groups. All data used in this study were the latest data directly retrieved from the GBD database (most recently updated to 2019). As the GBD database is public, this research was exempt from ethical exemption.
Statistical analysis
The terms and definitions related to GBD used in this study are shown in Supplemental Table 1. The crude rate of disease (prevalence, incidence, DALYs, etc.) is one of the most basic indicators to measure the epidemiological trend of disease, but the difference in the age structure of the population may lead to the heterogeneity of the gout burden. To ensure the comparability of statistical indicators, we had to give different weights to the gross rate according to the age composition to obtain the age-standardized rate (ASR). Finally, the age-standardized prevalence rate (ASPR), age-standardized incidence rate (ASIR), and age-standardized DALY rate (ASDR) were used to estimate the gout burden.
where i represents the ith age group, ai represents the specific disease crude rate of the ith age group, and wi represents the reference standard for selection, and weight of the ith age group in the population.
We used the estimated annual percentage change (EAPC) to reflect the change trend of the ASR in a specific time period. The 95% confidence interval (CI) of the EAPC was calculated by a linear regression model. 11
where n in the formula is the number of independent variables. If both the lower limit values of the EAPC and its 95% CI are positive, the ASR is considered increasing. If the upper limit values of the EAPC and 95% CI are both negative, the ASR is declining. 12
We used the linear mixed-effects model defined by meta-regression-Bayesian, regularized trimmed (a meta-regression program) to analyze the relationship between different indicators and the sociodemographic index (SDI). 13
To reflect the annual trends in the gout burden, we calculated the EAPC in the ASPR, ASIR, and ASDR for gout worldwide from 1990 to 2019.
Spearman’s rank test was used to evaluate the relationship between the global burden of gout (ASPR, ASIR, and ASDR) and the Human Development Index (HDI) in 2019. 14 In addition, this study used the decomposition method invented by Das Gupta to quantify the impact of age structure, population growth, and epidemiological changes on the global burden of gout.15,16 To assess the relationship between the gout burden and sociodemographic development, we used the data from 1990 to 2019 to establish a frontier analysis based on the ASDR and SDI to better understand the potential improvements of the gout DALYs rate that may be achieved in a country or region. 17
The change in each result was calculated by comparing the data from 2019 with the data from 1990. Finally, descriptive analysis and a visual display of gout-related epidemiological data from 1990 to 2019 were conducted according to gender, age, region, and year.
All charts were made by R software (version 4.0.5) (R Foundation for Statistical Computing, Vienna, Austria). p Values less than 0.05 were considered statistically significant.
Results
Prevalence, incidence, and DALYs of the global gout burden from 1990 to 2019
Globally, there were 53,871,846.4 [95% uncertainty interval (UI): 43,383,204.6–66,342,327.3] prevalence cases of gout in 2019, with an ASPR of 652.2 (95% UI: 528.6–798.6) per 100,000 population, which represented a 22.4% increase since 1990 (Table 1). Moreover, there were 9,222,886.8 (95% UI: 7,419,132.1–11,521,165) incident cases of gout in 2019, with an ASIR of 111.3 (95% UI: 90–139.2) per 100,000 population, which represented an 18.0% increase since 1990 (Table 2). In addition, there were 1,673,973.4 (95% UI: 1,068,061.1–2,393,469.2) cases of gout DALYs in 2019, and the ASDR per 100,000 population was 20.2 (95% UI: 12.9–28.9), an increase of 2.2% since 1990 (Table 3). From 1990 to 2019, the EAPCs in the ASPR, ASIR, and ASDR were 0.94 (95% CI: 0.85–1.03), 0.77 (95% CI: 0.69–0.84), and 0.93 (95% CI: 0.84–1.02), respectively, which presented an increase in the GBD due to gout.
Table 1.
Prevalence and ASPR of gout in 1990 and 2019 and the temporal trends from 1990 to 2019.
| Prevalence | 1990 | 2019 | 1990–2019 | ||
|---|---|---|---|---|---|
| Location | Prevalence case No. (95% UI) | ASPR per 100,000 No. (95% UI) | Prevalence case No. (95% UI) | ASPR per 100,000 No. (95% UI) | EAPC in ASPR No. (95% CI) |
| Global | 22,063,722.9 (17,518,739.2–27,373,711.8) | 533 (425.3–657.9) | 53,871,846.4 (43,383,204.6–66,342,327.3) | 652.2 (528.6–798.6) | 0.94 (0.85–1.03) |
| Andean Latin America | 54,051.8 (42,829–67,026.2) | 231.9 (184.9–287.9) | 171,267.2 (137,241.4–211,208.4) | 292.1 (233.5–359) | 0.85 (0.82–0.89) |
| Australasia | 238,851.5 (191,389.4–295,882.3) | 1033.1 (829.4–1276.6) | 648,673.2 (518,803.3–815,671.7) | 1422.0 (1138.7–1776.6) | 1.21 (1.12–1.3) |
| Caribbean | 57,688.8 (45,543.7–71,424.6) | 209.9 (166.4–259.5) | 126,664.3 (100,884.8–156,323.4) | 247.1 (196.6–305.3) | 0.62 (0.59–0.64) |
| Central Asia | 179,199.9 (142,857.7–224,306.4) | 366.5 (290.5–458.2) | 334,316.0 (262,097.5–415,617.1) | 413.8 (329.2–516.8) | 0.41 (0.4–0.42) |
| Central Europe | 411,674 (326,215.4–519,598.4) | 286.3 (228–359.9) | 618,750.1 (487,236.1–785,554.9) | 324.8 (259.2–405.1) | 0.47 (0.44–0.5) |
| Central Latin America | 162,259.3 (126,580.7–204,848.8) | 160.5 (126.4–199.3) | 454,341.3 (358,188.3–565,603.8) | 183.8 (145.3–229.1) | 0.58 (0.52–0.65) |
| Central Sub-Saharan Africa | 112,432.8 (88,845.7–140,925) | 453.5 (361.1–570.2) | 283,785.4 (221,836.2–353,381.5) | 460.2 (364.8–573.3) | 0.01 (−0.04–0.06) |
| East Asia | 6,130,887.4 (4,862,947.2–7,601,884.3) | 629.7 (503.3–781.8) | 16,799,834.5 (13,315,687.8–21,111,760.3) | 807.4 (646.5–998.2) | 1.25 (1.08–1.42) |
| Eastern Europe | 1.005,943 (795,007–1,263,819.4) | 370.4 (294.2–463.4) | 1364,391.0 (1,080,183.5–1,718,203.4) | 423.7 (338.5–531.2) | 0.46 (0.44–0.48) |
| Eastern Sub-Saharan Africa | 374,557.9 (296,216.7–467,385.5) | 456.3 (362.2–572.5) | 905,264.6 (714,027.6–1,123,372.7) | 484 (384.5–605) | 0.2 (0.17–0.22) |
| High-income Asia Pacific | 1,320,116.4 (1,041,076.4–1,656,758.4) | 648.7 (513.8–806.6) | 2,615,785.2 (2,075,002.6–3,304,050.9) | 715.2 (568.6–894.5) | 0.36 (0.34–0.38) |
| High-income North America | 3,20,4181.4 (2,543,479.1–3,980,935.4) | 961.5 (760.6–1199.4) | 9,535,679 (8,117,193.3–11,162,463.7) | 1,722.4 (1,471.5–1999.1) | 2.73 (2.41–3.05) |
| North Africa and Middle East | 857,081.8 (681,502–1,072,546.8) | 454.6 (363.3–569) | 2455,600.9 (1,940,520.5–3,045,022.5) | 509.1 (406–633.9) | 0.33 (0.29–0.37) |
| Oceania | 23,269.3 (18,278.4–29,108.7) | 676.5 (538.8–842.3) | 60,010.6 (47,068.9–74,967.2) | 732 (577.9–918.1) | 0.23 (0.19–0.27) |
| South Asia | 2,309,929.8 (1,827,621.8–2,892,303.1) | 370 (297.2–462.1) | 5,815,980 (4,622,692.4–7,305,040.1) | 393.3 (315.2–494) | 0.17 (0.15–0.19) |
| Southeast Asia | 1,598,049 (1,276,385.7–1,975,608.9) | 551.8 (443.1–682.1) | 4,249,653.3 (3,363,354–5,302,525.9) | 646.3 (512.9–802.9) | 0.63 (0.6–0.65) |
| Southern Latin America | 344,707.2 (270,481.2–432,247.7) | 743.6 (586.6–931) | 734,805.9 (585,231.5–916,520.3) | 914.0 (724.7–1135.3) | 0.73 (0.66–0.8) |
| Southern Sub-Saharan Africa | 160,489.9 (127,299.1–201,016.1) | 540.1 (428.8–675.4) | 349,520.2 (276,725.8–437,086.3) | 574.0 (453.2–715.4) | 0.21 (0.17–0.25) |
| Tropical Latin America | 218,369.7 (172,213.9–271,950) | 210.7 (167.6–260.9) | 633,425.9 (500,450.5–782,069.2) | 256.0 (202.7–316.3) | 0.73 (0.7–0.77) |
| Western Europe | 2,859,821.8 (2,240,666.8–3,623,602.9) | 533.5 (419.8–672.7) | 4,739,826.7 (3,714,280.4–5,955,736.7) | 606.5 (476.1–764.1) | 0.56 (0.5–0.61) |
| Western Sub-Saharan Africa | 440,160.2 (348,585.6–548,759.7) | 457.0 (363.4–570.3) | 974,270.9 (773,039.5–1,214,594.7) | 447.6 (358.3–558.3) | −0.17 (−0.28–0.07) |
ASPR, age-standardized prevalence rate; CI, confidence interval; EAPC, estimated annual percentage changes; UI, uncertainty interval.
Table 2.
Incidence and ASIR of gout in 1990 and 2019 and the temporal trends from 1990 to 2019.
| Incidence | 1990 | 2019 | 1990–2019 | ||
|---|---|---|---|---|---|
| location | Incidence cases No. (95% UI) | ASIR per 100,000 No. (95% UI) | Incidence cases No. (95% UI) | ASIR per 100,000 No. (95% UI) | EAPC in ASIR No. (95% CI) |
| Global | 4,037,669.5 (3,228,464.2–5,040,716.6) | 94.3 (75.7–118.2) | 9,222,886.8 (7,419,132.1–11,521,165) | 111.3 (90–139.2) | 0.77 (0.69–0.84) |
| Andean Latin America | 11,001.8 (8,712.1–13,598.9) | 45.3 (36.4–56.1) | 33,280.5 (26,525.1–41,170.8) | 56.1 (44.8–69.4) | 0.79 (0.76–0.82) |
| Australasia | 34,154.9 (27,024.7–42,740.4) | 149.5 (118.3–187.5) | 79,343.2 (63,678.3–99,429.3) | 186.6 (150.7–233.2) | 0.82 (0.75–0.89) |
| Caribbean | 11,629.8 (9304.3–14,371.3) | 41.3 (33.1–51.1) | 24,645.9 (19,826.7–30,452.4) | 48.3 (38.9–59.4) | 0.59 (0.56–0.62) |
| Central Asia | 35,994.5 (28,621.7–45,098.8) | 71.6 (57.2–90.1) | 66,579.0 (52,454.7–83,484.6) | 79.9 (63.7–100.1) | 0.37 (0.36–0.39) |
| Central Europe | 81,735.1 (64,695.4–103,668.9) | 57.2 (45.7–71.9) | 118,648.8 (94,773.5–151,088.5) | 64.4 (51.3–81.1) | 0.45 (0.42–0.47) |
| Central Latin America | 33,077.6 (25,895.3–41,061.5) | 31.2 (24.8–38.9) | 88,882.1 (70,004.9–111,009.3) | 35.7 (28.4–44.6) | 0.6 (0.53–0.66) |
| Central Sub-Saharan Africa | 23,419.4 (18,480.6–29,554.3) | 88.1 (70.2–112.1) | 59,651.1 (47,074.3–74,579.8) | 90.1 (71.5–114.5) | 0.05 (0.01–0.09) |
| East Asia | 1,233,138.7 (975,283.9–1,532,641.3) | 122.1 (97.6–152.7) | 3,153,168.6 (2,509,139.8–4,008,345.5) | 153.2 (123.1–191.5) | 1.14 (0.97–1.3) |
| Eastern Europe | 199,658.9 (158,412.7–255,710.9) | 73.9 (59.2–93.3) | 263,542.8 (208,957.5–336,557.5) | 83.8 (67.1–105.7) | 0.43 (0.42–0.45) |
| Eastern Sub-Saharan Africa | 78,042.8 (61,979.3–98,536.6) | 89.4 (71.2–113.2) | 189,343.7 (150,163.3–236,086.8) | 94.5 (75.8–119.8) | 0.19 (0.17–0.21) |
| High-income Asia Pacific | 226,718.6 (178,890.3–283,658.1) | 111.5 (89–139.3) | 402,478.0 (321,234.9–508,454.4) | 119.1 (94.6–149.6) | 0.23 (0.2–0.26) |
| High-income North America | 449,821.9 (360,752.4–563,395) | 136.8 (109.2–170.6) | 1,111,379.4 (916,929.7–1,344,332.2) | 214.2 (178.4–256.6) | 2.18 (1.9–2.45) |
| North Africa and Middle East | 174,221.2 (139,118–217,815.4) | 88.0 (70.5–110.9) | 490,264.3 (389,867.8–606,813.4) | 97.7 (78.5–123.2) | 0.31 (0.28–0.35) |
| Oceania | 4768.4 (3771.5–5957.8) | 129.7 (104.1–164) | 12,143.9 (9535.7–15,158.3) | 139.4 (111.9–173.7) | 0.22 (0.18–0.25) |
| South Asia | 482,348.5 (382,237.3–606,641.4) | 73.5 (58.9–92.7) | 1,183,315.7 (944,271.9–1,491,888.7) | 77.9 (62.5–98.2) | 0.16 (0.14–0.18) |
| Southeast Asia | 325,640.2 (259,012.1–403,646.8) | 107 (86–133.6) | 831,398.1 (659,788.7–1,041,227.6) | 124 (99.6–155.8) | 0.58 (0.56–0.61) |
| Southern Latin America | 53,717.3 (42,998.6–67,239.7) | 114.9 (91.8–143.4) | 105,042.6 (83,794.6–131,907) | 133.5 (106.7–166.5) | 0.51 (0.46–0.56) |
| Southern Sub-Saharan Africa | 32,671.4 (26,063.7–40,782.8) | 104.9 (83.6–132.5) | 70,339.2 (56,010.5–88,718.7) | 111.3 (88.8–141.1) | 0.21 (0.18–0.25) |
| Tropical Latin America | 44,577.7 (35,530.6–55,158.8) | 41.5 (33.4–51.4) | 12,4283 (99,345.6–15,4240.9) | 50.3 (40.4–62.5) | 0.72 (0.69–0.75) |
| Western Europe | 410,863.1 (325,196.9–516,579.2) | 80 (63.4–100.2) | 612,860.8 (484,247–773,724.4) | 85.9 (68.4–107.9) | 0.31 (0.26–0.36) |
| Western Sub-Saharan Africa | 90,467.7 (72,192.5–114,115.1) | 89.5 (71.6–113.8) | 202,296.2 (160,151.2–251,195.8) | 87.3 (69.9–109.9) | −0.18 (–0.28–0.08) |
ASIR, age-standardized incidence rate; CI, confidence interval; EAPC, estimated annual percentage changes; UI, uncertainty interval.
Table 3.
DALYs and ASDR of gout in 1990 and 2019 and the temporal trends from 1990 to 2019.
| DALYs | 1990 | 2019 | 1990–2019 | ||
|---|---|---|---|---|---|
| Location | DALYs No. (95% UI) | ASDR per 100,000 No. (95% UI) | DALYs No. (95% UI) | ASDR per 100,000 No. (95% UI) | EAPC in ASDR No. (95% CI) |
| Global | 691,222 (437,421.6–993,721.8) | 16.6 (10.4–23.8) | 1673,973.4 (1,068,061.1–2,393,469.2) | 20.2 (12.9–28.9) | 0.93 (0.84–1.02) |
| Andean Latin America | 1743.2 (1096.8–2528.8) | 7.4 (4.6–10.8) | 5467.1 (3383.6–7885.8) | 9.3 (5.8–13.5) | 0.85 (0.81–0.88) |
| Australasia | 7304.7 (4644–10,557.2) | 31.7 (20.1–46.2) | 19,660.3 (12,557.9–28,111.2) | 43.5 (28–62.2) | 1.21 (1.12–1.3) |
| Caribbean | 1856.4 (1165.6–2675.1) | 6.7 (4.2–9.6) | 4007.9 (2509.4–5761) | 7.8 (4.9–11.3) | 0.59 (0.56–0.62) |
| Central Asia | 5682.3 (3531–8320.4) | 11.5 (7.2–16.8) | 10,641.9 (6721.8–15,591.5) | 13 (8.2–18.9) | 0.4 (0.39–0.42) |
| Central Europe | 12,784.3 (7992–18,542.2) | 8.9 (5.6–12.8) | 19,057.7 (12,005.3–27,776.6) | 10.1 (6.4–14.7) | 0.48 (0.46–0.51) |
| Central Latin America | 5273.1 (3262.2–7636.9) | 5.1 (3.2–7.4) | 14,593.7 (9226.4–20,928.2) | 5.9 (3.7–8.5) | 0.57 (0.51–0.63) |
| Central Sub-Saharan Africa | 3520.4 (2198.9–5110.7) | 13.9 (8.7–19.9) | 8962.3 (5634.5–12,947.4) | 14.2 (8.9–20.7) | 0.05 (0–0.1) |
| East Asia | 195,990.6 (123,365.4–282,068.2) | 19.9 (12.5–28.5) | 530,704.8 (327,808.3–765,617.9) | 25.5 (16–36.6) | 1.24 (1.08–1.41) |
| Eastern Europe | 31,037 (19,391.6–45,396.9) | 11.4 (7.1–16.6) | 42,049 (26,393.2–61,310.6) | 13.1 (8.3–19.1) | 0.48 (0.46–0.51) |
| Eastern Sub-Saharan Africa | 11,766.9 (7337.9–16,976.7) | 14.1 (8.9–20.4) | 28,605.3 (180,87.7–41,432.9) | 15 (9.5–21.9) | 0.23 (0.2–0.25) |
| High-income Asia Pacific | 41,541.6 (25,909.5–59,820.8) | 20.4 (12.8–29.3) | 81,033.3 (50,841.6–117,445) | 22.6 (14.2–32.5) | 0.37 (0.35–0.4) |
| High-income North America | 97,321.1 (62,014.9–137,443.6) | 29.4 (18.6–41.6) | 285,583.9 (187,216.9–395,014.9) | 52.3 (34.4–72.3) | 2.67 (2.37–2.98) |
| North Africa and Middle East | 27,137.2 (16,906.8–38,843.4) | 14.2 (8.9–20.4) | 77,514.4 (48,808–111,729.9) | 15.8 (10–22.7) | 0.32 (0.28–0.35) |
| Oceania | 735.9 (457.7–1060.3) | 20.9 (13.1–30.1) | 1884.7 (1170–2709.3) | 22.5 (14.2–32.4) | 0.22 (0.18–0.26) |
| South Asia | 71,904.2 (45,118.4–10,3987.4) | 11.3 (7.1–16.2) | 180,045.5 (113,781–261,292.5) | 12 (7.6–17.4) | 0.19 (0.17–0.21) |
| Southeast Asia | 50,516.6 (32,109–72,252.7) | 17.2 (10.8–24.8) | 133,986.3 (84,560.3–193,324) | 20.2 (12.7–29.1) | 0.65 (0.62–0.68) |
| Southern Latin America | 10,818.4 (6755–15,579.2) | 23.3 (14.6–33.5) | 22,861.3 (14,243.8–32,994) | 28.5 (17.9–41.2) | 0.72 (0.65–0.79) |
| Southern Sub-Saharan Africa | 5018.4 (3173.3–7228.1) | 16.7 (10.5–24.1) | 10,848.7 (6754.9–15,565.8) | 17.6 (11.1–25.5) | 0.19 (0.14–0.24) |
| Tropical Latin America | 6976.2 (4389.7–10,008.8) | 6.6 (4.2–9.4) | 20,016.6 (12,717.4–28,846.8) | 8.1 (5.1–11.5) | 0.73 (0.69–0.76) |
| Western Europe | 88,423.6 (56,175.1–129,968.5) | 16.6 (10.4–24.3) | 145,463.2 (92,307.5–212,130.5) | 18.9 (11.9–27.5) | 0.56 (0.5–0.61) |
| Western Sub-Saharan Africa | 13,869.8 (8690.6–20,006) | 14.2 (8.9–20.6) | 30,985.6 (19,518.6–44,580) | 14 (8.8–20.2) | −0.15 (−0.25–0.05) |
ASDR, age-standardized DALY rate; CI, confidence interval; DALYs, disability-adjusted life years; EAPC, estimated annual percentage changes; UI, uncertainty interval.
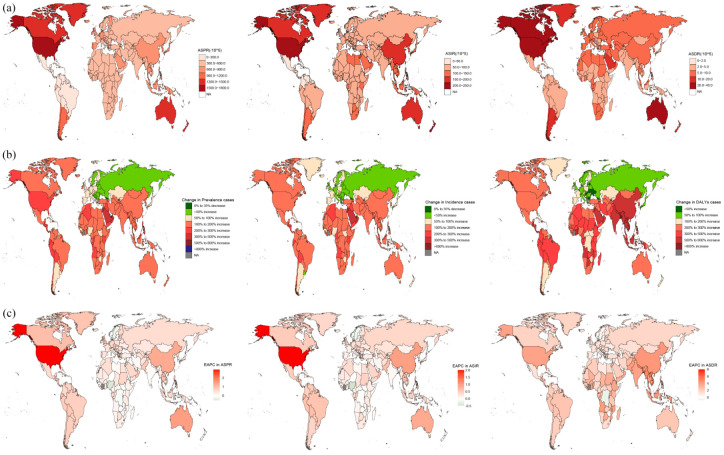
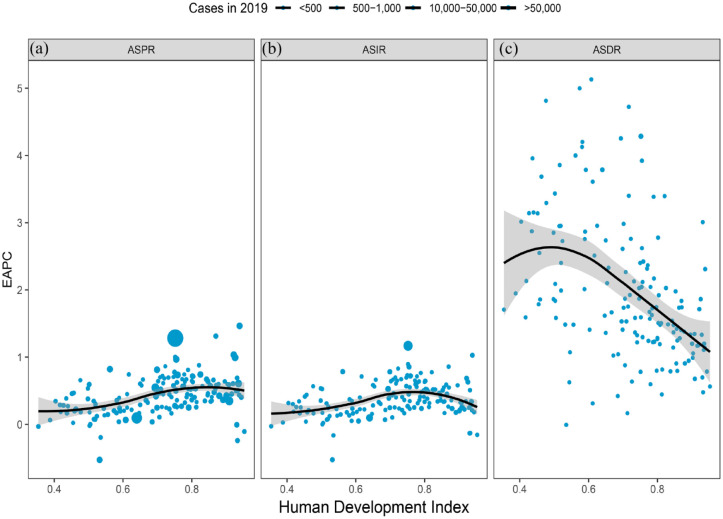
Based on 204 countries and territories, the highest gout ASPR, ASIR, and ASDR in 2019 occurred in the United States of America and were 1752 (95% UI: 1507.1–2016.7), 216.9 (95% UI: 181.5–259.9), and 53 (95% UI: 35–73.6) per 100,000 populations, respectively. Moreover, the smallest ASPR was in Nigeria (432.9 per 100,000 populations); the lowest ASIR and ASDR were found in Guatemala, which was 31.6 (95% UI: 25.2–39.5) and 5.1 (95% UI: 3.2–7.4) per 100,000 populations, respectively. Between 1990 and 2019, the United States of America experienced the greatest percentage increase in the ASPR, ASIR, and ASDR of the gout burden (85.8%, 61%, and 84.5%, respectively) among all countries, followed by Australia (44.7%, 30.3%, and 44.5%). By contrast, Nigeria had the largest percentage decline (−9.8%, −10%, and −9.4%) (Figures 1(a) and 2; Supplemental Tables 2 and 3). The number of gout prevalence, incidence, and DALYs due to gout decreased only in Georgia (−1.5%, −4.9%, and −3.6%, respectively) from 1990 to 2019. There was a positive correlation between the ASPR (r = 0.43, p = 1.495 × 10⁻⁸ < 0.001) and ASIR (r = 0.29, p = 2.368 × 10⁻⁴ < 0.001) in 2019. In addition, there was a negative correlation between the ASDR (r = −0.45, p ⩽ 2.002 × 10⁻⁹ 0.001) and SDI (Figure 2).
Figure 1.
Global gout burden in 204 countries and territories. (a) The ASPR, ASIR, and ASDR in 2019; (b) The number of prevalence, incidence, and DALYs changed between 1990 and 2019; (c) EAPC in the ASPR, ASIR, and ASDR from 1990 to 2019.
ASDR, age-standardized DALY rate; ASIR, age-standardized incidence rate; ASPR, age-standardized prevalence rate; DALYs, disability-adjusted life years; EAPC, estimated annual percentage changes.
Figure 2.
Global gout burden around 204 countries and territories by the Human development index for both genders combined in 2019. (a) ASPR, (b) ASIR, and (c) ASDR.
ASPR, age-standardized prevalence rate; ASIR, age-standardized incidence rate; ASDR, age-standardized DALY rate.
Gout burden in 21 GBD regions
Across the 21 GBD regions, the ASPR, ASIR, and ASDR in 2019 were the highest in high-income North America, with values of 1722.4 (95% UI: 1471.5–1999.1), 214.2 (95% UI: 178.4–256.6), and 52.3 (95% UI: 34.4–72.3) per 100,000 populations, respectively. The second highest was in Australia, which was 1422.0 (95% UI: 1138.7–1776.6), 186.6 (95% UI: 150.7–233.2), and 43.5 (95% UI: 28.0–62.2) per 100,000 populations, respectively. The lowest rates were found in Central Latin America, and were 183.8 (95% UI: 145.3–229.1), 35.7 (95% UI: 28.4–44.6), and 5.9 (95% UI: 3.7–8.5) per 100,000 populations, respectively (Tables 1–3).
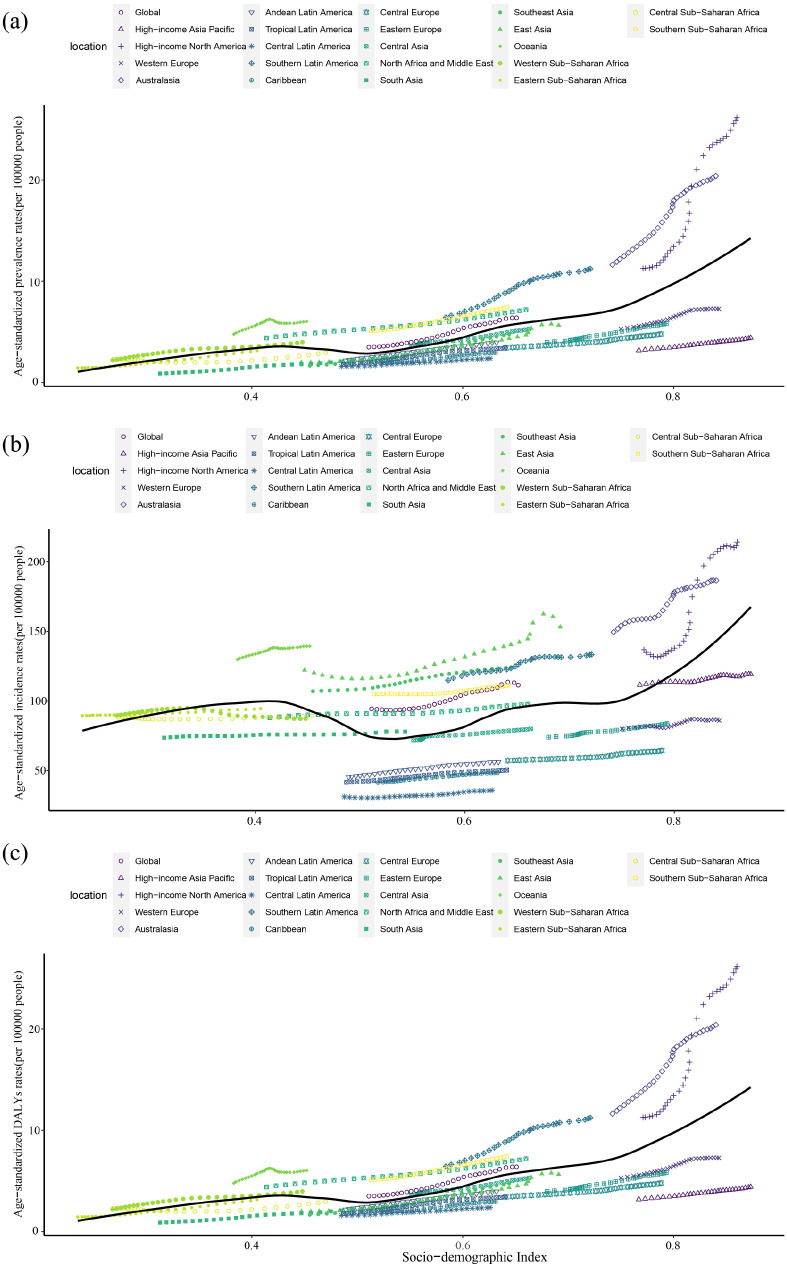
The EAPCs of the prevalence, incidence, and DALYs in Western Sub-Saharan Africa were −0.17 (95% CI: −0.28 to 0.07), −0.18 (95% CI: −0.28 to 0.08), and −0.15 (−0.25 to 0.05), respectively, from 1990 to 2019, which means that the burden of gout in Western Sub-Saharan Africa declined over time (Tables 1–3). The above results suggest that the disease burden of gout has increased in all the other 20 GBD regions over time, except in Western Sub-Saharan Africa (Figure 3).
Figure 3.
Changes in the ASPR, ASIR, and ASDR of gout globally and in different SDI regions. (a) ASPR, (b) ASIR, and (c) ASDR.
ASPR, age-standardized prevalence rate; ASIR, age-standardized incidence rate; ASDR, age-standardized DALY rate; SDI, sociodemographic index.
Gout burden in SDI regions
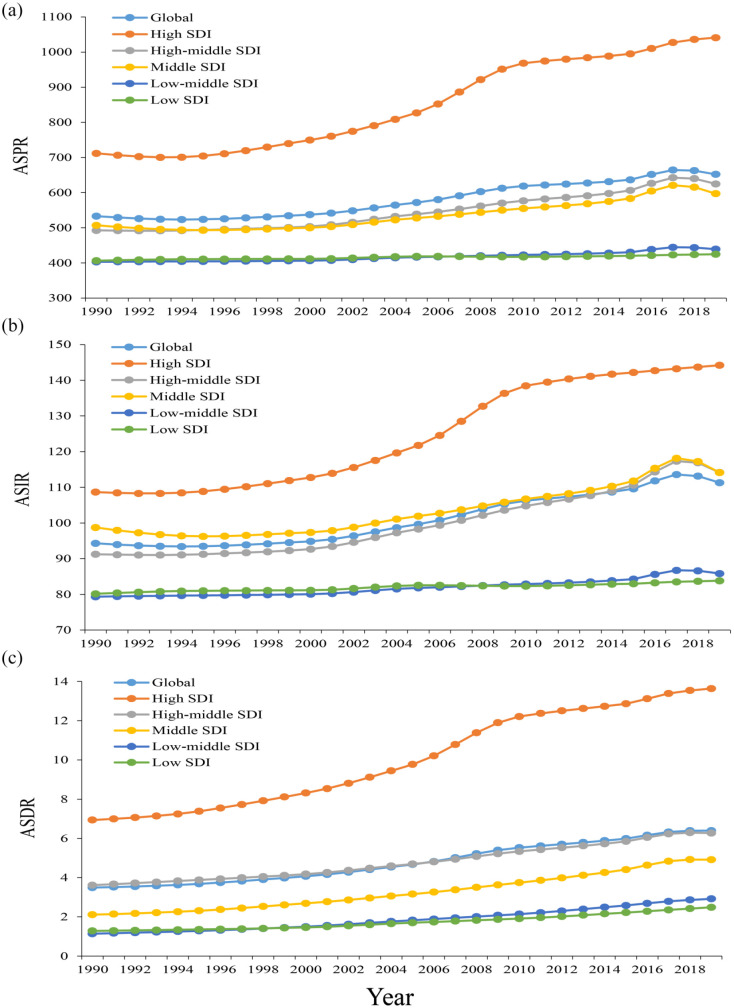
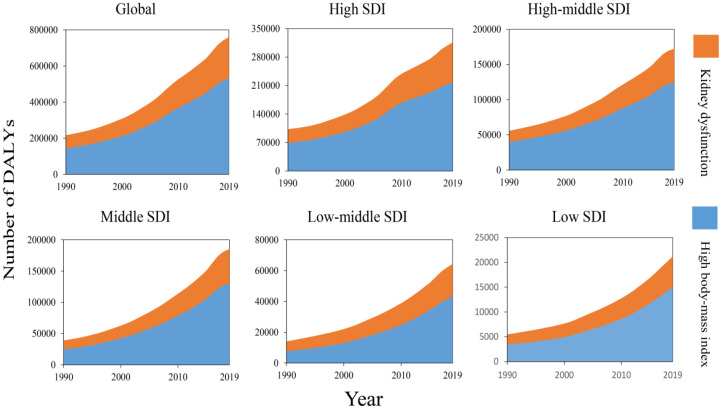
The ASPR, ASIR, and ASDR in all SDI regions increased from 1990 to 2019, which means that the burden of gout in all SDI areas has increased to varying degrees. Among them, the ASPR and ASIR increased the most in the high SDI regions (46.2% and 32.7%, respectively), and the least in the low SDI regions (4.5% and 4.6%, respectively); the ASDR had the largest growth rate (156.0%) in the low-middle SDI regions, and the smallest growth rate (73.5%) in the high-middle SDI regions especially in gout patients with high BMI (Figure 4).
Figure 4.
Changes in the ASPR, ASIR, and ASDR of gout globally and in different SDI regions from 1990 to 2019. (a) ASPR, (b) ASIR, and (c) ASDR.
ASPR, age-standardized prevalence rate; ASIR, age-standardized incidence rate; ASDR, age-standardized DALY rate; SDI, sociodemographic index.
Gout burden by age and gender
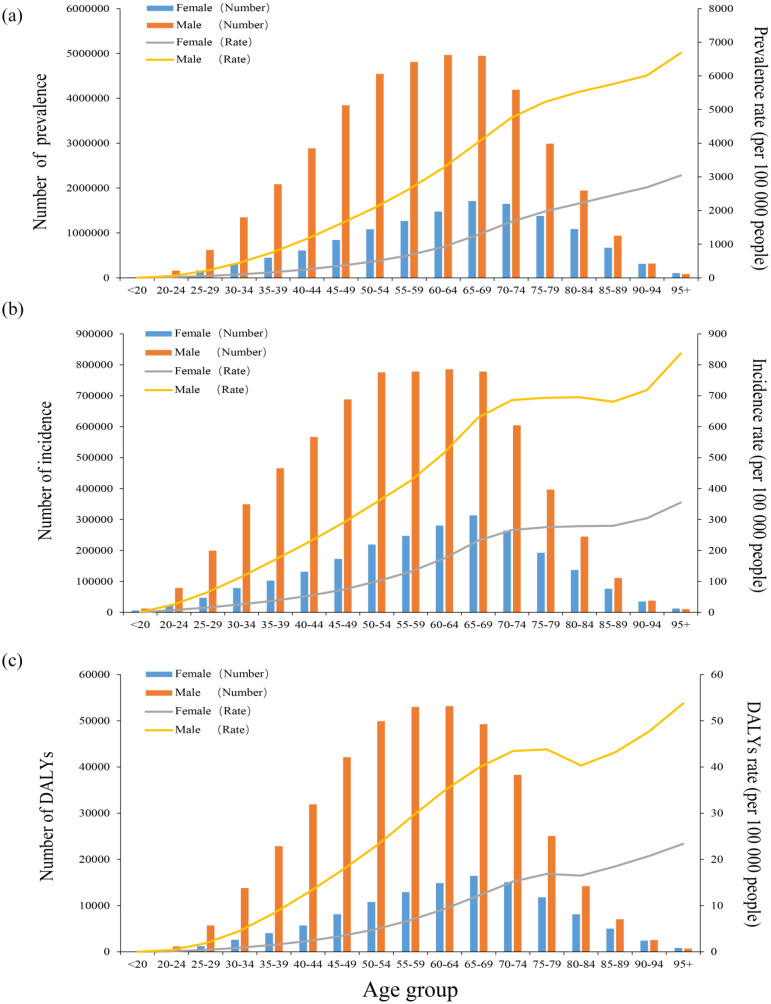
Globally, DALYs increased with age in 2019 except among those in the 75–84 age group. Females aged 65–69 years and males aged 60–64 years experienced the highest prevalence, incidence, and DALYs of gout, and men had rates 2.5–3.5 times higher than those of women (Figure 5). In the <95 age group, the prevalence, incidence, and DALYs among women were lower than those among men in the same age group, but the opposite was true among patients ⩾95 years old. In all age groups, the rate of prevalence, incidence, and DALYs rates among women were lower than those among men.
Figure 5.
Age-specific numbers and rates of prevalence, incidence, and DALYs of gout by age and gender in 2019. (a) Prevalence, (b) Incidence, and (c) DALYs.
DALYs, disability-adjusted life years.
In addition, the ASPR of men was much higher than that of women in 1990 (849.8, 95% UI: 678.9–1047 versus 250.8, 95% UI: 199.8–313.5 per 100,000 populations) and in 2019 (1031.8, 95% UI: 836.7–1261.4 versus 303.6, 95% UI: 244.5–376.2 per 100,000 populations) globally (Supplemental Table S5). The global ASIR of men in 1990 (147.5 per 100,000 population, 95% UI: 118.5–184.9) was much higher than that of women in the same period (45.7 per 100,000 population, 95% UI: 36.5–57.5). In 2019, men (172.4 per 100,000 population, 95% UI: 139.2–215.3) were also higher than women (54.2 per 100,000 population, 95% UI: 43.6–67.7) (Supplemental Table S6). Similarly, the ASDR of men was more than women in 1990 (26.4, 95% UI: 16.7–37.9 versus 7.7, 4.9–11.1 per 100,000 populations) and in 2019 (32.1, 95% UI: 20.4–45.7 versus 9.3, 95% UI: 5.9–13.3 per 100,000 populations) globally (Supplemental Table S7). Between 1990 and 2019, the global burden of gout increased more significantly among men than among women (Figure 5).
Gout-related DALYs attributable risk factors
The GBD 2019 database divides risk factors into four levels: Level 1 (3 factors), Level 2 (20 factors), Level 3 (41 factors), and Level 4 (22 factors) (Supplemental Table S11). According to searching the GBD database for the potential gout-related DALYs attributable risk factors, we found four risk factors contributing to gout-related DALYs: all risk factors, metabolic risk factors, high body mass index (BMI), and kidney dysfunction. Metabolic risks were the third leading Level 1 risk factor for attributable DALYs. High BMI and kidney dysfunction followed metabolic risk factors and all risk factors. We selected the most detailed risks for visual analysis (Figure 6).
Figure 6.
The two risk factors contributing to gout-related DALYs from 1990 to 2019 in the globe and different regions.
DALYs, disability-adjusted life years.
As shown in Figure 6. The top two regions with the highest burden of gout-related BMI and kidney dysfunction were high-income North America and East Asia. In the past 30 years, the DALYs rate of gout caused by high BMI had steadily increased in all SDI regions, and the higher the SDI level was, the larger the number of DALYs related to the gout-related BMI (Supplemental Tables S8–S10). This showed that the exposures to risk factors were highly correlated with the development of a social economy. Moreover, the global trend of gout DALYs tended to continue to increase.
Decomposition analysis of gout burden
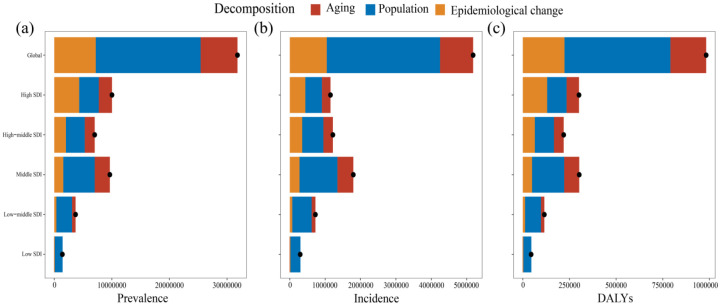
The decomposition analyses showed that from 1990 to 2019, the burden of gout measured in prevalence, incidence, and DALYs increased significantly. Globally, in 2019, there were more than 31.80 million prevalent cases of gout per year (an increase of 144.16%), 5.18 million incident cases (an increase of 128.42%), and 982,591.19 DALYs due to gout (an increase of 142.18%).
The growth of gout indicators worldwide and in five SDI regions was mainly caused by population growth; however, the prevalence (43.14%) and DALYs (43.29%) of high SDI regions were caused by an epidemiological change (Figure 7). Globally, population growth has led to 57.23%, 61.81%, and 57.76% increases in gout prevalence, incidence, and DALYs burden in the past 30 years, respectively (Supplemental Table S12). The contribution of population growth to the prevalence, incidence, and DALYs of gout was most obvious in the low SDI regions (96.68%, 96.36%, and 96.17%, respectively), followed by the low-middle SDI regions (73.45%, 75.83%, and 73.81%, respectively). Only in the low SDI regions, did aging show negative growth (−2.52%, −2.38%, and −2.53%, respectively).
Figure 7.
Decomposition analysis of gout indicators from 1990 to 2019. (a) Prevalence, (b) Incidence, and (c) DALYs. The black dot represents the overall change value of population growth, aging, and epidemiological change.
DALYs, disability-adjusted life years.
Although the prevalence, incidence rate, and DALYs of gout have increased globally and in most GBD regions, some GBD regions showed a partial deviation from this trend. At the same time, epidemiological changes occurred. For example, the overall contribution rates of aging in Western Sub-Saharan Africa, Eastern Sub-Saharan Africa, and Central Sub-Saharan Africa to the prevalence (−9.91%, −5.24%, and −3.63%), incidence (−8.23%, −4.48%, and −3.16%), and DALYs (−9.23%, −4.98%, and −3.38%) were negative. The epidemiological changes in the prevalence, incidence, and DALYs of the above three places were −3.31%, −3.53%, and −2.60%, respectively. However, the above deviations were far from offsetting the overall trend (Supplemental Table S12). The decomposition analysis of gout revealed significant heterogeneity of demographic factors and epidemiological trends. Population growth was the main driver of changes in gout indicators in most GBD areas.
Frontier analysis of gout burden
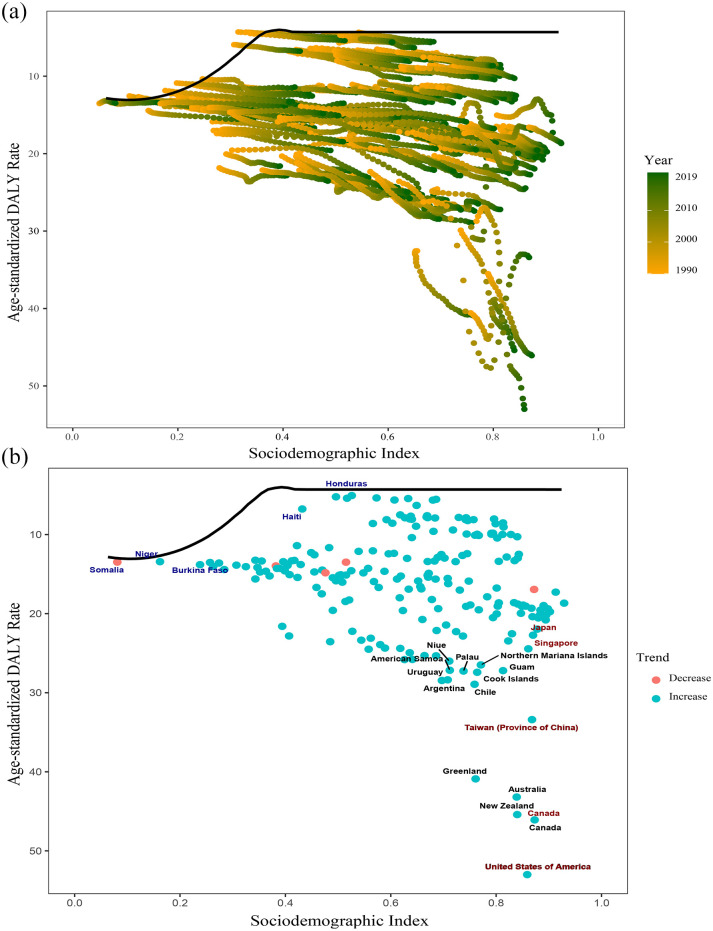
The frontier indicates the leading countries or regions (pushing the envelope at the frontier), whose SDI represents the lowest disease burden. The effective difference is defined as the distance from the frontier, which stands for the gap between the burden observed by a country or region according to its SDI and the burden of disease that may be realized. 17 The significant effective difference from the frontier indicates that there may be unrealized benefits or improvement opportunities (reduction in gout DALYs) according to the position of countries or regions in the development spectrum.
We used the 2019 DALYs and SDI to estimate the effective difference between each country and region and the border (Figure 8 and Supplemental Table S14). The top five countries or regions with the largest effective difference from their frontier (range of effective difference: 48.69–36.59) included the United States of America, Canada, New Zealand, Australia, and Greenland. Given the position in the development spectrum, the top five countries or regions with the lowest DALYs rates had the lowest effective differences (range: 0.32–1.06), including Somalia, Niger, Guatemala, Honduras, and El Salvador (Supplemental Table S14).
Figure 8.
(a) Frontier analysis based on SDI and gout DALYs rate from 1990 to 2019. (b) Frontier analysis based on SDI and gout DALYs rate in 2019.
DALYs, disability-adjusted life years; SDI, sociodemographic index.
The solid black line represents the frontier, and the dots represent the countries and regions. The blue dots indicate the upward trend, while the red dots indicate the opposite.
Prediction analysis of gout burden
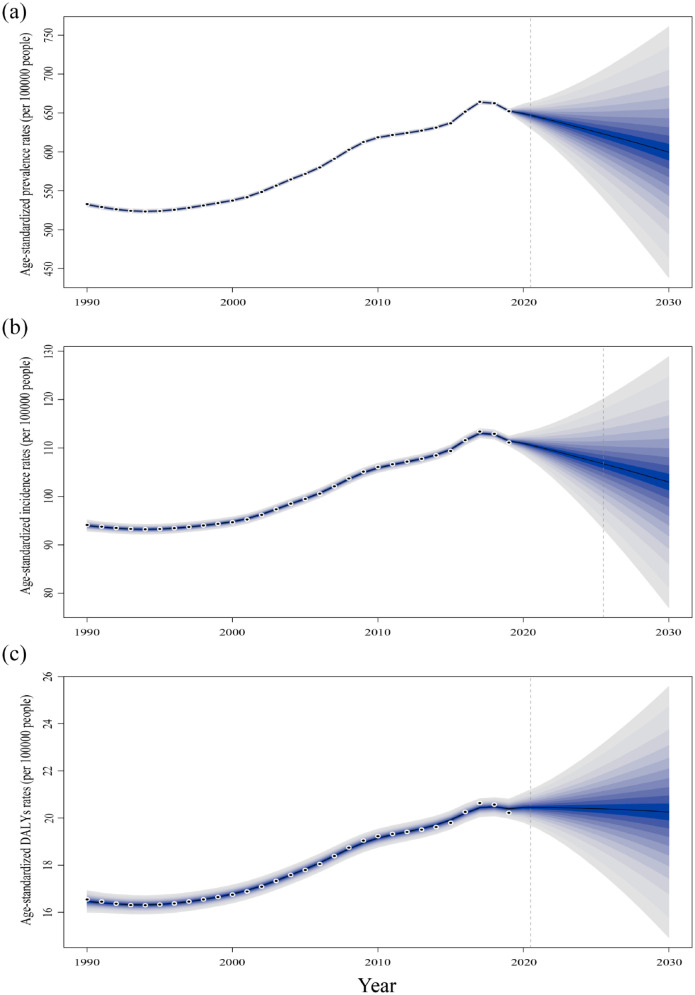
The prevalence rate, incidence rate, and DALYs rate of gout will change differently over time and in different regions. To accurately determine the true epidemiology of gout in different countries worldwide, we need to conduct higher-quality epidemiological research. According to the prediction, the future prevalence rate, incidence rate, and DALYs rate of gout in the world will be roughly the same as the current rate and will be expected to reach 599.86 per 100,000 population, 102.96 per 100,000 population, and 20.26 per 100,000 population, respectively, in 2030 (Figure 9). Compared with 2019, the epidemiological indicators in low-SDI regions and middle low-SDI regions will increase, with an increase of 6.02% to 23.17%. In addition, all indicators in other SDI areas will decrease to varying degrees except for the DALYs in the middle SDI regions (4.94%) and high-middle SDI regions (2.64%) (Supplemental Table S13). Compared with developed countries, developing countries will be more affected by gout. The above forecast shows that the burden of gout in developing countries will increase more than that in large countries in the next 11 years. The above forecast shows that developing countries will face greater pressure to increase the burden of gout disease than developed countries in the next 11 years.
Figure 9.
Projected number of new cases for all gout combined (both genders combined) in 2030 according to the SDI. (a) ASPR, (b) ASIR, and (c) ASDR.
ASPR, age-standardized prevalence rate; ASIR, age-standardized incidence rate; ASDR, age-standardized DALY rate; SDI, sociodemographic index.
Discussion
This study examined global patterns and trends of the gout burden from 1990 to 2019 in 204 countries and territories. The incidence, prevalence, and DALYs of gout in 2019 worldwide were more than twice those in 1990. In addition, the ASPR, ASIR, and ASDR increased by 22.4%, 18.0%, and 22.2%, respectively, between 1990 and 2019. Following a search of pertinent studies, we found this observation to be consistent with the results of the study conducted by Safiri et al. using the GBD 2020 (#Prevalence, Incidence, and Years Lived With Disability Due to Gout and Its Attributable Risk Factors for 195 Countries and Territories 1990–2017: A Systematic Analysis of the GBD Study 2017). While a direct comparison between their findings and ours would not have been sufficiently rigorous given the difference in data time span and application methods, they ultimately reached similar conclusions to those of the present study. Together, our findings together indicate that gout has become a major global public health problem.
There were pronounced sex and age differences in gout. The gender composition of gout patients under 65 years of age was more male than female, which was consistent with the previous study. 18 Estrogen may play a role in regulating the expression or activity of sodium urate transporters. 19 Therefore, the incidence and prevalence rates of gout among young and middle-aged women are lower than those in men. However, this advantage in women disappears after menopause. In addition to estrogen, diet may play a role by regulating inflammatory pathways. A prospective study among 730 men with gout showed a close correlation between alcohol consumption and an increased risk of gout. 20 Another study found that compared to 262 female patients, male patients (n = 1012) were more likely to have gout due to diet, such as beef, pork, seafood, and alcohol (p < 0.05). 21
Although research on gout has been ongoing for centuries, clinical studies have mainly focused on males. For example, most existing guidelines describe the male population. 22 Gout in females has received insufficient attention in research, and its representativeness in phenotype evaluation studies and clinical trials is poor. 23 Due to different risk factors (e.g. age, comorbidities, and diuretic use), the characteristics of gout in females and males greatly differ. 24 In terms of symptoms, women have a higher frequency of upper limb involvement, which may lead to delayed diagnosis and misdiagnosis. 25 Enrique Rodríguez-Sosa et al. reported that women with gout are older and have a higher risk of comorbidities such as cardiovascular, kidney, and endocrine metabolic diseases. 26 In addition, the gout-related mortality risk among women is numerically higher than that among men.27,28 Therefore, more attention needs to be paid to the prevention and treatment of gout in females in future studies.
In addition to the epidemiological trend of gout, we also investigated the potential risk factors contributing to gout-rated DALYs. Gout is a metabolic disease that is closely related to kidney dysfunction and high BMI. The basic mechanism of gout is the increase in uric acid levels after the decrease in renal excretion. 29 Lipid levels play a key role in determining serum uric acid levels. The decrease in serum uric acid levels related to weight loss may be related to the increase in renal urate excretion caused by the decrease in triglyceride levels. 30 According to the data from 5707 participants with gout aged 20 years and above in the American National Health and Nutrition Examination Survey 2007–2008, 71% of the participants had chronic kidney disease stage ⩾2, 24% had nephrolithiasis, and 53% were obese. 31
The top two regions with the highest burden of gout-associated BMI and kidney dysfunction were high-income North America and East Asia. One of the major changes driving the gout epidemic in East Asia is the rapid nutritional transformation that has occurred with rapid economic development over the last few decades. At present, the Chinese diet has changed from a high-carbohydrate diet to a high-fat diet, and the costs of diet-related noncommunicable diseases (NCDs) have exceeded the costs of malnutrition. 32 The global epidemic of NCDs originated from the Western ultra-processed food diet. 33 Ultra-processed food is positively correlated with obesity, 34 and its intake accounts for 45% of the daily calorie consumption of Canadian adults 35 and 58% of the daily energy consumption of Americans. 36 The main reason driving the gout epidemic in high-income North America was obesity caused by excessive intake of superprocessed food. The GBD 2019 has reported that health status can be improved by reducing risk factors. 37 At present, most DALYs in economically developed countries arise due to loss of functional health rather than premature mortality. 7 Addressing obesity and other key modifiable factors may prevent most gout cases among men. 38 Therefore, health systems need to be more flexible to adapt to the rapid transition from infectious and fatal diseases to NCDs and disabilities. Population growth is the key driving force for the increase in the gout burden. The change in gout burden varied with the level of development and geographical location (Supplemental Table S12). The decomposition analysis of gout-related indicators showed that the increase in the burden of gout disease was mainly driven by population growth, and the burden was borne by the developed countries with the greatest coping capacity. However, measures can be taken to reduce the burden of gout in countries and regions with different levels of development and at different stages of development in the same country and region.
Frontier analysis suggested that the burden of gout was more heavily skewed toward the United States, Canada, and other economically developed countries. This result highlighted a major challenge for the medical and health system. The frontier analysis chart showed that there were significant effective differences between DALYs and frontier gout in several countries, which means there is corresponding room for improvement. Although the health loss caused by gout was related to socioeconomic and demographic indicators, the developing countries in the frontier analysis led the way in gout-related DALYs and can serve as an example for developed countries. The above confirmed the theme that ‘development is not destiny’. The increase in the burden of gout should be reflected in the global and national health agendas to help reduce the number of patients in more regions and reduce the risk of gout and other complications.
In the 2030 prediction of this study, the burden of gout was not reduced as is the case for many other NCDs. There are several possible reasons for this. First, when patients first experienced gout, they were often misdiagnosed with sprains or infections in the past, or the diagnosis was delayed in many cases. 39 Second, due to poor medical conditions, there is a statistical deviation in the incidence rate of gout in remote areas such as Africa. 40 With the further development of medical diagnostic technology and the popularization of medical resources in remote areas, more patients with gout will be diagnosed in a timely manner. Reducing the premature mortality rate of NCDs by one-third in 2030 compared with the level in 2015 is the goal of Sustainable Development Goal (SDG) 3.4. 41 There are few cases of death caused by gout clinically. However, the SDG agenda is only a minimum platform. As an NCDs, reducing the burden of gout is an important step toward the 2030 goal. We need to take more measures to reduce the number of patients and complication risks.
This study still has several limitations to discuss. First, some deviation existed between GBD estimates of the gout burden and actual data due to the use of multiple data sources with varying quality. For example, the burden of gout may have been underestimated in low- and middle-income areas due to a lack of medical resources. Second, comorbidities such as gouty nephropathy were not considered in estimating the burden of gout but they may have affected the gout burden. Third, although the relationship between DALYs and the SDI is explanatory, it cannot be considered as a causal relationship. 42 Despite these limitations, the GBD 2019 database is valuable for health system officials to formulate interventions, address changeable risk factors, and effectively prevent gout. Fourth, the GBD database was last updated in 2019, and we urgently need the latest epidemiological data from 2023.
Gout is a highly common disease, accounting for a substantial proportion of the global disease burden. The increasing burden of gout needs global attention. Health management institutions need relevant epidemiological data for supervision within their jurisdiction to mitigate the pandemic of gout. This study provides an epidemiological data reference for health management institutions.
Supplemental Material
Supplemental material, sj-docx-1-tae-10.1177_20420188241227295 for Epidemiology of gout – Global burden of disease research from 1990 to 2019 and future trend predictions by Tingfen Han, Wenli Chen, Xiasang Qiu and Weijie Wang in Therapeutic Advances in Endocrinology and Metabolism
Acknowledgments
Thanks to Xiao Ming (Xiaoming_room@hotmail.com) for his work on the GBD database. His excellent sharing of the GBD database analysis procedure and other public databases makes it easier for us to explore the GBD database.
Footnotes
ORCID iD: Tingfen Han  https://orcid.org/0000-0001-6561-9785
Contributor Information
Tingfen Han, Department of Traditional Chinese Medicine, Taizhou Hospital of Zhejiang Province affiliated to Wenzhou Medical University, Taizhou, Zhejiang, China.
Wenli Chen, Department of Ophthalmology, Zhejiang Chinese Medical University Affiliated Wenzhou Hospital of Integrated Traditional Chinese and Western Medicine, Wenzhou, Zhejiang, China.
Xiasang Qiu, Department of Traditional Chinese Medicine, Taizhou Hospital of Zhejiang Province affiliated to Wenzhou Medical University, Taizhou, Zhejiang, China.
Weijie Wang, Department of Rheumatology, The Second Affiliated Hospital of Zhejiang Chinese Medical University, Hangzhou, Zhejiang, 310005, China.
Declarations
Ethics approval and consent to participate: Due to the public nature of the GBD database, this study was granted an ethical exemption.
Consent for publication: Consent for publication is not applicable.
Author contributions: Tingfen Han: Data curation; Writing – original draft.
Wenli Chen: Visualization.
Xiasang Qiu: Formal analysis.
Weijie Wang: Conceptualization; Supervision; Writing – review & editing.
Funding: The authors disclosed receipt of the following financial support for the research, authorship, and/or publication of this article: This research was supported by Zhejiang Medicine and Health Science and Technology Project [grant number: 2021KY843] and Young Elite Scientists Sponsorship Program by CACM [grant number: CACM2021-QNRC2-B01].
The authors declare that there is no conflict of interest.
Availability of data and materials: The raw data supporting the conclusions of this article will be made available by the authors, without undue reservation. All data used in this study were the latest data directly retrieved from GBD database (https://vizhub.healthdata.org/gbd-results/).
Supplemental material: The supplemental materials will be uploaded along with the main text.
References
- 1. Dalbeth N, Gosling AL, Gaffo A, et al. Gout. Lancet (London, England) 2021; 397: 1843–1855. [DOI] [PubMed] [Google Scholar]
- 2. Cipolletta E, Tata LJ, Nakafero G, et al. Association between gout flare and subsequent cardiovascular events among patients with gout. JAMA 2022; 328: 440–450. [DOI] [PMC free article] [PubMed] [Google Scholar]
- 3. Borghi C, Agabiti-Rosei E, Johnson RJ, et al. Hyperuricaemia and gout in cardiovascular, metabolic and kidney disease. Eur J Intern Med 2020; 80: 1–11. [DOI] [PubMed] [Google Scholar]
- 4. Terkeltaub R. Update on gout: new therapeutic strategies and options. Nat Rev Rheumatol 2010; 6: 30–38. [DOI] [PubMed] [Google Scholar]
- 5. Singh JA, Gaffo A. Gout epidemiology and comorbidities. Sem Arthritis Rheum 2020; 50: S11–S16. [DOI] [PubMed] [Google Scholar]
- 6. Rezapour A, Alidoost S, Asgharzadeh A, et al. Cost-effectiveness of allopurinol versus febuxostat in the treatment of gout patients: a systematic review. Med J Islamic Republic of Iran 2020; 34: 41. [DOI] [PMC free article] [PubMed] [Google Scholar]
- 7. GBD 2019 Diseases and Injuries Collaborators. Global burden of 369 diseases and injuries in 204 countries and territories, 1990–2019: a systematic analysis for the Global Burden of Disease Study 2019. Lancet (London, England) 2020; 396: 1204–1222. [DOI] [PMC free article] [PubMed] [Google Scholar]
- 8. Xia Y, Wu Q, Wang H, et al. Global, regional and national burden of gout, 1990–2017: a systematic analysis of the Global Burden of Disease Study. Rheumatology (Oxford, England) 2020; 59: 1529–1538. [DOI] [PubMed] [Google Scholar]
- 9. Safiri S, Kolahi AA, Cross M, et al. Prevalence, incidence, and years lived with disability due to gout and its attributable risk factors for 195 countries and territories 1990–2017: a systematic analysis of the global burden of disease study 2017. Arthritis Rheumatol (Hoboken, NJ) 2020; 72: 1916–1927. [DOI] [PubMed] [Google Scholar]
- 10. Zhu B, Wang Y, Zhou W, et al. Trend dynamics of gout prevalence among the Chinese population, 1990–2019: a joinpoint and age-period-cohort analysis. Front Public Health 2022; 10: 1008598. [DOI] [PMC free article] [PubMed] [Google Scholar]
- 11. Hankey BF, Ries LA, Kosary CL, et al. Partitioning linear trends in age-adjusted rates. Can Causes Control: CCC 2000; 11: 31–35. [DOI] [PubMed] [Google Scholar]
- 12. Bu X, Xie Z, Liu J, et al. Global PM2.5-attributable health burden from 1990 to 2017: estimates from the Global Burden of disease study 2017. Environ Res 2021; 197: 111123. [DOI] [PubMed] [Google Scholar]
- 13. GBD 2019 Demographics Collaborators. Global age-sex-specific fertility, mortality, healthy life expectancy (HALE), and population estimates in 204 countries and territories, 1950–2019: a comprehensive demographic analysis for the Global Burden of Disease Study 2019. Lancet (London, England) 2020; 396: 1160–1203. [DOI] [PMC free article] [PubMed] [Google Scholar]
- 14. Pripp AH. [Pearson’s or Spearman’s correlation coefficients]. Tidsskrift for den Norske laegeforening: tidsskrift for praktisk medicin, ny raekke 2018; 138. [DOI] [PubMed] [Google Scholar]
- 15. GBD 2019 Dementia Forecasting Collaborators. Estimation of the global prevalence of dementia in 2019 and forecasted prevalence in 2050: an analysis for the Global Burden of Disease Study 2019. Lancet Public Health 2022; 7: e105–e125. [DOI] [PMC free article] [PubMed] [Google Scholar]
- 16. Das Gupta P. A general method of decomposing a difference between two rates into several components. Demography 1978; 15: 99–112. [PubMed] [Google Scholar]
- 17. Xie Y, Bowe B, Mokdad AH, et al. Analysis of the Global Burden of Disease study highlights the global, regional, and national trends of chronic kidney disease epidemiology from 1990 to 2016. Kidney Int 2018; 94: 567–581. [DOI] [PubMed] [Google Scholar]
- 18. Wallace KL, Riedel AA, Joseph-Ridge N, et al. Increasing prevalence of gout and hyperuricemia over 10 years among older adults in a managed care population. J Rheumatol 2004; 31: 1582–1587. [PubMed] [Google Scholar]
- 19. Halperin Kuhns VL, Woodward OM. Sex differences in urate handling. Int J Mol Sci 2020; 21. [DOI] [PMC free article] [PubMed] [Google Scholar]
- 20. Choi HK, Atkinson K, Karlson EW, et al. Alcohol intake and risk of incident gout in men: a prospective study. Lancet (London, England) 2004; 363: 1277–1281. [DOI] [PubMed] [Google Scholar]
- 21. Harrold LR, Etzel CJ, Gibofsky A, et al. Sex differences in gout characteristics: tailoring care for women and men. BMC Musculoskeletal Disord 2017; 18: 108. [DOI] [PMC free article] [PubMed] [Google Scholar]
- 22. Richette P, Doherty M, Pascual E, et al. 2016 updated EULAR evidence-based recommendations for the management of gout. Ann Rheum Dis 2017; 76: 29–42. [DOI] [PubMed] [Google Scholar]
- 23. Richette P, Clerson P, Périssin L, et al. Revisiting comorbidities in gout: a cluster analysis. Ann Rheum Dis 2015; 74: 142–147. [DOI] [PubMed] [Google Scholar]
- 24. Harrold LR, Yood RA, Mikuls TR, et al. Sex differences in gout epidemiology: evaluation and treatment. Ann Rheum Dis 2006; 65: 1368–1372. [DOI] [PMC free article] [PubMed] [Google Scholar]
- 25. De Souza A, Fernandes V, Ferrari AJ. Female gout: clinical and laboratory features. J Rheumatol 2005; 32: 2186–2188. [PubMed] [Google Scholar]
- 26. Rodríguez-Sosa E, De Miguel E, Borrás F, et al. Filling gaps in female gout: a cross-sectional study of comorbidities in 192 037 hospitalised patients. RMD Open 2023; 9: e003191. [DOI] [PMC free article] [PubMed] [Google Scholar]
- 27. Teng GG, Ang LW, Saag KG, et al. Mortality due to coronary heart disease and kidney disease among middle-aged and elderly men and women with gout in the Singapore Chinese Health Study. Ann Rheum Dis 2012; 71: 924–928. [DOI] [PMC free article] [PubMed] [Google Scholar]
- 28. Dehlin M, Sandström TZ, Jacobsson LT. Incident gout: risk of death and cause-specific mortality in Western Sweden: a prospective, controlled inception cohort study. Front Med 2022; 9: 802856. [DOI] [PMC free article] [PubMed] [Google Scholar]
- 29. Mount DB. The kidney in hyperuricemia and gout. Curr Opin Nephrol Hyperten 2013; 22: 216–223. [DOI] [PubMed] [Google Scholar]
- 30. Richette P, Poitou C, Manivet P, et al. Weight loss, xanthine oxidase, and serum urate levels: a prospective longitudinal study of obese patients. Arthritis Care Res 2016; 68: 1036–1042. [DOI] [PubMed] [Google Scholar]
- 31. Zhu Y, Pandya BJ, Choi HK. Comorbidities of gout and hyperuricemia in the US general population: NHANES 2007–2008. Am J Med 2012; 125: 679–687.e671. [DOI] [PubMed] [Google Scholar]
- 32. Huang L, Wang Z, Wang H, et al. Nutrition transition and related health challenges over decades in China. Eur J Clin Nutr 2021; 75: 247–252. [DOI] [PubMed] [Google Scholar]
- 33. Lustig RH. Ultraprocessed food: addictive, toxic, and ready for regulation. Nutrients 2020; 12: 3401. [DOI] [PMC free article] [PubMed] [Google Scholar]
- 34. Mendonça RD, Pimenta AM, Gea A, et al. Ultraprocessed food consumption and risk of overweight and obesity: the University of Navarra Follow-Up (SUN) cohort study. Am J Clin Nutr 2016; 104: 1433–1440. [DOI] [PubMed] [Google Scholar]
- 35. Nardocci M, Leclerc BS, Louzada ML, et al. Consumption of ultra-processed foods and obesity in Canada. Can J Public Health = Revue canadienne de sante publique 2019; 110: 4–14. [DOI] [PMC free article] [PubMed] [Google Scholar]
- 36. Martínez Steele E, Baraldi LG, Louzada ML, et al. Ultra-processed foods and added sugars in the US diet: evidence from a nationally representative cross-sectional study. BMJ Open 2016; 6: e009892. [DOI] [PMC free article] [PubMed] [Google Scholar]
- 37. GBD 2019 Viewpoint Collaborators. Five insights from the Global Burden of Disease Study 2019. Lancet (London, England) 2020; 396: 1135–1159. [DOI] [PMC free article] [PubMed] [Google Scholar]
- 38. McCormick N, Rai SK, Lu N, et al. Estimation of primary prevention of gout in men through modification of obesity and other key lifestyle factors. JAMA Netw Open 2020; 3: e2027421. [DOI] [PMC free article] [PubMed] [Google Scholar]
- 39. Singh JA. Are the days of missed or delayed diagnosis of gout over? Nat Rev Rheumatol 2019; 15: 578–580. [DOI] [PubMed] [Google Scholar]
- 40. Mody GM. Rheumatology in Africa-challenges and opportunities. Arthritis Res Ther 2017; 19: 49. [DOI] [PMC free article] [PubMed] [Google Scholar]
- 41. NCD Countdown 2030 collaborators. NCD Countdown 2030: pathways to achieving Sustainable Development Goal target 3.4. Lancet (London, England) 2020; 396: 918–934. [DOI] [PMC free article] [PubMed] [Google Scholar]
- 42. GBD 2016 DALYs and HALE Collaborators. Global, regional, and national disability-adjusted life-years (DALYs) for 333 diseases and injuries and healthy life expectancy (HALE) for 195 countries and territories, 1990–2016: a systematic analysis for the Global Burden of Disease Study 2016. Lancet (London, England) 2017; 390: 1260–1344. [DOI] [PMC free article] [PubMed] [Google Scholar]
Associated Data
This section collects any data citations, data availability statements, or supplementary materials included in this article.
Supplementary Materials
Supplemental material, sj-docx-1-tae-10.1177_20420188241227295 for Epidemiology of gout – Global burden of disease research from 1990 to 2019 and future trend predictions by Tingfen Han, Wenli Chen, Xiasang Qiu and Weijie Wang in Therapeutic Advances in Endocrinology and Metabolism


