

Abstract
Background
Dengue is the most important arboviral disease globally and poses ongoing challenges for control including in non-endemic countries with competent mosquito vectors at risk of local transmission through imported cases. We examined recent epidemiological trends in imported and locally acquired dengue in Australia, where the Wolbachia mosquito population replacement method was implemented throughout dengue-prone areas of northern Queensland between 2011 and 2019.
Methods
We analysed dengue cases reported to the Australian National Notifiable Disease Surveillance System between January 2012 and December 2022, and Australian traveller movement data.
Results
Between 2012 and 2022, 13 343 dengue cases were reported in Australia (median 1466 annual cases); 12 568 cases (94.2%) were imported, 584 (4.4%) were locally acquired and 191 (1.4%) had no origin recorded. Locally acquired cases decreased from a peak in 2013 (n = 236) to zero in 2021–22. Annual incidence of imported dengue ranged from 8.29/100 000 (n = 917 cases) to 22.10/100 000 (n = 2203) annual traveller movements between 2012 and 2019, decreased in 2020 (6.74/100 000 traveller movements; n = 191) and 2021 (3.32/100 000 traveller movements; n = 10) during COVID-19-related border closures, then rose to 34.79/100 000 traveller movements (n = 504) in 2022. Imported cases were primarily acquired in Southeast Asia (n = 9323; 74%), Southern and Central Asia (n = 1555; 12%) and Oceania (n = 1341; 11%). Indonesia (n = 5778; 46%) and Thailand (n = 1483; 12%) were top acquisition countries. DENV-2 (n = 2147; 42%) and DENV-1 (n = 1526; 30%) were predominant serotypes.
Conclusion
Our analysis highlights Australia’s successful control of locally acquired dengue with Wolbachia. Imported dengue trends reflect both Australian travel destinations and patterns and local epidemiology in endemic countries.
Keywords: Infectious disease, notifiable disease, arbovirus, surveillance, imported infection, travel
Introduction
Over 3.9 billion people across >128 countries are at risk for dengue.1 Global incidence has increased 30-fold over the past 50 years2 and an estimated 100–400 million infections occur annually, with 70% in the Asia-Pacific region.1,3 Dengue results from infection with any of four dengue virus serotypes (DENV-1 to DENV-4), which are transmitted to humans by Aedes aegypti and Aedes albopictus mosquitoes.2 While many infections are asymptomatic, severe disease may occur. There are no approved antivirals and treatment is supportive.2 Two dengue vaccines, Dengvaxia and Qdenga, are currently available with varying recommendations and safety implications.
Urbanization and climate change have expanded the geographic range of dengue virus and its mosquito vectors.4 Transmission dynamics vary, with year-round transmission, seasonal and periodic epidemics occurring in different settings.1,4 Dengue is the leading cause of febrile illness in returned travellers from all continents except Africa,5 and importation by travellers can drive outbreaks in non-endemic areas with competent vectors.2,6 Australia is not dengue endemic, but importation by viraemic travellers has led to local transmission and periodic outbreaks in areas of northern Queensland with competent vectors.7–9
Randomized and non-randomized field trials in multiple countries over the past decade have demonstrated the effectiveness of the Wolbachia replacement method in significantly reducing dengue transmission,10–14 when used as an adjunct to existing strategies including vector surveillance and control, mosquito avoidance, disease surveillance, case management, education and emergent vaccination programmes. Field releases of Wolbachia-infected Ae. aegypti as a method for controlling dengue were first conducted in two suburbs of Cairns, in northern Queensland in 2011,7,15 with the aim of stably introducing the maternally inherited intracellular bacterium Wolbachia into the local Ae. aegypti population and thereby reducing the mosquitoes’ ability to transmit dengue and other arboviruses.16 Phased deployment of Wolbachia mosquitoes throughout areas of northern Queensland between 2011 and 2019 has significantly reduced local dengue transmission, with sustained high levels of Wolbachia mosquitoes and the effective elimination of autochthonous dengue transmission as a public health concern.7,15,17
In the Australian context, analysis of dengue surveillance data enables both an evaluation of imported dengue trends and the impact of public health control initiatives in areas with local dengue transmission. We report on the epidemiological trends in imported and locally transmitted dengue in Australia from January 2012 to December 2022, and contextualize our findings with broader dengue epidemiological trends in the Asia-Pacific region and Wolbachia mosquito releases in northern Queensland.
Methods
Data sources
Dengue cases in Australia
We collated de-identified data on all laboratory-confirmed and clinically diagnosed dengue cases notified to the National Notifiable Disease Surveillance System (NNDSS) between 1 January 2012 and 31 December 2022. Data were provided by the Australian Government’s Office of Health Protection in July 2023. Details of variables obtained are in Table S1.
Wolbachia implementation
We gathered data on Wolbachia mosquito release timelines in northern Queensland from published sources15,17 and operational data provided by the World Mosquito Program.
Traveller movement estimates
We sourced Australian traveller movement data from 2012 to 2022 from the Australian Bureau of Statistics (ABS) (Table S1, available at JTM online). Traveller movements are defined not by individual travellers or trips but rather by international border crossings categorized as short-term (<12 months overseas) resident departures (STRD; 2012–17) and returns (STRR; 2017–22).
Countries were grouped into geographical regions according to the Standard Australian Classification of Countries 2016 (Table S1, available at JTM online).
Dengue cases in other countries of interest
Where available, we collated publicly accessible data on dengue cases notified to national Departments of Health, other relevant national agencies or to the World Health Organisation for the most common countries of dengue acquisition (Table S2, available at JTM online). We searched PubMed, Google Scholar and Google databases to identify academic papers and reports documenting dengue epidemiology and/or burden of disease data, which were used when other surveillance data were unavailable.
Epidemiological analysis
We estimated the number and annual incidence rate of imported dengue cases in Australia nationally and by jurisdiction. Region-specific incidences were calculated for the top three dengue acquisition regions and country-specific incidences for the top 10 countries of acquisition. We calculated incidence rates for imported cases by annual traveller movements using the number of imported cases as the numerator and ABS traveller movement data as the denominator. We calculated the annual local incidence of dengue for the top acquisition countries using national case numbers as the numerator and population data for each country as the denominator (Table S1, available at JTM online).
The project was approved by the Monash University Human Research Ethics Committee (project #28955) and Communicable Disease Network Australia jurisdictional members. Data were analysed using STATA version 15 (StataCorp. 2017. Stata Statistical Software: Release 15. College Station, TX: StataCorp LLC).
Results
Between 1 January 2012 and 31 December 2022, a total of 13 343 dengue cases were notified to the NNDSS (median 1466 cases; range 11–2238). Of these, 12 568 cases (94%) were imported, 584 (4%) were locally acquired and 191 (1%) had no origin recorded.
Locally acquired dengue cases
Locally acquired cases decreased over time from a peak of 236 cases in 2013 to zero cases in 2021 and 2022 (Figure 1). Queensland (QLD) accounted for the vast majority of locally acquired cases (n = 560; 96%) (Table 1). Males accounted for 312 cases (53%) and 210 cases (36%) were in adults aged 40–59 years (Table 1). Dengue virus serotype data were available for 78% (n = 459) of cases, with DENV-1 predominating (n = 392, 67%), except in 2016 and 2019, when DENV-2 was more frequent (Figure 1).
Figure 1.
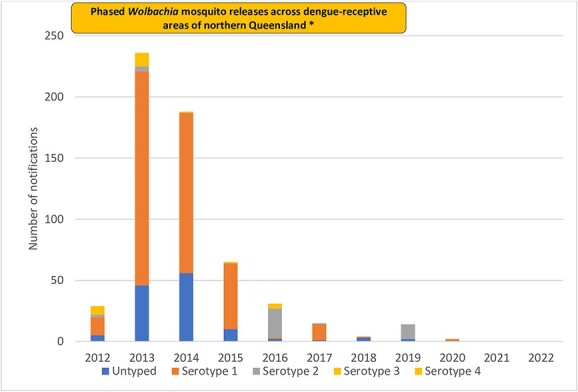
Number of locally acquired dengue cases and dengue serotype, Australia 2012–22. *Pilot releases of Wolbachia mosquitoes in two suburbs of Cairns occurred in 2011, followed by phased releases across urban areas of northern Queensland in 2013–201915,17
Table 1.
Epidemiological characteristics of notified dengue cases, Australia 2012–2022
| Characteristics | Locally acquired dengue cases N = 584 (%) |
Imported dengue cases N = 12 568 (%) |
Cases with no origin recorded N = 191 (%) |
|---|---|---|---|
|
Sex Male Female NI |
312 (53) 272 (47) |
6437 (51) 6107 (49) 26 (<1) |
101 (53) 88 (46) 2 (1) |
|
Age < 5 years 5–19 years 20–39 years 40–59 years ≥60 years |
5 (<1) 79 (14) 198 (34) 210 (36) 92 (16) |
83 (<1) 1090 (9) 5243 (42) 4536 (36) 1616 (13) |
1 (<1) 10 (5) 100 (52) 58 (30) 22 (12) |
|
Jurisdiction ACT NSW NT QLD SA TAS VIC WA |
0 (0) 5 (<1) 0 (0) 560 (96) 6 (1) 0 (0) 9 (2) 4 (<1) |
201 (2) 3079 (24) 446 (3) 1941 (15) 587 (5) 142 (1) 2831 (23) 3341 (27) |
18 (9) 16 (8) 0 (0) 9 (5) 0 (0) 1 (1) 144 (75) 3 (2) |
|
Dengue virus serotype 1 2 3 4 Mixed NI |
392 (67) 43 (7) 22 (4) 2 (<1) 0 (0) 125 (21) |
1526 (12) 2147 (17) 997 (8) 419 (3) 54 (<1) 7425 (59) |
13 (7) 22 (11) 10 (5) 5 (3) 8 (5) 133 (70) |
Abbreviations: ACT: Australian Capital Territory; NSW: New South Wales; NT: Northern Territory; QLD: Queensland; SA: South Australia; TAS: Tasmania; VIC: Victoria; WA: Western Australia; NI: no information
Imported dengue cases
Imported cases were primarily acquired in SE Asia (n = 9323; 74%), followed by Southern and Central Asia (n = 1555; 12%) and Oceania (n = 1341; 11%) (Table S3, Figure S1a, available at JTM online). Young adults aged 20–39 years were the most frequently affected (n = 5243; 42%), with males comprising 51% (n = 6437) of cases (Table 1). Between 2012 and 2019, the estimated incidence of imported dengue notifications ranged from 8.29/100 000 (n = 917 cases) to 22.10/100 000 (n = 2203) annual traveller movements, with a peak in 2016 (Figure 2). Notification incidence decreased in 2020 [6.74/100 000 traveller movements (n = 191 cases)] and 2021 [3.32/100 000 traveller movements (n = 10)], coinciding with COVID-19-related international border closures and travel restrictions. In 2022, notification incidence rebounded to 34.79/100 000 (n = 504) traveller movements (Figure 2). By jurisdiction, Western Australia reported the most cases (n = 3341; 27%, Table 1), but notification incidence was greatest in the Northern Territory (NT) (mean 51/100 000 traveller movements) (Figure S1b, available at JTM online). From 2012 to 2016, the highest notification incidence by region was observed in travellers to Southeast (SE) Asia, whereas from 2017 onwards it was greatest for travellers to Southern and Central Asia (Figure 2). Imported dengue case notifications from all regions were low in 2020 and 2021, but a rebound was seen in 2022, particularly in travellers to Southern and Central Asia (Figure 2; Table S3, available at JTM online).
Figure 2.
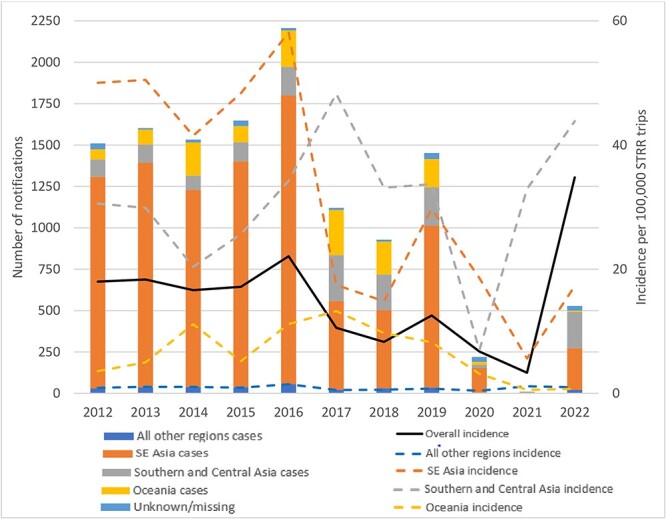
Number and notification incidence of imported dengue cases, Australia 2012–22. Abbreviations: STRR: short-term resident return; SE: Southeast. Vertical bars depict the number of cases by region and use the left y-axis, while the lines depict the overall (solid line) and regional (dotted line) notification incidences per 100 000 STRR trips and use the right y-axis. All other regions include Northwest Europe, Southern and Eastern Europe, North Africa and the Middle East, Sub-Saharan Africa, Northeast Asia
The top 10 countries of dengue acquisition were Indonesia (46%; n = 5778, peak notification year 2016), Thailand (12%; n = 1483 cases, peak in 2012), India (6%; n = 803, peak in 2017), the Philippines (4%; n = 550, peak in 2019), Malaysia (3%; n = 435, peaks in 2014 and 2015), Sri Lanka (3%; n = 426, peak in 2017), Fiji (3%; n = 370, peak in 2019), Vietnam (2%; n = 297, peak in 2019), Papua New Guinea (PNG) (2%; n = 280, peak in 2016) and Timor-Leste (2%; n = 246, peak in 2012) (Figure 3; Figure S2, Table S3, available at JTM online). Figure 4 displays the average, lowest and highest annual incidences (per 100 000 tmy) for these countries from 2012 to 2019; Indonesia, Sri Lanka and PNG exhibited both the highest average incidence and widest range during this period.
Figure 3.
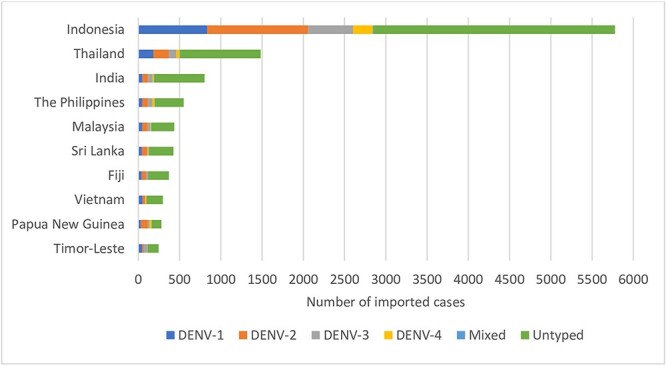
Top 10 countries of acquisition by DENV serotype for imported dengue cases, 2012–22. Abbreviations: DENV: Dengue virus. Ranking is based on number of cases imported from each country
Figure 4.
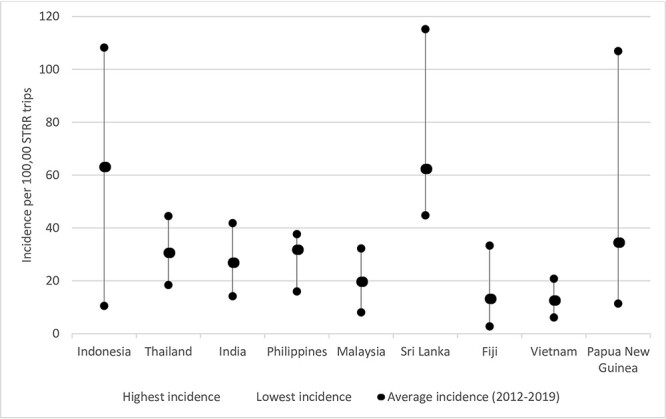
Lowest, highest and average incidence (per 100 000 traveller movements) for top countries of acquisition, 2012–19. Abbreviations: STRR: short-term resident return. STRR trips are obtained for each country from ABS data. Data for Timor-Leste not available. Average data for 2012 to 2019 only included as expected decreases in incidence occurred in 2020 following implementation of travel restrictions due to the COVID-19 pandemic
Serotype data were available for 41% (n = 5143) of imported cases, with DENV-2 (n = 2147; 42%) and DENV-1 (n = 1526; 30%) the predominant serotypes (Table 1). The dominant serotype varied by region and year (Figures S3 and S4, available at JTM online). DENV-2 was the most common serotype from all regions except for the Americas (DENV-1) (Figure S4, available at JTM online), and in all years except 2013–14 (DENV-1), 2020 (DENV-1) and 2022 (DENV-3) (Figure S3, available at JTM online).
Country-specific notification incidence rates for cases imported to Australia generally followed quite similar patterns to local dengue incidence, especially for Indonesia, Thailand, Malaysia, Vietnam, Singapore, India, Sri Lanka and Fiji (Figure 5).
Figure 5.

Estimated notification incidence of imported dengue in returned Australian travellers and estimated local incidence of dengue for countries of interest, 2012–22. Abbreviations: STRR: Short term resident return. The solid line represents the incidence in returned travellers and follows the left y-axis. The dashed line represents country specific local incidence and follows the right y-axis. Country-specific dengue case data derived from surveillance data for Indonesia, Thailand, India, Sri Lanka, Malaysia, Vietnam, The Philippines. Local incidence data for Fiji obtained from surveillance reports (Appendix, Table S1) and the literature.53 Data for local dengue cases not available for 2015 for Fiji. Data for local dengue cases not available for 2020 for Fiji. Data for local dengue cases not available for 2021 for Fiji. Data for local dengue cases not available for 2022 for Indonesia, Sri Lanka, Fiji. Data for local dengue cases for Vietnam available until 19th November 2020, 19th December 2021 and 12th December 2022. National dengue data not available for PNG or Timor-Leste. Traveller movement data not available for Timor-Leste. Singapore included given its status as the only other dengue endemic country in the top ten most frequented travel destinations (Appendix, Table S4).
Discussion
Our study provides insights into trends in imported and locally acquired dengue in Australia over the last decade, a period marked by record dengue outbreaks in many countries, including in the Asia Pacific.18 Dengue is among the most frequently imported infections to Australia,19 and importation into areas of northern Queensland with competent mosquito vectors has historically led to secondary transmission and local outbreaks. We found that imported dengue notifications rose from 2012 to 2016, with peak notification years in 2016 and 2019 aligning with global trends,18 while locally acquired dengue cases declined to zero concurrent with the implementation of the Wolbachia method in northern Queensland. A sharp decline in imported cases from 2020 to 2021 corresponded with border closures and travel restrictions imposed due to the COVID-19 pandemic. Imported case notifications increased in 2022 following reopening of Australia’s borders, but locally acquired cases remained absent. Although DENV serotype distribution varied by region and year, our findings are consistent with a systematic review indicating DENV-2 and DENV-1 as the most common observed serotypes in outbreaks globally from 1990 to 2015.20
These broad trends are consistent with studies from other non-endemic settings. In the USA, imported cases increased from 2012 to 2016 and were high in 2019.21 In Europe, imported dengue case numbers remained relatively stable between 2015 and 2018 before a significant increase in 2019.22,23 However, Australia’s geographic location and the unique travel patterns and migration trends of Australians underpin some notable differences. We found that Asia and Oceania were the most common regions of acquisition, contrasting with the USA, where cases are primarily imported from the Americas.24,25 Similarly, we saw very few cases from Africa, which tends to contribute a higher proportion of imported cases to both the USA and Europe.22,24 These findings highlight the value of Australian dengue surveillance in providing sentinel information on circulating DENV serotypes and outbreaks in acquisition countries, especially in Asia and Oceania. These data can support surveillance programmes in countries with limited resources and surveillance capabilities and assist with risk assessment for travellers to these endemic regions.
Almost two-thirds (64%) of imported cases to Australia originated from Indonesia, Thailand and India, reflecting their popularity as travel destinations and aligning with previous research implicating them as common sources of imported dengue cases globally.24 Importation trends generally aligned with local dengue epidemiology, consistent with previous GeoSentinel reports indicating that dengue trends in returned travellers often mirror local outbreaks in destination countries.26,27 Anomalies in reported dengue incidence in Australia can thus serve as global alerts, signalling possible outbreaks to specific countries and the global health community.
Data regarding specific locations where Australians acquire dengue within Indonesia, where the Wolbachia method has been implemented in the Special Region of Yogyakarta in Java11 and further expansion is planned, are not available. However, Bali, which reports the highest annual dengue incidence in Indonesia28 and is a popular travel destination for Australians, is likely an important source of importations.18 Relatively low dengue incidence in Indonesia in 2017–18, potentially combined with a decline in tourism following the 2017 eruption of Bali’s Mt. Agung volcano,29 was reflected in lower imported dengue rates from Indonesia in 2017–18. India experienced large dengue outbreaks in 2021 and 2022, correlating with a marked increase in imported cases to Australia in 2022. This coincided with travel to India rebounding to 77% of 2019 levels. Almost 3% of the Australian population were born in India (Table S1, available at JTM online), making it a common travel destination, particularly for ‘visiting friends and relatives’ travellers.30 Trends seen for other common acquisition countries, such as the Philippines and Sri Lanka, likely reflect a combination of migration and travel trends, alongside a high local disease burden.31,32 Reasons for some inconsistencies in imported dengue incidence compared to local epidemiology (e.g. for Thailand in 2015) remain uncertain but might reflect spatial variability in local dengue incidence in destination countries.
Oceania (n = 1341 cases; 11%) was well represented as a source of dengue acquisition, with Fiji and PNG contributing almost half of all cases from this region. Interestingly, despite travel to Fiji returning to 92% of 2019 levels in 2022, only two imported cases were reported. The reasons for this are uncertain, but a possible contributing factor could be a true decrease in local incidence related to implementation of the Wolbachia method throughout Fiji’s three largest cities Suva, Nadi and Lautoka in 2018–19.33 Lack of robust national surveillance data from certain countries in Oceania highlights the value of Australian traveller data in discerning regional dengue trends.
Despite high numbers of imported dengue cases between 2012 and 2019, we observed a substantial reduction in locally acquired dengue cases in Australia over time. This almost certainly reflects the successful large-scale roll-out of Wolbachia mosquitoes in northern Queensland between 2013 and 2019. Long-term monitoring data indicate that Wolbachia has been self-sustaining at a high prevalence in local mosquito populations for a decade post-release.34 The most recent locally acquired dengue outbreak in Queensland occurred in Rockhampton in 2019 (13 laboratory-confirmed cases),35 an area where Wolbachia mosquitoes were not deployed. This marked the first locally acquired dengue outbreak in Central Queensland in 65 years, emphasizing the need for ongoing monitoring of areas in Australia with potential for local transmission. Given the absence of competent vectors outside QLD, the small number of locally acquired cases (n = 24) notified by other jurisdictions are potential misclassifications.
The success of the Wolbachia method in interrupting local dengue transmission in Australia is an encouraging development for other non-endemic settings with competent mosquito vectors like the USA and Europe, where sporadic outbreaks occur following importation.21,22,36 Globalization and climate change have led to geographic expansion of vectors,4 resulting in an increase in autochthonous dengue cases and outbreaks, including in areas not previously reporting local transmission.37–41 For example, the USA has seen a rise in locally acquired cases since 2020, including California’s first locally acquired case in October 2023,42 despite a decrease in imported cases due to COVID-19-related travel restrictions.21 Continuing geographic expansion of Ae. aegypti vectors and the dengue virus is predicted,43,44 presenting substantial challenges in prevention and control efforts. The World Mosquito Program33 and others45,46 have undertaken Wolbachia mosquito releases in at least 13 dengue-endemic countries and one non-endemic country (Australia) to date. Further scale-up of the Wolbachia method in Indonesia is underway, and the impact of this initiative on the incidence of dengue among Australian travellers to Indonesia in the years ahead will be of particular interest. The Wolbachia method also has important implications for control of other arboviral infections,4 as laboratory studies have demonstrated that Wolbachia can modulate replication of yellow fever, Zika and chikungunya viruses in Ae. Aegypti mosquitoes.47
Dengue vaccines hold promise for reducing the epidemiological and economic burden of dengue in endemic areas, especially when integrated into a multifaceted approach including surveillance and vector control. However, their use in travellers is unclear. At present, two live attenuated tetravalent dengue vaccines, Dengvaxia and Qdenga, are commercially available in a number of countries. For both vaccines, phase III efficacy trials were conducted among children in dengue-endemic settings and data are limited outside of this population.48 Safety concerns around the use of Dengvaxia limit its utility in dengue-naïve individuals, including most travellers, and it has never been commercially available in non-endemic countries.49 For Qdenga, vaccine efficacy differs by serostatus and infecting serotype, with lower efficacy observed in individuals seronegative for dengue at baseline, especially against DENV-3 or DENV-4.50 In September 2023, the WHO recommended Qdenga be considered in routine immunization programmes in countries with high dengue transmission intensity.49 The benefit in travellers is likely to be for long-term or frequent travel to high-risk destinations in dengue-experienced travellers.49 However, there are potential limitations for dengue-naïve travellers heading to areas where DENV-3 and DENV-4 circulate. While our dataset showed DENV-2 and DENV-1 were predominant among typed cases notified in Australia in 2012–22, DENV-3 and DENV-4 still accounted for a substantial proportion of cases, and DENV-3 has re-emerged in recent large outbreaks in Bangladesh51 and Brazil.52 DENV serotype data are limited in endemic country national surveillance reports, highlighting a need for enhanced serotype surveillance to guide risk assessment of travellers as well as dengue prevention and control efforts.
Limitations
Limitations of our study include incomplete data on some variables such as region of acquisition and characterization of DENV serotypes. Data captured in the NNDSS are dynamic and subject to retrospective revisions; therefore, the presented data represent a point-in-time analysis of DENV case notifications and may vary from data reported in published NNDSS and jurisdictional reports covering the same period. Notably, other variables of interest such as visitor and immigrant status, pre-travel healthcare, purpose and duration of travel and clinical data are not systematically collected by the NNDSS. This dataset may underestimate the denominator for imported dengue cases as it does not include visitors or migrants entering Australia. In addition, due to the short incubation period of dengue, Australian travellers diagnosed with dengue while overseas might not have been captured in the reported surveillance data. Despite these constraints, our results are based on a large national dataset and provide the most complete record of dengue notification trends over the last decade in Australia. However, since dengue importation is influenced by traveller demographics and destination preference, which can be dynamic and unpredictable, the trends observed in this study may not be generalisable to future patterns. Nonetheless, they highlight the importance of considering country-specific dengue epidemiological trends when assessing travel-associated health risks for travellers.
Conclusion
Our study highlights that notification trends of imported dengue in Australia reflect the travel destinations and patterns of Australian travellers, together with the local epidemiology in endemic countries. Six of the top 10 destinations for Australian travellers in 2022 are highly endemic for dengue, highlighting the importance of ensuring travellers are aware of the risk of dengue and the need to protect themselves from mosquito bites. These findings can aid travel health practitioners to undertake detailed risk assessments and provide accurate education and advice to Australian travellers.
Traditionally, public health measures for dengue prevention and control have encompassed prompt case identification, vector surveillance and control, and human behavioural measures sure as mosquito avoidance. More recently, vaccination programmes have been introduced, with endemic and non-endemic countries employing a mix of approaches depending on their local contexts. The implementation of the Wolbachia method in northern Queensland and other Asia-Pacific and Latin American countries over the past decade has proven its public health value for dengue control. Expanding its implementation in both endemic and non-endemic areas has the potential to achieve sustained control of dengue and other Aedes-borne viruses, benefiting not only local communities but also travellers to these areas.
Funding
This work was supported by the National Health and Research Council (NHMRC) Postgraduate Scholarship (grant number 2002792 to AS); NHMRC Fellowship (grant number APP1155005 to KL); NHMRC Investigator Grants (grant number 2017229 to SLM) and the Wellcome Trust (grant number 224459/Z/21/Z to KA). The NHMRC was not involved in study design; in the collection, analysis and interpretation of data; in the writing of the report; and in the decision to submit the paper for publication.
Author contributions
AS was involved in the conceptualization, data collection and curation, formal data analysis, data interpretation, investigation, methodology, validation, visualization and writing of the original draft, and review and editing of the manuscript. AS undertook the literature search and created the tables and figures in the manuscript. SLM was involved in the conceptualization, methodology, data interpretation, validation, visualization, and review and editing of the manuscript as well as provision of resources to carry out the project and supervision. KL was involved in the conceptualization, methodology, data interpretation, validation, visualization, and review and editing of the manuscript as well as provision of resources to carry out the project and supervision. SLM and KL had direct access to the data and have verified the underlying data reported in the manuscript. SLM and KL contributed equally to the project and manuscript. KLA was involved in the data collection and interpretation and literature search of the Wolbachia method as well as review and editing of the manuscript.
Author contributions
Asma Sohail (Conceptualization [Lead], Data curation [Lead], Formal analysis [Lead], Investigation [Lead], Methodology [Lead], Project administration [Lead], Validation [Lead], Visualization [Equal], Writing—original draft [Lead], Writing—review & editing [Equal]), Katherine Anders (Methodology [Supporting], Writing—review & editing [Supporting]), Sarah McGuinness (Conceptualization [Equal], Methodology [Supporting], Resources [Equal], Supervision [Equal], Validation [Supporting], Visualization [Supporting], Writing—review & editing [Equal]), and Karin Leder (Conceptualization [Equal], Methodology [Supporting], Resources [Equal], Supervision [Equal], Validation [Supporting], Visualization [Supporting], Writing—review & editing [Supporting])
Conflict of interest: The authors do not declare any conflicts of interest.
Data availability statement
Data collected for this study will not be made available to other parties.
Supplementary Material
Results from this study were presented at The Southern Cross Travel and Tropical Medicine Conference, 2023 held in Sydney, Australia 1–3 September 2023.
Contributor Information
Asma Sohail, School of Public Health and Preventive Medicine, Monash University, 553 St Kilda Road, Melbourne, Victoria 3004, Australia; Infectious Diseases Department, Grampians Health Service, 1 Drummond Street North, Ballarat, Victoria 3350, Australia.
Katherine L Anders, School of Public Health and Preventive Medicine, Monash University, 553 St Kilda Road, Melbourne, Victoria 3004, Australia; World Mosquito Program, Monash University, 12 Innovation Walk, Clayton, Victoria 3800, Australia.
Sarah L McGuinness, School of Public Health and Preventive Medicine, Monash University, 553 St Kilda Road, Melbourne, Victoria 3004, Australia; Infectious Diseases Department, Alfred Health, 55 Commercial Road, Melbourne, Victoria 3004, Australia.
Karin Leder, School of Public Health and Preventive Medicine, Monash University, 553 St Kilda Road, Melbourne, Victoria 3004, Australia; Victorian Infectious Diseases Service, Melbourne Health, 300 Grattan Street, Parkville, Victoria 3050, Australia.
References
- 1. Brady OJ, Gething PW, Bhatt S et al. Refining the global spatial limits of dengue virus transmission by evidence-based consensus. PLoS Negl Trop Dis 2012; 6:e1760. [DOI] [PMC free article] [PubMed] [Google Scholar]
- 2. Harapan H, Michie A, Sasmono RT, Imrie A. Dengue: a minireview. Viruses 2020; 12:829. [DOI] [PMC free article] [PubMed] [Google Scholar]
- 3. Bhatt S, Gething PW, Brady OJ et al. The global distribution and burden of dengue. Nature 2013; 496:504–7. [DOI] [PMC free article] [PubMed] [Google Scholar]
- 4. Franklinos LHV, Jones KE, Redding DW, Abubakar I. The effect of global change on mosquito-borne disease. Lancet Infect Dis 2019; 19:e302–12. [DOI] [PubMed] [Google Scholar]
- 5. Camprubí-Ferrer D, Cobuccio L, Van Den Broucke S et al. Causes of fever in returning travelers: a European multicenter prospective cohort study. J Travel Med 2022; 29(2):taac002. [DOI] [PubMed] [Google Scholar]
- 6. Messina JP, Brady OJ, Scott TW et al. Global spread of dengue virus types: mapping the 70 year history. Trends Microbiol 2014; 22:138–46. [DOI] [PMC free article] [PubMed] [Google Scholar]
- 7. Ritchie SA. Wolbachia and the near cessation of dengue outbreaks in northern Australia despite continued dengue importations via travellers. J Travel Med 2018; 25:tay084. [DOI] [PubMed] [Google Scholar]
- 8. Hanna JN, Ritchie SA, Merritt AD et al. Two contiguous outbreaks of dengue type 2 in North Queensland. Med J Aust 1998; 168:221–5. [DOI] [PubMed] [Google Scholar]
- 9. Ritchie SA, Pyke AT, Hall-Mendelin S et al. An explosive epidemic of DENV-3 in Cairns, Australia. PloS One 2013; 8:e68137. [DOI] [PMC free article] [PubMed] [Google Scholar]
- 10. Utarini A, Indriani C, Ahmad RA et al. Efficacy of Wolbachia-infected mosquito deployments for the control of dengue. N Engl J Med 2021; 384:2177–86. [DOI] [PMC free article] [PubMed] [Google Scholar]
- 11. Indriani C, Tantowijoyo W, Rancès E et al. Reduced dengue incidence following deployments of Wolbachia-infected Aedes aegypti in Yogyakarta, Indonesia: a quasi-experimental trial using controlled interrupted time series analysis. Gates Open Res 2020; 4:50. [DOI] [PMC free article] [PubMed] [Google Scholar]
- 12. Velez ID, Tanamas SK, Arbelaez MP et al. Reduced dengue incidence following city-wide wMel Wolbachia mosquito releases throughout three Colombian cities: interrupted time series analysis and a prospective case-control study. PLoS Negl Trop Dis 2023; 17:e0011713. [DOI] [PMC free article] [PubMed] [Google Scholar]
- 13. Pinto SB, Riback TIS, Sylvestre G et al. Effectiveness of Wolbachia-infected mosquito deployments in reducing the incidence of dengue and other Aedes-borne diseases in Niterói, Brazil: a quasi-experimental study. PLoS Negl Trop Dis 2021; 15:e0009556. [DOI] [PMC free article] [PubMed] [Google Scholar]
- 14. Gesto JSM, Pinto SB, Dias FBS et al. Large-scale deployment and establishment of Wolbachia into the Aedes aegypti population in Rio de Janeiro, Brazil. Front Microbiol 2021; 12:711107. [DOI] [PMC free article] [PubMed] [Google Scholar]
- 15. Ryan PA, Turley AP, Wilson G et al. Establishment of wMel Wolbachia in Aedes aegypti mosquitoes and reduction of local dengue transmission in cairns and surrounding locations in northern Queensland. Australia Gates Open Res 2020; 3:1547. [DOI] [PMC free article] [PubMed] [Google Scholar]
- 16. Hoffmann AA, Montgomery BL, Popovici J et al. Successful establishment of Wolbachia in Aedes populations to suppress dengue transmission. Nature 2011; 476:454–7. [DOI] [PubMed] [Google Scholar]
- 17. O'Neill SL, Ryan PA, Turley AP et al. Scaled deployment of Wolbachia to protect the community from dengue and other Aedes transmitted arboviruses. Gates Open Res 2019; 2:36. [DOI] [PMC free article] [PubMed] [Google Scholar]
- 18. Du M, Jing W, Liu M, Liu J. The global trends and regional differences in incidence of dengue infection from 1990 to 2019: an analysis from the global burden of disease study 2019. Infect Dis Ther 2021; 10:1625–43. [DOI] [PMC free article] [PubMed] [Google Scholar]
- 19. Sohail A, Cheng A, McGuinness SL, Leder K. The epidemiology of notifiable diseases in Australia and the impact of the COVID-19 pandemic, 2012–2022. BMC Global Public Health 2024;2(1). [Google Scholar]
- 20. Guo C, Zhou Z, Wen Z et al. Global epidemiology of dengue outbreaks in 1990–2015: a systematic review and meta-analysis. Front Cell Infect Microbiol 2017; 7:317. [DOI] [PMC free article] [PubMed] [Google Scholar]
- 21. Centers for Disease Control and Prevention . Dengue: Historic Data 2010–2022 USA: Centers for Disease Control and Prevention; 2023. United States of America. https://www.cdc.gov/dengue/statistics-maps/historic-data.html.
- 22. Gossner CM, Fournet N, Frank C et al. Dengue virus infections among European travellers, 2015 to 2019. Euro Surveill 2022; 27:2001937. [DOI] [PMC free article] [PubMed] [Google Scholar]
- 23. European Centre for Disease Prevention and Control . Annual Epidemiological Report for 2021. Stockholm, Sweden: ECDC, 2023. https://www.ecdc.europa.eu/en/publications-data/monitoring/all-annual-epidemiological-reports. [Google Scholar]
- 24. Gwee XWS, Chua PEY, Pang J. Global dengue importation: a systematic review. BMC Infect Dis 2021; 21:1078. [DOI] [PMC free article] [PubMed] [Google Scholar]
- 25. Wong JM, Rivera A, Wolkman HR et al. Travel-associated dengue cases—United States, 2010–2021. MMWR Morb Mortal Wkly Rep 2023; 72:821–6. [DOI] [PMC free article] [PubMed] [Google Scholar]
- 26. Leder K. Travelers as a sentinel population: use of sentinel networks to inform pretravel and posttravel evaluation. Curr Infect Dis Rep 2009; 11:51–8. [DOI] [PMC free article] [PubMed] [Google Scholar]
- 27. Schwartz E, Weld LH, Wilder-Smith A et al. Seasonality, annual trends, and characteristics of dengue among ill returned travelers, 1997–2006. Emerg Infect Dis 2008; 14:1081–8. [DOI] [PMC free article] [PubMed] [Google Scholar]
- 28. Harapan H, Michie A, Mudatsir M, Sasmono RT, Imrie A. Epidemiology of dengue hemorrhagic fever in Indonesia: analysis of five decades data from the National Disease Surveillance. BMC Res Notes 2019; 12:350. [DOI] [PMC free article] [PubMed] [Google Scholar]
- 29. Putu Indah R, Nana T, Martin AANY. The economic impact of Mount Agung eruption on Bali tourism. In: Jie F, Yuniarta GA, Widiana IW, Suryaputra IGNA. (eds), Proceedings of the International Conference on Tourism, Economics, Accounting, Management, and Social Science (TEAMS 2018); 2019 Jan. Atlantis Press, 2019. Indonesia. [Google Scholar]
- 30. Heywood AE, Zwar N, Forssman BL et al. The contribution of travellers visiting friends and relatives to notified infectious diseases in Australia: state-based enhanced surveillance. Epidemiol Infect 2016; 144:3554–63. [DOI] [PMC free article] [PubMed] [Google Scholar]
- 31. Undurraga EA, Halasa YA, Shepard DS. Use of expansion factors to estimate the burden of dengue in Southeast Asia: a systematic analysis. PLoS Negl Trop Dis 2013; 7:e2056. [DOI] [PMC free article] [PubMed] [Google Scholar]
- 32. Shepard DS, Undurraga EA, Halasa YA. Economic and disease burden of dengue in Southeast Asia. PLoS Negl Trop Dis 2013; 7:e2055. [DOI] [PMC free article] [PubMed] [Google Scholar]
- 33. Monash University. World Mosquito Program . 2023. Australia. www.worldmosquitoprogram.org.
- 34. Ross PA, Robinson KL, Yang Q et al. A decade of stability for wMel Wolbachia in natural Aedes aegypti populations. PLoS Pathog 2022; 18:e1010256. [DOI] [PMC free article] [PubMed] [Google Scholar]
- 35. Walker J, Pyke A, Florian P et al. Re-emergence of dengue virus in regional Queensland: 2019 dengue virus outbreak in Rockhampton, Central Queensland, Australia. Commun Dis Intell 2018; 2021:45. [DOI] [PubMed] [Google Scholar]
- 36. European Centre for Disease Prevention and Control . Autochthonous Vectorial Transmission of Dengue Virus in Mainland EU/EAA, 2010-present. Sweden: ECDC, 2023. https://www.ecdc.europa.eu/en/all-topics-z/dengue/surveillance-and-disease-data/autochthonous-transmission-dengue-virus-eueea. [Google Scholar]
- 37. Rivera A, Adams LE, Sharp TM, Lehman JA, Waterman SH, Paz-Bailey G. Travel-associated and locally acquired dengue cases—United States, 2010–2017. MMWR Morb Mortal Wkly Rep 2020; 69:149–54. [DOI] [PMC free article] [PubMed] [Google Scholar]
- 38. Barzon L, Gobbi F, Capelli G et al. Autochthonous dengue outbreak in Italy 2020: clinical, virological and entomological findings. J Travel Med 2021; 28(8):taab130. [DOI] [PMC free article] [PubMed] [Google Scholar]
- 39. Cochet A, Calba C, Jourdain F et al. Autochthonous dengue in mainland France, 2022: geographical extension and incidence increase. Euro Surveill 2022; 27:2200818. [DOI] [PMC free article] [PubMed] [Google Scholar]
- 40. Jourdain F, Roiz D, de ValkH et al. From importation to autochthonous transmission: drivers of chikungunya and dengue emergence in a temperate area. PLoS Negl Trop Dis 2020; 14:e0008320. [DOI] [PMC free article] [PubMed] [Google Scholar]
- 41. Herrero-Martínez JM, Sánchez-Ledesma M, Ramos-Rincón JM. Imported and autochthonous dengue in Spain. Rev Clín Esp (Engl Ed) 2023; 223:510–9. [DOI] [PubMed] [Google Scholar]
- 42. Pasadena Public Health Department . Pasadena Reports Extremely Rare Case of Locally-Acquired Dengue; Exposure Risk to Local Residents Remains Very Low. Pasadena City Public Health Department. California, USA, 2023. https://www.cityofpasadena.net/public-health/news-announcements/pasadena-reports-extremely-rare-case-of-locally-acquired-dengue-exposure-risk-to-local-residents-remains-very-low/. [Google Scholar]
- 43. Rocklöv J, Tozan Y. Climate change and the rising infectiousness of dengue. Emerg Top Life Sci 2019; 3:133–42. [DOI] [PMC free article] [PubMed] [Google Scholar]
- 44. Thai KTD, Anders KL. The role of climate variability and change in the transmission dynamics and geographic distribution of dengue. Exp Biol Med 2011; 236:944–54. [DOI] [PubMed] [Google Scholar]
- 45. Nazni WA, Hoffmann AA, NoorAfizah A et al. Establishment of Wolbachia strain wAlbB in Malaysian populations of Aedes aegypti for dengue control. Curr Biol 2019; 29:4241–4248.e5. [DOI] [PMC free article] [PubMed] [Google Scholar]
- 46. Ahmad NA, Mancini M-V, Ant TH et al. Wolbachia strain wAlbB maintains high density and dengue inhibition following introduction into a field population of Aedes aegypti. Philos Trans R Soc B Biol Sci 1818; 376:20190809. [DOI] [PMC free article] [PubMed] [Google Scholar]
- 47. Aliota MT, Peinado SA, Velez ID, Osorio JE. The wMel strain of Wolbachia reduces transmission of Zika virus by Aedes aegypti. Sci Rep 2016; 6:28792. [DOI] [PMC free article] [PubMed] [Google Scholar]
- 48. Hadinegoro SR, Arredondo-García JL, Capeding MR et al. Efficacy and long-term safety of a dengue vaccine in regions of endemic disease. N Engl J Med 2015; 373:1195–206. [DOI] [PubMed] [Google Scholar]
- 49. Freedman DO. A new dengue vaccine (TAK-003) now WHO recommended in endemic areas; what about travellers? J Travel Med 2023; 30(7):taad132. [DOI] [PubMed] [Google Scholar]
- 50. Biswal S, Reynales H, Saez-Llorens X et al. Efficacy of a tetravalent dengue vaccine in healthy children and adolescents. N Engl J Med 2019; 381:2009–19. [DOI] [PubMed] [Google Scholar]
- 51. Hossain MS, Noman AA, Mamun SMAA, Mosabbir AA. Twenty-two years of dengue outbreaks in Bangladesh: epidemiology, clinical spectrum, serotypes, and future disease risks. Trop Med Health 2023; 51:37. [DOI] [PMC free article] [PubMed] [Google Scholar]
- 52. Naveca FG, Santiago GA, Maito RM et al. Reemergence of dengue virus serotype 3, Brazil, 2023. Emerg Infect Dis 2023; 29:1482–4. [DOI] [PMC free article] [PubMed] [Google Scholar]
- 53. Togami E, Chiew M, Lowbridge C et al. Epidemiology of dengue reported in the World Health Organization’s Western Pacific region, 2013–2019. Western Pac Surveill Response J 2023; 14:1–16. [DOI] [PMC free article] [PubMed] [Google Scholar]
Associated Data
This section collects any data citations, data availability statements, or supplementary materials included in this article.
Supplementary Materials
Data Availability Statement
Data collected for this study will not be made available to other parties.