
Figure 11. Navigation performance with and without habituation.
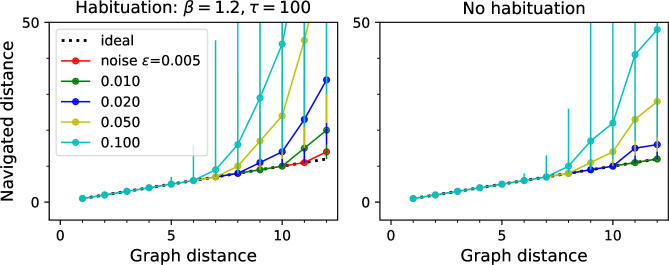
Navigated distance on the binary tree maze, displayed as in Figure 5E. Left: an agent with strong habituation: . Right: no habituation: . The agent learned the map and the goal signals for every node during a random walk with 30,000 steps. Then the agent navigated between all pairs of points on the maze. Graphs show the median ± 10/90 percentile of the navigated distance for all routes with the same graph distance. Other model parameters: as listed.