

Abstract
Background
Vestibular schwannoma (VS) is the most common benign tumor in the cerebellopontine angle and internal auditory canal. Illustrating the heterogeneous cellular components of VS could provide insights into its various growth patterns.
Methods
Single-cell RNA sequencing was used to profile transcriptomes from 7 VS samples and 2 normal nerves. Multiplex immunofluorescence was employed to verify the data set results. Bulk RNA sequencing was conducted on 5 normal nerves and 44 VS samples to generate a prediction model for VS growth.
Results
A total of 83 611 cells were annotated as 14 distinct cell types. We uncovered the heterogeneity in distinct VS tumors. A subset of Schwann cells with the vascular endothelial growth factor biomarker was significantly associated with fast VS growth through mRNA catabolism and peptide biosynthesis. The macrophages in the normal nerves were largely of the M2 phenotype, while no significant differences in the proportions of M1 and M2 macrophages were found between slow-growing and fast-growing VS. The normal spatial distribution of fibroblasts and vascular cells was destroyed in VS. The communications between Schwann cells and vascular cells were strengthened in VS compared with those in the normal nerve. Three cell clusters were significantly associated with fast VS growth and could refine the growth classification in bulk RNA.
Conclusions
Our findings offer novel insights into the VS microenvironment at the single-cell level. It may enhance our understanding of the different clinical phenotypes of VS and help predict growth characteristics. Molecular subtypes should be included in the treatment considerations.
Keywords: heterogeneity, molecular subtypes, single-cell RNA sequencing, tumor microenvironment, vestibular schwannoma (VS)
Key Points.
There is a great heterogeneity in distinct vestibular schwannoma (VS) tumors at the single-cell level.
The proportion of Schwann_vascular endothelial growth factor (VEGFA) is positively correlated with fast growth of VS.
The growth pattern of VS can be better predicted by the combined approach of single-cell RNA sequencing (scRNA-seq) and bulk RNA-seq.
Importance of the Study.
Our results reveal the heterogeneity of vestibular schwannoma (VS) ecosystem, and suggest its potential role in tumor growth pattern for the first time. The link of clinical phenotype and single-cell RNA sequencing-based molecular subtype will help to reveal the mechanism of growth behavior, and assist in the development of therapeutic targets for growth inhibition in VS patients.
Vestibular schwannoma (VS) is a benign tumor arising from the vestibular division of the eighth cranial nerve. VS represents 6%–8% of all intracranial tumors with an incidence of 1.1 per 100 000 and occurs most commonly as a sporadic lesion.1 The growth behaviors of VS vary dramatically.2 Some VS tumors grow aggressively, whereas others remain stable or, less commonly, shrink. Growing lesions, left untreated, will be life-threatening due to brainstem and cerebellar compression, hydrocephalus, and cranial nerve dysfunction. However, the treatment of small or medium-sized VS rarely improves life quality and neurologic function, particularly in minimally symptomatic patients with stable tumors.3 Therefore, treatment strategies include the wait-and-scan approach for static tumors and surgery or radiotherapy for growing tumors. However, it is difficult to identify which tumors will grow. Predicting the tumor growth pattern in individual VS patients will enable early intervention and optimize outcomes.
The mechanisms of the diversity in tumor growth patterns remain unclear. A poor association between classical biomarkers of neoplasia and tumor growth has been reported,4 while cyst formation may cause volume increases in some cases.5 Increasingly studies have revealed that inflammation and angiogenesis play a vital role in tumor growth.3,6 In neurofibromatosis type II (NF2)-associated VS, angiogenesis has been suggested as a critical therapeutic target with a specific response to bevacizumab, an antiangiogenic agent to vascular endothelial growth factor (VEGF).7 Angiogenesis may also play a pivotal role in sporadic VS growth,8–10 and specific angiogenic factors are correlated with microvessel formation, tumor volume, and tumor growth rate.11 These studies, however, are based on traditional bulk RNA sequencing or immunohistochemical approaches, which ignore the heterogeneity of individual tumors. Vestibular schwannoma tumors are presumably not homogeneous because of their complicated and heterogeneous genetic landscape.12 Additionally, while the immune microenvironment of malignant tumors has been widely investigated and found to play a supporting role in tumor growth and invasion,13 the role of the immune response in VS remains unknown.
In this study, we employed single-cell RNA sequencing (scRNA-seq) to systematically investigate the cellular and molecular composition of VS. We revealed heterogeneity in most cell types between VS tumors and the normal nerves and among individual VS tumors. A subgroup of Schwann cells was shown to be correlated with aggressive VS growth for the first time. Furthermore, the gene expression profiles of specific cell clusters that play an essential role in tumor growth were used to refine the growth classification in bulk RNA. The role of communications among distinct cell types was also explored in VS tumorigenesis.
Materials and Methods
Ethical Statement
All clinical samples in this study were obtained with informed consent for research use. The study was approved by the Institutional Review Board of Shanghai Ninth People's Hospital, and conducted in accordance with the tenets of the Declaration of Helsinki (Approval No.: SH9H-2022-T224-1).
Sample Collection and Clinical Information
Seven patients diagnosed with sporadic VS who had undergone surgery at our clinic were included. Two normal great auricular nerves were collected from patients with trauma during debridement surgery. scRNA-seq was performed in these 9 fresh surgical specimens. Besides, 44 VS samples and 5 normal auricular nerves were retrospectively collected and performed with bulk RNA sequencing (RNA-seq) and multiplex immunofluorescence (mIF) staining. Clinical information, including demographics, tumor size, and tumor growth rate, is summarized in Supplementary Tables S1 and S2, and the images of magnetic resonance (MR) are shown in Supplementary Figure S1. The enrolled patients with VS were all under regular follow-up at our clinic for over 1 year (the average follow-up period was 16.8 ± 4.04 months). Tumor growth rate is defined as the average increase in tumor size per year within the follow-up period. The lesions that grow faster than 2 mm per year are classified as fast-growing tumors, while those with growth rates < 2 mm per year are regarded as slow-growing tumors. Vestibular schwannomas are categorized as solid (SVS) or cystic (CVS) according to the neuroradiological presentation.14
Single-Cell Suspension Preparation
Each specimen was resected and washed twice with 1× phosphate buffered saline (PBS) (Gibco). Fresh samples were cut into 1 mm3 pieces and enzymatically digested with 10 mL digestion medium containing 1 mg/mL collagenase IV (Gibco) and 1 U/mL DNase I (Sigma). The samples were subsequently incubated at 37°C for 45 minutes and triturated by pipette for 15 minutes. The suspended cells were subsequently washed with 20% fetal bovine serum (FBS) in Dulbecco's Modified Eagle Medium sieved through a 50-µm Cell-Strainer nylon mesh (BD) and centrifuged at 300×g for 5 min. The supernatant was removed, and the pelleted cells were washed twice with MACS buffer (PBS containing 1% FBS, 0.5% EDTA, and 0.05% gentamycin) and resuspended in PBS with 0.04% bovine serum albumin (BSA). Subsequently, the suspended cells were stained with DRAQ5 and 4ʹ,6-diamidino-2-phenylindole (DAPI; Sigma) to assess cell viability.
scRNA-seq and Reads Processing
The cell suspension of each sample was processed through the Gel Bead Kit V3 (10X Genomics) for library preparation according to the manufacturer's protocol. scRNA-seq libraries were constructed using a Chromium Single Cell 30 V2 or V3 Reagent Kit. The single-cell libraries were then pooled and sequenced on Illumina Novaseq 6000 Systems using 150-base-pair paired-end reads. Raw data were converted to FASTQ files using Illumina bcl2fastq (version 2.19.1) and aligned to GRCh38 human reference genome. The CellRanger (10X Genomics, v6.1) analysis pipeline was utilized for sample demultiplexing, barcode processing, and gene counting to generate gene-barcode matrices. scRNA-seq was conducted with the support of Genergy Inc., Shanghai, China.
Quality Control and Batch Correcting
The Seurat package (v3.1.4) was primarily used for quality control and further bioinformatics analysis.15 We filtered out cells with low quality if they fit any of the following criteria: a proportion of mitochondrial genes count >10%, Unique Molecular Identifiers (UMIs) <500, or UMIs >5000. We then removed the potential doublets with the default settings using the DoubletFinder (v2.0) package.16 After quality control, we used LogNormalize, a global-scaling normalization method, to normalize the feature expression for each cell by the total expression and multiply this by a scale factor (10 000, by default). Next, we log-transformed the result using the NormalizeData function in Seurat. Subsequently, the normalized data sets of all samples were merged using the Merge function in R v4.1.2. We employed the matching mutual nearest neighbors (MNN) correction to remove batch effects.17 The top 5 000 highly variable genes (HVGs) of the merged expression profiles identified by the FindVariableFeatures function were used as the input.
Unsupervised Clustering, Dimensional Reduction, and Visualization
The top principal components (PCs) were identified on the basis of the gene expression profiles of the top 5 000 HVGs. We utilized the Seurat's PCElbowPlot function to select the optimal number of PCs for the downstream analysis. The FindNeighbors and FindClusters functions were used for cell clustering. Clustering was visualized using t-Distributed Stochastic Neighbor Embedding (t-SNE) with the Seurat function RunTSNE.
Cell Type Classification and Signature Genes Identification
The identity of each cluster was defined using the expression profiles of known marker genes. The differentially expressed genes (DEGs) in each subcluster were determined with the FindAllMarkers function in Seurat. Significance levels were computed using a one-tailed Wilcoxon rank-sum test with the Bonferroni correction. The signature genes of each cluster were identified according to the following criteria: (1) expressed in at least 25% of the cells within one population; (2) |log2FC| > 0.5; and (3) adjusted P value < .01.
Cell-State Prediction by Trajectory Analysis
The trajectory analysis was conducted using the Monocle2 package (v2.14.0) to highlight the cell-state transitions.18 The ordering genes were determined by the expression and variance levels of each gene. We executed the DDRTree function in Monocle2 to reduce the dimensions using the default settings. We set the cells from the normal nerves as the root state and utilized the Order function. The DEGs changing with the pseudotime were determined using the DifferentialGeneTest function.
Pathway Enrichment Analysis and Functional Annotation
Gene Ontology (GO) and Kyoto Encyclopedia of Genes and Genomes (KEGG) enrichment analyses were performed using the ClusterProfiler function in R19 for the functional analysis. Genes with an average |log2FC| > 1 and an adjusted P value < .01 were used for enrichment. The CompareCluster function was applied to these selected genes using .05 as the cutoff of P value to compare enrichments between the 2 clusters.
Communication Between Cell Clusters
We identified potential interactions between any pair of cell types using CellPhoneDB (Python package, v2.1.4), which integrates a publicly available repository of curated ligand–receptor (L–R) pairs and a statistical framework.20 We then obtained the P value and average expression level for each L–R pair from the statistical framework of CellPhoneDB. The significant cell type-specific interactions were defined as P < .05, mainly cytokines, chemokines, and growth factors, and were selected for further evaluation and visualization.
Sanger Sequencing
Mutation analysis was performed to evaluate NF2 alterations within DNA isolated from fresh specimens using the TIANamp genomic DNA kit (Tiangen Biotech). All 17 exons and exon–intron boundaries of NF2 were amplified by polymerase chain reaction and analyzed by Sanger sequencing as previously described.21 We executed Sequencer 4.9 software (Genecode) for further analysis. The results were compared with the NF2 sequence in GenBank (GenBank ID NM_016418).
Bulk RNA Sequencing and Combined Analysis
RNA was extracted using TRIzol reagent (Invitrogen) according to the manufacturer's protocol. The libraries were sequenced on an Illumina NovaSeq 6000 platform, generating 150 bp paired-end reads. The clean reads were mapped to the reference genome using HISAT2.22 Differential expression analysis was performed using DESeq2.23Q value < .05 and foldchange >2 or <0.5 were regarded as the thresholds for DEGs.
Top markers for clusters associated with fast growth of VS were selected when the log2FC over any other cluster exceeded 1.5. The Pearson correlation between the bulk RNA-seq and aggregate profiles of the 3 cell subgroups associated with fast tumor growth (both log2 scaled) was calculated using the selected top marker genes. The correlation matrix was then hierarchically clustered to generate the bulk sample clusters.
Multiplex Immunofluorescence Staining
A 4-color fluorescence kit using tyramide signal amplification (TSA) was used for mIF analysis following the manufacturer's guidelines.24 In brief, for each antibody, staining parameters were first optimized with single stain for chromogenic immunohistochemistry (IHC) on VS and normal nerve tissues. Each primary antibody was then paired with a selected TSA fluorophore and single stain. After successfully converting the chromogenic IHC to immunofluorescence (IF), all the "monoplex" IF stains were combined to form a complete 4-plex assay panel. The following primary antibodies were used: anti-VEGFA (1:200, Abcam, catalog no. ab52917), anti-S100B (1:200, Abcam, catalog no. ab52642), and anti-SOX9 (1:600, Abcam, catalog no. ab185230), anti-DPT (1:200, Proteintech, catalog no. 10537-1-AP), anti-HIF-1α (1:100, Abcam, catalog no. ab51608). Nuclei were counter-stained with DAPI. Fluorescent images were obtained with an orthostatic optical microscope (Nikon Eclipse Ci-L) and visualized on the Nikon DS-Fi2 Imaging system.
Statistical Analysis
Statistical analysis was performed using SPSS (version 24.0) and GraphPad Prism (version 8.0). The Wilcoxon rank-sum test, Fisher's exact test, and Pearson's chi-squared test were used. Data are presented as mean ± standard deviation (SD). Specific descriptions of statistical tests are provided in the Results section and figure legends.
Results
VS Single-Cell Transcriptome Atlas
We performed scRNA-seq (10X Genomics) on tumors from 7 sporadic VS samples and 2 normal greater auricular nerves to comprehensively explore the cellular heterogeneity in VS (Figure 1A). We also performed Sanger sequencing of NF2, the most commonly mutated gene in sporadic VS. NF2 mutations were detected in 6 tumor specimens. Frameshift deletion occurred in T3, T4, T5, and T7, while a nonsense mutation was detected in T2 and T6 (Supplementary Figure S2). Detailed clinical and pathological information is provided in Figure 1B.
Figure 1.
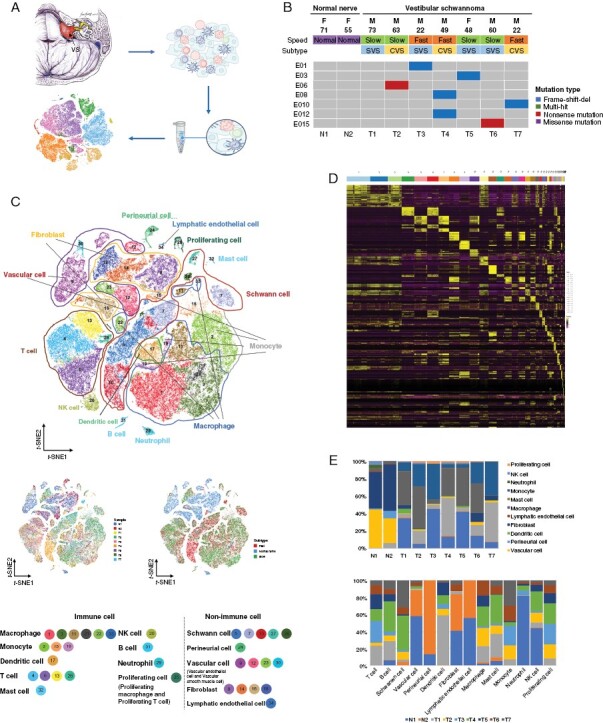
Vestibular schwannoma (VS) single-cell transcriptome atlas. (A) Workflow of sample collection and scRNA-seq. (B) Landscape of basic clinical information and NF2 mutations of 9 samples under scRNA-seq. F, female; M, male; E, exon; SVS, solid vestibular schwannoma; CVS, cystic vestibular schwannoma. (C) t-SNE plot showing the clusters and annotation of cell types in the VS ecosystem and cell origins by color (upper panel), patient origin (bottom left panel), and growth pattern (bottom right panel). (D) Heatmap of the top 10 marker genes of 34 clusters. The abscissa represents cell clusters by color. (E) Histograms indicating the proportion of cells in 2 normal nerves and 7 VSs (upper panel) and the cell origins of each cell type (lower panel).
After removing low-quality cells, 83 611 cells with a median of 1 808 expressed genes were obtained and incorporated into subsequent analyses. We identified 34 distinctive cell clusters that could be assigned to 14 main cell populations (Figure 1C and Supplementary Figure S3). The immune cells were divided into macrophages, monocytes, dendritic cells, T cells, NK cells, B cells, mast cells, proliferating cells (proliferating macrophages and proliferating T cells), and neutrophils. The nonimmune cells were classified as Schwann cells, perineurial cells, vascular cells (vascular endothelial cells [VECs] and vascular smooth muscle [VSM] cells), fibroblasts, and lymphatic endothelial cells. The marker genes are displayed in Figure 1D and Supplementary Table S3. We revealed that the cell types differed substantially between VSs and the normal nerves. The normal nerves mainly comprised vascular cells and fibroblasts, while the VSs exhibited a greater number of Schwann and immune cells. We also observed heterogeneity among different individuals with VS. The proportion of each cell lineage varied greatly between VSs and normal nerves and among different VS samples (Figure 1E).
Single-Cell Transcriptional Profiles of Schwann Cells With Distinct Functions
We performed a clustering analysis of 14 222 Schwann cells and generated 4 prominent subgroups (Figure 2A), which were marked with the expression of cytokine receptor-like factor 1 (CRLF1), periaxin (PRX), sodium voltage-gated channel alpha subunit 7 (SCN7A), and vascular endothelial growth factor A (VEGFA) (Figure 2B). Schwann_VEGFA cells highly expressed LOX, VEGFA, ADIRF, and IGFBP5 (Figure 2C), displaying significant enrichment in mRNA catabolic process and peptide biosynthetic process (Figure 2D), which are critical for protein synthesis. Schwann_VEGFA cells were rarely seen in the normal nerves. Schwann_PRX cells were the rarest Schwann cells and strongly expressed mature myelinating Schwann cell markers, such as NCMAP, MAG, and MPZ (Figure 2C). The genes expressed in Schwann_PRX cells were enriched in ensheathment of neurons and cell adhesion (Figure 2D). Schwann_SCN7A cells were abundant in both the normal nerves and VSs (Figure 2E). Accordingly, GO analysis highlighted the potential role of Schwann_SCN7A cells in biological adhesion, which maintains the normal function of the myelin sheath (Figure 2D). Schwann_CRLF1 cells were mainly found in T1, T3, T6, and T7, and were rare in the normal nerves (Figure 2E). Schwann_CRLF1 cells expressed TGFB1, COL1A1, and MT1X (Figure 2C), which were enriched in the pathway of cell population proliferation and wound healing (Figure 2D).
Figure 2.
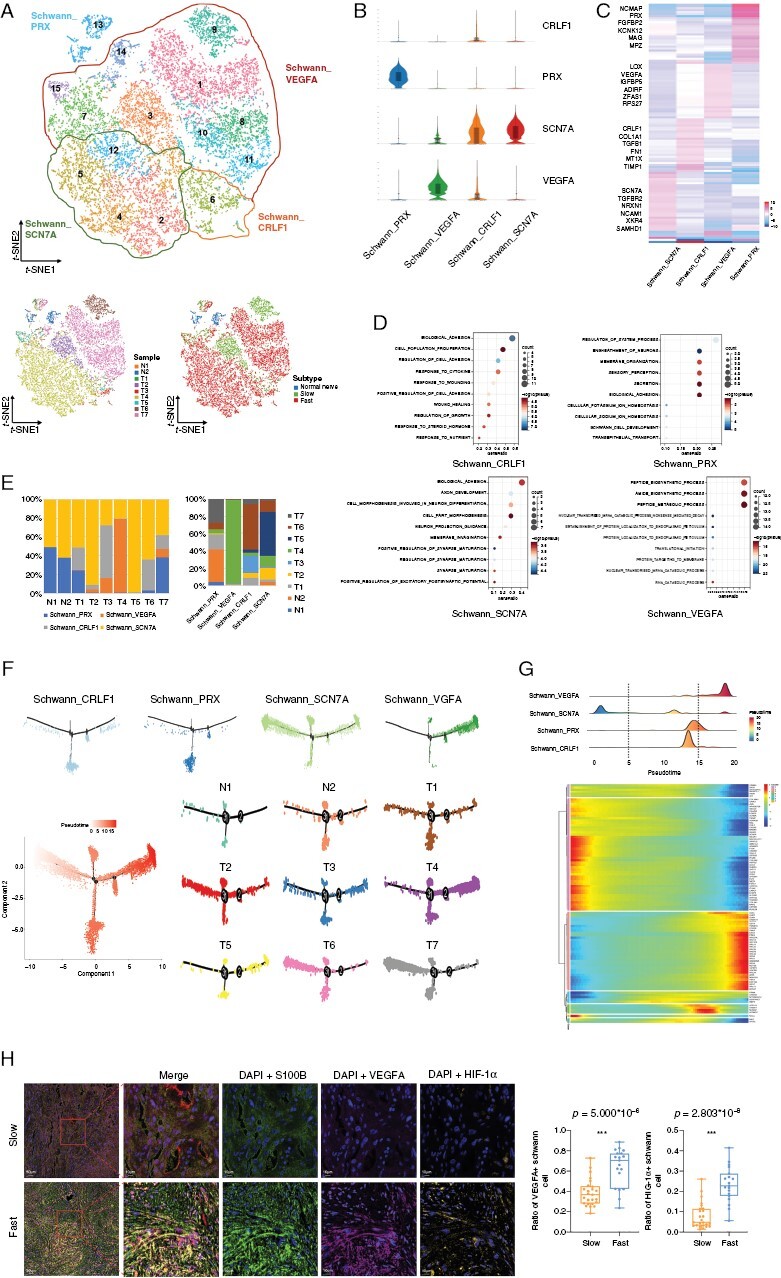
Single-cell transcriptional profiles of Schwann cells with distinct functions. (A) The upper panel of t-SNE plot showing the clusters and subgroups of Schwann cells. Four subgroups are circled with corresponding colors. The lower panel of two t-SNE plots showing the cell origins by sample (left panel) and subtype (Normal nerve/Slow/Fast, right panel). (B) Violin plots showing characterized genes of each subgroup. The abscissa represents cell subgroups, and the ordinate represents characterized markers. (C) Heatmap of the marker genes in each cluster. (D) Bubble plots showing the potential biological functions of each subgroup using GO enrichment analysis. (E) Histograms indicating the proportion of Schwann cells in 2 normal nerves and 7 VSs (left) and the cell origins of each Schwann subgroup (right). (F) Pseudotime-ordered analysis of Schwann cells from the normal nerves and VS samples. Schwann subgroups and samples are labeled by colors. (G) The distribution of Schwann subgroups during the transition (divided into 3 phases) along with the pseudotime. Subtypes are labeled by colors (upper panel). Heatmap shows the dynamic changes in gene expression along with the pseudotime (lower panel). (H) Representative images of multiplex immunofluorescence staining indicating VEGFA+, HIF-1α+ and S100B+ cells in fast-growing and slow-growing VS samples (left panel). Scale bar, 10 and 50 μm. Boxplot (right panel) illustrates the fraction of VEGFA+ and HIF-1α+ Schwann cells (S100B+ cells) in slow-growing and fast-growing VSs, respectively. Box center lines, bounds of the box, and whiskers indicate medians, first and third quartiles. Minimum and maximum values are within 1.5 × IQR (interquartile range) of the box limits, respectively. Significance is determined using a two-sided, unpaired Wilcoxon rank-sum test relative to slow-growing VSs (n = 25 fields) and fast-growing VSs (n = 19 fields). Source data are provided as a Source Data file.
Pseudo-Temporal Transition Trajectory of Schwann Cells
The pseudotime analysis results showed that the aforementioned 4 Schwann cell subgroups represented different developmental states. Schwann_SCN7A cells were mainly at the root of the phylogenetic tree (Figure 2F), suggesting that these cells were likely common in normal nerves and VSs with relatively normal myelin sheath function. In contrast, Schwann_VEGFA cells were largely at the end of the phylogenetic tree, indicating their vital role in Schwann cell tumorigenesis. We also observed transcriptional differentiation associated with pseudotemporal states and divided Schwann cells into 3 phases (Figure 2G). Phase 1 was predominated by Schwann_SCN7A cells, characterized by overexpression of ITGA6, CADM2, and VGLL3. Phase 2, largely comprised Schwann_PRX and Schwann_CRLF1 cells, characterized by the upregulation of ATP1A1, NCMAP, and CKNK12. Phase 3 was dominated by Schwann_VEGFA cells and distinguished by genes (ENO1, EEF1B2, PTX3, RPSA, and RPL14) associated with peptide biosynthetic process and intercellular transport. We used mIF to mark Schwann cells with anti-S100B, and Schwann_VEGFA cells with anti-VEGFA in 44 VS tissues (19 fast-growing tumors and 25 slow-growing tumors) to investigate the influence of the Schwann_VEGFA cell proportion on VS growth. Our results demonstrated that aggressively growing VSs had a higher proportion of VEGFA+ Schwann cells (S100B+ cells) than those with stable growth, indicating the critical role of Schwann_VEGFA cells in VS growth (Figure 2H). In addition, as hypoxia is reported as a potential cause of increased VEGFA expression, we also marked hypoxia-inducible factor 1α (HIF-1α) in VS. The results revealed a similar trend with VEGFA in the fast- and slow-growing VS groups.
Diversity of Macrophages and Their Activation Trajectory in VS
We annotated a total of 48 321 cells as immune cells. Among these cells, there were 18 396 macrophages, which could be divided into 16 clusters. We then classified the 16 clusters into 6 subgroups by unsupervised clustering (Figure 3A and B). Macrophage_CXCL10 were mainly present in T2, and Macrophage_CXCL3_CXCL2_CXCL8 cells were predominant in T3, T4, and T7 (Figure 3A and C). Macrophage_LYVE1 cells were mainly observed in the normal nerves. Most Macrophage_CXCL3_CXCL2_CXCL8 cells were found in the fast-growing VSs, while Macrophage_EGR2_EGR3 cells were mainly observed in the slow-growing VSs. Most Macrophage_Proliferating cells were seen in T3 and T7, while hardly seen in the normal nerves (Figure 3C). We also investigated the heterogeneity between CVS and SVS, and revealed that the proportions of Macrophage_CXCL3_CXCL2_CXCL8 and Macrophage_CXCL10 cells were significantly larger in CVS than those in SVS. It has been accepted that the activation state of macrophages is driven by various microenvironmental signals leading them to show M1 (IL1A, IL1B, IL6, TLR2) or M2 (CD163, CD301, CD115, ARG1) gene profiles and different functionalities in response to cytokines or pathogens. M1-like macrophages show proinflammatory and antitumor effects, while M2-like macrophages have antiinflammatory and protumor properties.25,26 Our results showed that Macrophage_LYVE1, Macrophage_PLA2G7, Macrophage_EGR2_EGR3, and Macrophage_Proliferating cells expressed a greater level of CD163 and were prone to demonstrate the M2-like phenotype, while Macrophage_CXCL10 and Macrophage_CXCL3_CXCL2_CXCL8 cells expressed more IL1A and were considered M1-like (Figure 3B). Interestingly, the macrophages of the normal nerves, mainly macrophage_LYVE1 cells, were M2-like, while in VSs, the macrophages were prone to demonstrate M1-like phenotype. These results indicate that, unlike in malignant tumors, inflammation might play a part in the tumorigenesis of VS. The CVS macrophages tightly adhered to the surrounding neurovascular structures and showed M1 characteristics. No significant differences in the proportions of M1 and M2 macrophages were found between slow-growing and fast-growing VS. The developmental trajectories of the 6 macrophage subgroups were also constructed, revealing that the pseudotime trajectory was initiated with Macrophage_PLA2G7 cells (Figure 3D). We used GO and KEGG pathway analyses to further explore the functionality of macrophage subgroups (Supplementary Figure S4). The results showed that the genes enriched in Macropahge_CXCL3_CXCL2_CXCL8 cells regulated cell death and inflammatory response (Figure 3E).
Figure 3.
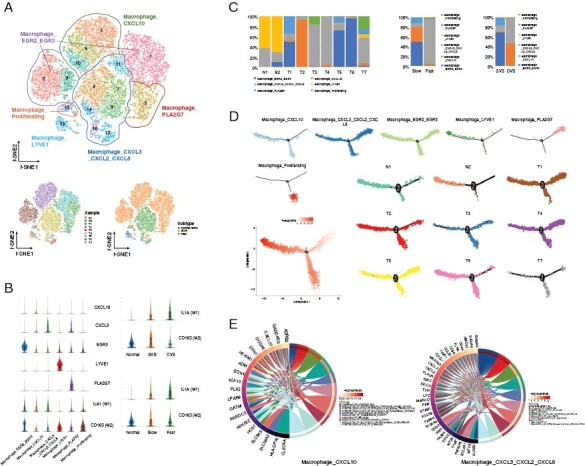
Diversity of macrophages and their activation trajectory in VS. (A) The upper panel of t-SNE plot showing the clusters and subgroups of macrophages. Six subgroups are circled with corresponding colors. The lower panel of two t-SNE plots showing the cell origins by sample (left panel) and subtype (Normal nerve/Slow/Fast, right panel). (B) Violin plots showing characterized genes of each subgroup and the marker genes of M1- or M2-like macrophage. The abscissa represents cell subgroups, and the ordinate represents marker genes. (C) Histograms indicating the proportion of macrophages in 2 normal nerves and 7 VSs (left panel), in the fast-growing and slow-growing VSs (middle panel), in CVSs and SVSs (right panel). (D) Pseudotime-ordered analysis of macrophages from the normal nerves and VS samples. Macrophage subgroups and samples are labeled by colors. (E) Circle plots showing Gene Ontology (GO) term enrichment in two macrophage populations.
T Cell Components in the VS Microenvironment
We divided the 13 197 T cells into 1 CD4+ T cell subgroup, 7 CD8+ T cell subgroups, 2 gamma–delta T cell subgroups, 1 regulatory T cell (Treg) subgroup, and 1 proliferating T cell subgroup (Figure 4A). The CD4_CD40LG_RMRP cells were activated T cells marked with IL7R, LTB, and TRAC expression (Figure 4B). The cytotoxic T cells were CD8_CD52, CD8_CRTAM, CD8_FABP5, CD8_GZMK_CD74, CD8_GZMK_PACS1, CD8_PTGER4, and CD8_IL7R cells characterized by high expression of NKG7, GZMA, GZMB, and GZMK, and low expression of genes involved in immune checkpoints such as LAG3, PDCD1, and HAVCR2. The Treg subgroup was characterized by expression of FOXP3, IKZF2, IL2RA, costimulatory genes (TNFRSF9, ICOS, and CD28) and inhibitory markers such as CTLA4, TIGIT, and LAYN (Figure 4B and C). The Gamma-delta T cell_ZBTB16 and Gamma-delta T cell_FCER1G subgroups highly expressed TRDC, GNLY, CTSW, and CD7. Cell cycle genes, such as MKI67, STMN1, and HMGB2, were highly expressed in the Proliferating T cell subgroup. We observed a significantly higher infiltration of CD8_FABP5 and CD8_CRTAM cells in VSs than in the normal nerves (Figure 4D). None of the other T cell subgroups demonstrated significant differences between the normal nerves and VSs or between the fast-growing and slow-growing VSs.
Figure 4.
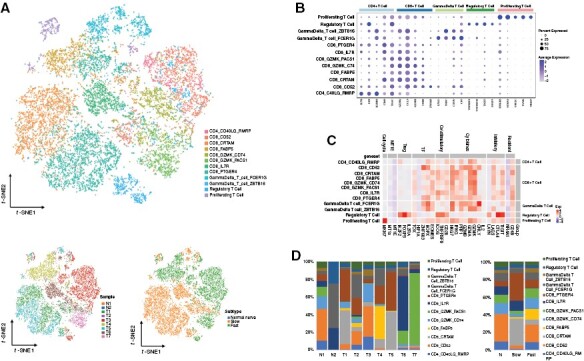
T cell components in the VS microenvironment. (A) The upper panel of t-SNE plot showing the subgroups of T cells. The lower panel of two t-SNE plots showing the cell origins by sample (left panel) and subtype (Normal nerve/Slow/Fast, right panel). (B) Dot plots showing the marker genes of five T cell types. The upper abscissa represents cell subgroups, and the lower abscissa represents marker genes. The ordinate represents T cell cluster. (C) Heatmap showing the potential function of each T cell cluster. The upper abscissa represents T cell functions, and the lower abscissa represents marker genes. The left ordinate represents T cell clusters, and the right ordinate represents relative T cell types. (D) Histograms indicating the proportion of T cells based on samples (left panel) and subtype (Normal nerve/Slow/Fast, right panel).
Heterogeneity of Fibroblasts and Vascular Cells in VS
We detected a total of 11 435 fibroblast cells in the normal nerves and VSs. To better investigate the diversity within VSs, we divided the fibroblasts into 5 subclusters (Figure 5A). The identity of fibroblast cells was confirmed by common fibroblast markers, such as DCN, MGP, COL1A2, and APOD, which were expressed across all subgroups. Previous studies classified fibroblasts into 2 groups according to spatial distribution.27,28 Endoneurial fibroblasts are characterized by high expression of SOX9, CDKN2A, and OSR2, while the epineurial fibroblasts are characterized by overexpression of DPT and SFRP2. Fibroblast_LAMA2 cells were predominantly found in VSs and were classified as endoneurial fibroblasts. Fibroblast_C7, Fibroblast_IGFBP6, Fibroblast_CFD, and Fibroblast_PRG4 clusters were exclusively detected in the normal nerves and were considered as epineurial fibroblasts (Figure 5A and B). We then performed mIF staining using specific antibodies against DPT and SOX9 in 5 normal nerves and 44 VSs. We confirmed that DPT protein was expressed at the epineurial sheath of the normal nerves, and was barely detectable in the VS samples (Figure 5C). SOX9 protein was detected in the VS samples but barely present in the normal nerves. These results indicated that the fibroblasts in VSs lost the spatial structure of the normal nerves.
Figure 5.
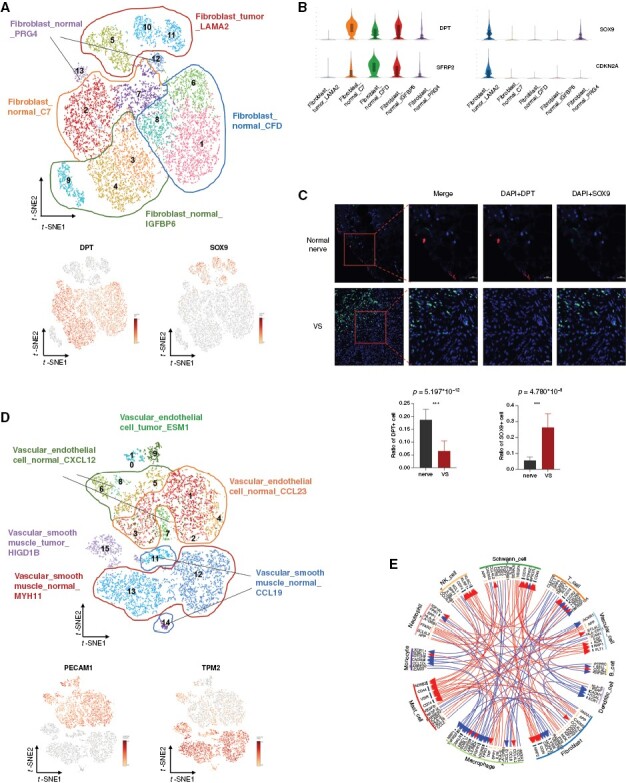
Heterogeneity of fibroblasts and vascular cells in VS. (A) The upper panel of t-SNE plot showing the clusters and subgroups of fibroblasts. Five subgroups are circled with corresponding colors. The lower panel of two t-SNE plots showing the expression of DPT (left panel) and SOX9 (right panel). (B) Violin plots showing characterized genes of each subgroup. (C) Representative images of multiplex immunofluorescence (mIF) staining indicating DPT+ and SOX9+ fibroblasts in the normal nerves and VS samples (upper panel). Scale bar, 20 and 50 μm. Boxplots illustrate the fraction of DPT+ (left panel) and SOX9+ (right panel) fibroblasts in the normal nerves and VSs, respectively. The bars indicate the means and standard deviations. Significance is determined using a two-sided, unpaired Wilcoxon rank-sum test relative to the normal nerves (n = 5 fields) and VSs (n = 44 fields). Source data are provided as a Source Data file. (D) t-SNE plot showing the clusters and subgroups of vascular cells. Six subgroups are circled with corresponding colors. (E) Circle plot of the overall cell-cell communication within cell types. Cell cluster circle analysis showing a stronger connection between vascular cells and Schwann cells in VSs compared with that in the normal nerves.
A total of 8 564 vascular cells were detected in our study. We divided the vascular cells into 2 subtypes, including VECs and VSM cells. VECs expressed high levels of VWF, PECAM1, and EGFL7, while VSM cells expressed TAGLN, TPM2, and ACTA2 (Figure 5D). The VECs were classified into 3 subgroups, Vascular_endothelial cell_CCL23, Vascular_endothelial cell_CXCL12, and Vascular_endothelial cell_ESM1. The VSM cells were divided into Vascular_smooth muscle_MYH11, Vascular_smooth muscle_CCL19, and Vascular_smooth muscle_HIGDIB. Interestingly, Vascular_endothelial cell_ESM1 and Vascular_smooth muscle_HIGDIB clusters were specific to the VS samples, while the other clusters were mainly detected in the normal nerves. A cell–cell communication analysis was performed to examine the communications among cell types within the VS microenvironment. Notably, the vascular cells in VS samples exhibited much stronger interactions with Schwann cells than those in the normal nerve samples (Figure 5E). The most upregulated molecular pairs between Schwann cells and vascular cells in VSs were VEGFA-NRP1/FLT1/KDR, suggesting that Schwann cells secreted growth factors that might promote vascular formation.
The Phenotypes of Schwann Cells and Macrophages Shape the Refined Growth Classification in Bulk RNA
Bulk RNA-seq was used for 44 VS samples and 5 normal nerve tissues. The unsupervised clustering approach demonstrated the similarity of gene expression profiles between each sample (Figure 6A). VSs were clearly separated from the normal nerves. The subclusters of the 14 main cell types and their relative proportions in each sample are shown in Supplementary Figure S5. We defined the specific cell clusters as closely associated with tumor growth according to the following criteria: (1) the absolute number of the cell cluster exceeds 3 000 and (2) the ratio of cell numbers between the fast and slow group is more than 5. The Macrophage_CXCL10 cluster was excluded since it was predominantly from T2. We then used the marker genes of Schwann_VEGFA, Schwann_SCN7A, and Macropahge_CXCL3_CXCL2_CXCL8 cells to predict the growth pattern combined with bulk RNA-seq. We used Pearson's correlation to compare the bulk RNA-seq data and the gene profiles of the 3 cell clusters. Bulk samples were hierarchically clustered by the correlation matrix (Figure 6C). A scattered diagram was used to evaluate the predictive power of the 2 approaches for VS growth pattern prediction (Figure 6B and D). The combined approach had a higher exponent fit with tumor growth rate, indicating that the marker genes of the 3 cell clusters could refine growth classification in bulk RNA. When we measured the tumor growth rate based on the change in tumor volume, the results showed that the combined approach could better depict the growth pattern of VSs (Supplementary Figure S6).
Figure 6.
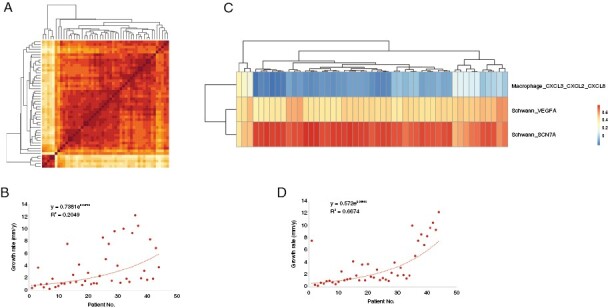
Unsupervised clustering of bulk RNA samples from VSs and the prediction of the tumor growth pattern using a combined approach of scRNA-seq and bulk RNA-seq. (A) Heatmap showing the similarity of gene expression profiles between each sample. The leftmost and the bottom five samples are normal nerves, and the others are VSs. (B) Scattered diagram showing the correlation between the hierarchically clustered VS samples in order of Figure A and their growth rates. (C) Heatmap showing the clustered samples of VSs and normal nerves using the combined approach of scRNA-seq and bulk RNA-seq. (D) Scattered diagram showing the correlation between the clustered VS samples in order of Figure C and their growth rates.
Discussion
Although VS is histologically benign with a low probability of metastasis or malignant transformation, its growth pattern varies greatly and is difficult to predict.2,29,30 If VS continues to grow, brain stem compression and even death may occur. Microsurgery is the most recommended treatment for large VSs, while target-directed therapy, such as bevacizumab, everolimus, and lapatinib, is regarded as a promising alternative treatment to reduce surgical trauma. Sporadic VS involves the local proliferation of Schwann cells and a complex immune microenvironment. Therefore, to provide an evidence-based treatment recommendation for the patients, it is essential to further explore the intrinsic features of VS from the aspects of tumor heterogeneity and the immune environment by more accurate methods.
In this study, we provide a single-cell transcriptome landscape for VS and reveal great heterogeneity in VSs, representing a valuable resource for future exploration of cellular diversity in the VS ecosystem. To better characterize the cellular composition of VSs and verify our results, we integrate our scRNA-seq data set together with 2 recent scRNAseq-based studies of VSs31,32 (Supplementary Table S4). A total of 151 620 cells are obtained from 13 VSs and 2 normal nerve samples, and 7 main cell types are identified (Supplementary Figure S7 and Supplementary Table S5). We reveal that the normal nerves largely comprise stromal cells, such as vascular cells and fibroblasts. Instead, the VS tumors have a greater level of Schwann and immune cells, exhibiting a more complicated microenvironment with prominent heterogeneity. It should be mentioned that the isolated normal nerve is vulnerable, and that there is a difference in survivability of distinct cell types in the pretreatment of scRNA-seq. As a result, the real proportion of specific cell type may be distorted to some extent.
We identified 4 subgroups of Schwann cells with distinct characteristics. Schwann_CRLF1 cells were considered immature and nonmyelinating Schwann cells.33 Previous studies on mouse peripheral nerves34 showed that peak expression of these immature cells was found in developing nerves at the embryonic stage. The Schwann_PRX cluster was found to be strongly increased after birth, reflecting the onset of myelination.35,36 In our study, we did not detect proliferating Schwann cells with MKI67 and TOP2A biomarkers, consistent with a previous study in which it was found that the expression of these proliferation markers decreases as the nerve matures.28
Vascular endothelial growth factor A is a known mitogen for endothelial cells, promoting angiogenesis in vivo. It also has neurotrophic actions and plays a vital role in Schwann cell proliferation and nerve regeneration after injury.37 A previous study38 on the nerve defect rat model revealed that VEGFA-overexpressing Schwann cells elevate angiogenesis and promote nerve regeneration by improving the proliferation, migration, and differentiation of Schwann cells through the VEGFR2/ERK signaling pathway. VEGFA/VEGF receptor (VEGFR)-targeted therapy (such as bevacizumab) displays a striking ability to control tumor growth and improve hearing in patients with NF2, a genetic condition associated with bilateral VSs.7,39 Besides, the VEGFR1/2 peptide vaccine was recently evaluated and demonstrated safety and preliminary efficacy in patients with progressive NF2-associated schwannomas.40 However, the efficacy of VEGFA-targeted therapy in patients with sporadic VS is uncertain. In this study, we identified a specific subtype of Schwann cells overexpressing VEGFA, consistent with 2 recent scRNAseq-based studies on VS.31,32 In addition, for the first time, we found that the Schwann_VEGFA cluster was predominantly distributed in fast-growing VSs instead of stable VSs. This finding could explain, to some extent, the different sensitivity of distinct VSs to VEGFA-targeted therapies.
The spontaneous course of VS remains unpredictable, as some tumors continue to grow after diagnosis, whereas others senesce and even shrink during follow-up.41 The tumor growth percentages reported in previous studies vary from 12% to 76%.42 Our study recruited 44 VS patients with a mean follow-up time of 1.403 ± 0.337 years before surgery. There were 19 (43.2%) fast-growing tumors and 25 (56.8%) stable tumors with an average growth rate of 3.429 ± 3.360 mm per year. To date, the mechanisms that trigger or maintain growth in VS remain unknown. Recent studies have shown that some epidemiological and radiological characteristics are correlated with an increased risk for tumor growth, such as the patient's age, tumor location, and first follow-up time.43 A poor association between tumor growth and the classical markers of neoplasia (such as cellular proliferation indices) has been observed.4 Inflammation and angiogenesis may also play a pivotal role since VEGFA and other angiogenesis factors are correlated with microvessel density and tumor growth.8,11,44 Our study revealed that communication between Schwann cells and vascular cells was significantly increased in aggressive VSs. These findings suggest that Schwann_VEGFA cells might trigger tumor growth by increasing the angiogenesis instead of direct Schwann cell proliferation. Besides, cystic degeneration may also increase volume in some circumstances.5 In our study, the multivariate logistic regression analysis was performed to predict tumor growth pattern. The results revealed that VSs with overexpression of VEGFA were more prone to grow faster, while cystic degeneration had a slight effect on tumor growth rate (Supplementary Table S6). Further experiment should be performed in a large prospective cohort to validate the potential predictors.
Recently, some researchers have found that the increase in VS size is not primarily due to the growth of Schwann cells but to the infiltration of macrophages.45 They found that the expression levels of macrophage markers, such as CD68, CD163, and GM-CSF, were significantly increased with a higher volume of VS. Although we did not find a positive correlation between the tumor growth rate and the typical macrophage markers, one macrophage cluster (Macrophage_CXCL3_CXCL2_CXCL8) was positively associated with tumor growth (Figure 6C). In addition, our results showed that proliferating cells overexpressing MIK67, CDKN3, and TOP2A, were mainly found in the macrophages and T cells, while no proliferating cells were found in the Schwann cells, indicating that the immunocyte infiltration, instead of Schwann cell proliferation, played an essential role in tumor growth.
To the best of our knowledge, this is the first study that provides a broad understanding of the tumor microenvironment and growth pattern of VS using the combined technology of scRNA-seq and bulk RNA-seq. Our study unveiled 3 cell clusters of Schwann cells and macrophages that play a major role in tumor growth. We extracted the marker genes to refine the hierarchical cluster of the bulk samples based on the growth rate. The prediction model of growth rate could be established in our feature work and examined in a larger group of patients with VS.
Immune checkpoint inhibitors targeting programmed cell death 1 (PD-1) or its ligand (PD-L1) have been confirmed to be effective in treating patients with various cancers. Biomarker studies have shown positive correlations between clinical response rates, the expression of PD-L1 on tumor cells, and the presence of tumor-infiltrating lymphocytes.46 A recent study on VS revealed that tumor growth is associated with PD-L1, especially in the presence of M2-subtype macrophages.47 Another study, which used mIF to focus on VS after subtotal surgical resection, revealed that rapidly progressing VS after surgery was distinctly enriched in CD4+, CD8+, CD20+, and CD68+ immune cells, with upregulation of T-cell senescence and innate immune response.48 In our study, we found more lymphocytes in the VS samples than in the normal nerves. However, among distinct VSs, no obvious correlation was observed between tumor growth and PD-L1 expression or the proportion of M2 macrophages. PD-L1 was rarely detected in the immunocytes in our study. Additionally, no significant association was found between the growth rate and T cell subtypes. As a benign tumor, VS might be slightly sensitive to the existing immunotherapy for malignant tumors.
In conclusion, our study opens a new avenue for better understanding the VS tumor ecosystem heterogeneity. Our findings could facilitate a deeper understanding of the mechanisms of tumor growth pattern and assist in the development of more effective therapeutic targets and biomarkers for growth inhibition in VS patients.
Supplementary material
Supplementary material is available online at Neuro-Oncology (https://academic.oup.com/neuro-oncology).
Contributor Information
Zirong Huo, Department of Otolaryngology Head and Neck Surgery, Shanghai Ninth People's Hospital, Shanghai Jiao Tong University School of Medicine, Shanghai, China; Ear Institute, Shanghai Jiao Tong University School of Medicine, Shanghai, China; Shanghai Key Laboratory of Translational Medicine on Ear and Nose Diseases, Shanghai, China.
Zhaohui Wang, Department of Otolaryngology Head and Neck Surgery, Shanghai Ninth People's Hospital, Shanghai Jiao Tong University School of Medicine, Shanghai, China; Ear Institute, Shanghai Jiao Tong University School of Medicine, Shanghai, China; Shanghai Key Laboratory of Translational Medicine on Ear and Nose Diseases, Shanghai, China.
Huahong Luo, Department of Otolaryngology Head and Neck Surgery, Shanghai Ninth People's Hospital, Shanghai Jiao Tong University School of Medicine, Shanghai, China; Ear Institute, Shanghai Jiao Tong University School of Medicine, Shanghai, China; Shanghai Key Laboratory of Translational Medicine on Ear and Nose Diseases, Shanghai, China.
Dilihumaer Maimaitiming, Department of Otolaryngology Head and Neck Surgery, Shanghai Ninth People's Hospital, Shanghai Jiao Tong University School of Medicine, Shanghai, China; Ear Institute, Shanghai Jiao Tong University School of Medicine, Shanghai, China; Shanghai Key Laboratory of Translational Medicine on Ear and Nose Diseases, Shanghai, China.
Tao Yang, Department of Otolaryngology Head and Neck Surgery, Shanghai Ninth People's Hospital, Shanghai Jiao Tong University School of Medicine, Shanghai, China; Ear Institute, Shanghai Jiao Tong University School of Medicine, Shanghai, China; Shanghai Key Laboratory of Translational Medicine on Ear and Nose Diseases, Shanghai, China.
Huihui Liu, Department of Otolaryngology Head and Neck Surgery, Shanghai Ninth People's Hospital, Shanghai Jiao Tong University School of Medicine, Shanghai, China; Ear Institute, Shanghai Jiao Tong University School of Medicine, Shanghai, China; Shanghai Key Laboratory of Translational Medicine on Ear and Nose Diseases, Shanghai, China.
Huipeng Li, Department of Otolaryngology Head and Neck Surgery, Shanghai Ninth People's Hospital, Shanghai Jiao Tong University School of Medicine, Shanghai, China; Ear Institute, Shanghai Jiao Tong University School of Medicine, Shanghai, China; Shanghai Key Laboratory of Translational Medicine on Ear and Nose Diseases, Shanghai, China.
Hao Wu, Department of Otolaryngology Head and Neck Surgery, Shanghai Ninth People's Hospital, Shanghai Jiao Tong University School of Medicine, Shanghai, China; Ear Institute, Shanghai Jiao Tong University School of Medicine, Shanghai, China; Shanghai Key Laboratory of Translational Medicine on Ear and Nose Diseases, Shanghai, China.
Zhihua Zhang, Department of Otolaryngology Head and Neck Surgery, Shanghai Ninth People's Hospital, Shanghai Jiao Tong University School of Medicine, Shanghai, China; Ear Institute, Shanghai Jiao Tong University School of Medicine, Shanghai, China; Shanghai Key Laboratory of Translational Medicine on Ear and Nose Diseases, Shanghai, China.
Funding
This work was supported by the National Natural Science Foundation of China [grant no. 81900928 to Z.H., 81870712 to Z.Z., and 81730028 to H.W.], Two-hundred Talent project of Shanghai Jiao Tong University [grant no. 20191913 to Z.Z.], Biobank Project of Shanghai Ninth People's Hospital [grant no. YBKB201902 to Z.Z.], Shanghai Municipal Science and Technology Major Project [grant no. 2018SHZDZX05 to H.W.], and Shanghai Key Laboratory of Translational Medicine on Ear and Nose Diseases [grant no. 14DZ2260300 to H.W.]. We thank Dr. Zhisen Shen (The Affiliated Lihuili Hospital, Ningbo University) and Dr. Dongzhen Yu (Otolaryngology Institute of Shanghai Jiao Tong University) for generously providing the raw data of their previous studies for integrative analysis in this study.
Conflict of interest statement
None declared.
Authorship statement
Z.H., H.Luo, and Z.W. contributed equally to this work. H.Li, H.W., and Z.Z. had full access to all the data in the study and took responsibility for the integrity of the data and the accuracy of the data analysis. Concept and design: Z.H., Z.W., H.Li, H.W., and Z.Z. Drafting of the manuscript: Z.H., Z.W., and H.Luo. Critical revision of the manuscript for important intellectual content: H.Liu, T.Y., H.W., and Z.Z. Acquisition, analysis, or interpretation of data: Z.H., H.Luo, Z.W., and H.Li. Obtaining samples: H.Luo, Z.W., and D.M. Recording of clinical data: Z.W., H.Luo, and D.M. All authors read, revised, and approved the manuscript.
Data availability
The data will be made available upon reasonable request. The data of scRNA-seq is deposited in GEO Data Sets (Series accession: GSE230375).
References
- 1. Evans DG, Moran A, King A, et al. Incidence of vestibular schwannoma and neurofibromatosis 2 in the North West of England over a 10-year period: higher incidence than previously thought. Otol Neurotol. 2005;26(1):93–97. [DOI] [PubMed] [Google Scholar]
- 2. Marinelli JP, Schnurman Z, Killeen DE, et al. Long-term natural history and patterns of sporadic vestibular schwannoma growth: a mult-institutional volumetric analysis of 952 patients. Neuro Oncol. 2022;24(8):1298–1306. [DOI] [PMC free article] [PubMed] [Google Scholar]
- 3. Carlson ML, Link MJ.. Vestibular schwannomas. N Engl J Med. 2021;384(14):1335–1348. [DOI] [PubMed] [Google Scholar]
- 4. de Vries M, Hogendoorn PC, Briaire-de Bruyn I, Malessy MJA, van der Mey AGL.. Intratumoral hemorrhage, vessel density, and the inflammatory reaction contribute to volume increase of sporadic vestibular schwannomas. Virchows Arch. 2012;460(6):629–636. [DOI] [PMC free article] [PubMed] [Google Scholar]
- 5. Charabi S, Mantoni M, Tos M, Thomsen J.. Cystic vestibular schwannomas: neuroimaging and growth rate. J Laryngol Otol. 1994;108(5):375–379. [DOI] [PubMed] [Google Scholar]
- 6. de Vries M, Briaire-de Bruijn I, Malessy MJ, et al. Tumor-associated macrophages are related to volumetric growth of vestibular schwannomas. Otol Neurotol. 2013;34(2):347–352. [DOI] [PubMed] [Google Scholar]
- 7. Plotkin SR, Stemmer-Rachamimov AO, BarkerFG, 2nd, et al. Hearing improvement after bevacizumab in patients with neurofibromatosis type 2. N Engl J Med. 2009;361(4):358–367. [DOI] [PMC free article] [PubMed] [Google Scholar]
- 8. Caye-Thomasen P, Werther K, Nalla A, et al. VEGF and VEGF receptor-1 concentration in vestibular schwannoma homogenates correlates to tumor growth rate. Otol Neurotol. 2005;26(1):98–101. [DOI] [PubMed] [Google Scholar]
- 9. Koutsimpelas D, Stripf T, Heinrich UR, Mann WJ, Brieger J.. Expression of vascular endothelial growth factor and basic fibroblast growth factor in sporadic vestibular schwannomas correlates to growth characteristics. Otol Neurotol. 2007;28(8):1094–1099. [DOI] [PubMed] [Google Scholar]
- 10. Labit-Bouvier C, Crebassa B, Bouvier C, et al. Clinicopathologic growth factors in vestibular schwannomas: a morphological and immunohistochemical study of 69 tumours. Acta Otolaryngol. 2000;120(8):950–954. [DOI] [PubMed] [Google Scholar]
- 11. Sass HC, Borup R, Alanin M, Nielsen FC, Cayé-Thomasen P.. Gene expression, signal transduction pathways and functional networks associated with growth of sporadic vestibular schwannomas. J Neurooncol. 2017;131(2):283–292. [DOI] [PubMed] [Google Scholar]
- 12. Havik AL, Bruland O, Myrseth E, et al. Genetic landscape of sporadic vestibular schwannoma. J Neurosurg. 2018;128(3):911–922. [DOI] [PubMed] [Google Scholar]
- 13. Grivennikov SI, Greten FR, Karin M.. Immunity, inflammation, and cancer. Cell. 2010;140(6):883–899. [DOI] [PMC free article] [PubMed] [Google Scholar]
- 14. Zhang Z, Wang Z, Sun L, et al. Mutation spectrum and differential gene expression in cystic and solid vestibular schwannoma. Genet Med. 2014;16(3):264–270. [DOI] [PubMed] [Google Scholar]
- 15. Stuart T, Butler A, Hoffman P, et al. Comprehensive integration of single-cell data. Cell. 2019;177(7):1888–1902.e21. [DOI] [PMC free article] [PubMed] [Google Scholar]
- 16. McGinnis CS, Murrow LM, Gartner ZJ.. DoubletFinder: doublet detection in single-cell RNA sequencing data using artificial nearest neighbors. Cell Syst. 2019;8(4):329–337.e4. [DOI] [PMC free article] [PubMed] [Google Scholar]
- 17. Haghverdi L, Lun ATL, Morgan MD, Marioni JC.. Batch effects in single-cell RNA-sequencing data are corrected by matching mutual nearest neighbors. Nat Biotechnol. 2018;36(5):421–427. [DOI] [PMC free article] [PubMed] [Google Scholar]
- 18. Qiu X, Hill A, Packer J, et al. Single-cell mRNA quantification and differential analysis with Census. Nat Methods. 2017;14(3):309–315. [DOI] [PMC free article] [PubMed] [Google Scholar]
- 19. Yu G, Wang LG, Han Y, He Q-Y.. clusterProfiler: an R package for comparing biological themes among gene clusters. OMICS. 2012;16(5):284–287. [DOI] [PMC free article] [PubMed] [Google Scholar]
- 20. Efremova M, Vento-Tormo M, Teichmann SA, Vento-Tormo R.. CellPhoneDB: inferring cell-cell communication from combined expression of multi-subunit ligand-receptor complexes. Nat Protoc. 2020;15(4):1484–1506. [DOI] [PubMed] [Google Scholar]
- 21. Chen H, Zhang X, Zhang Z, et al. The role of NF2 gene mutations and pathogenesis-related proteins in sporadic vestibular schwannomas in young individuals. Mol Cell Biochem. 2014;392(1-2):145–152. [DOI] [PubMed] [Google Scholar]
- 22. Kim D, Langmead B, Salzberg SL.. HISAT: a fast spliced aligner with low memory requirements. Nat Methods. 2015;12(4):357–360. [DOI] [PMC free article] [PubMed] [Google Scholar]
- 23. Love MI, Huber W, Anders S.. Moderated estimation of fold change and dispersion for RNA-seq data with DESeq2. Genome Biol. 2014;15(12):550. [DOI] [PMC free article] [PubMed] [Google Scholar]
- 24. Berry S, Giraldo NA, Green BF, et al. Analysis of multispectral imaging with the AstroPath platform informs efficacy of PD-1 blockade. Science. 2021;372(6547):eaba2609. [DOI] [PMC free article] [PubMed] [Google Scholar]
- 25. Wanderley CW, Colon DF, Luiz JPM, et al. Paclitaxel reduces tumor growth by reprogramming tumor-associated macrophages to an M1 profile in a TLR4-dependent manner. Cancer Res. 2018;78(20):5891–5900. [DOI] [PubMed] [Google Scholar]
- 26. Cassetta L, Pollard JW.. Repolarizing macrophages improves breast cancer therapy. Cell Res. 2017;27(8):963–964. [DOI] [PMC free article] [PubMed] [Google Scholar]
- 27. Chen B, Banton MC, Singh L, Parkinson DB, Dun X-P.. Single cell transcriptome data analysis defines the heterogeneity of peripheral nerve cells in homeostasis and regeneration. Front Cell Neurosci. 2021;15:624826. [DOI] [PMC free article] [PubMed] [Google Scholar]
- 28. Stierli S, Napoli I, White IJ, et al. The regulation of the homeostasis and regeneration of peripheral nerve is distinct from the CNS and independent of a stem cell population. Development. 2018;145(24):dev170316. [DOI] [PMC free article] [PubMed] [Google Scholar]
- 29. Samii M, Metwali H, Gerganov V.. Efficacy of microsurgical tumor removal for treatment of patients with intracanalicular vestibular schwannoma presenting with disabling vestibular symptoms. J Neurosurg. 2017;126(5):1514–1519. [DOI] [PubMed] [Google Scholar]
- 30. Sethi M, Borsetto D, Bance M, et al. Determinants of vestibular schwannoma growth. Otol Neurotol. 2021;42(5):746–754. [DOI] [PubMed] [Google Scholar]
- 31. Xu M, Wang S, Jiang Y, et al. Single-cell RNA-seq reveals heterogeneity of cell communications between schwann cells and fibroblasts within vestibular schwannoma microenvironment. Am J Pathol. 2022;192(9):1230–1249. [DOI] [PubMed] [Google Scholar]
- 32. Yidian C, Chen L, Hongxia D, Yanguo L, Zhisen S.. Single-cell sequencing reveals the cell map and transcriptional network of sporadic vestibular schwannoma. Front Mol Neurosci. 2022;15:984529. [DOI] [PMC free article] [PubMed] [Google Scholar]
- 33. Gerber D, Pereira JA, Gerber J, et al. Transcriptional profiling of mouse peripheral nerves to the single-cell level to build a sciatic nerve ATlas (SNAT). Elife. 2021;10:e58591. [DOI] [PMC free article] [PubMed] [Google Scholar]
- 34. Jessen KR, Mirsky R, Lloyd AC.. Schwann cells: development and role in nerve repair. Cold Spring Harb Perspect Biol. 2015;7(7):a020487. [DOI] [PMC free article] [PubMed] [Google Scholar]
- 35. Jessen KR, Mirsky R.. Schwann cell precursors; Multipotent glial cells in embryonic nerves. Front Mol Neurosci. 2019;12:69. [DOI] [PMC free article] [PubMed] [Google Scholar]
- 36. Patzig J, Jahn O, Tenzer S, et al. Quantitative and integrative proteome analysis of peripheral nerve myelin identifies novel myelin proteins and candidate neuropathy loci. J Neurosci. 2011;31(45):16369–16386. [DOI] [PMC free article] [PubMed] [Google Scholar]
- 37. Sondell M, Lundborg G, Kanje M.. Vascular endothelial growth factor has neurotrophic activity and stimulates axonal outgrowth, enhancing cell survival and Schwann cell proliferation in the peripheral nervous system. J Neurosci. 1999;19(14):5731–5740. [DOI] [PMC free article] [PubMed] [Google Scholar]
- 38. Wu P, Tong Z, Luo L, et al. Comprehensive strategy of conduit guidance combined with VEGF producing Schwann cells accelerates peripheral nerve repair. Bioact Mater. 2021;6(10):3515–3527. [DOI] [PMC free article] [PubMed] [Google Scholar]
- 39. Blakeley JO, Ye X, Duda DG, et al. Efficacy and biomarker study of bevacizumab for hearing loss resulting from neurofibromatosis type 2-associated vestibular schwannomas. J Clin Oncol. 2016;34(14):1669–1675. [DOI] [PMC free article] [PubMed] [Google Scholar]
- 40. Tamura R, Fujioka M, Morimoto Y, et al. A VEGF receptor vaccine demonstrates preliminary efficacy in neurofibromatosis type 2. Nat Commun. 2019;10(1):5758. [DOI] [PMC free article] [PubMed] [Google Scholar]
- 41. Reznitsky M, Petersen M, West N, et al. The natural history of vestibular schwannoma growth-prospective 40-year data from an unselected national cohort. Neuro Oncol. 2021;23:827–836. [DOI] [PMC free article] [PubMed] [Google Scholar]
- 42. Zanoletti E, Mazzoni A, Martini A, et al. Surgery of the lateral skull base: a 50-year endeavour. Acta Otorhinolaryngol Ital. 2019;39(Suppl.1):S1–S146. [DOI] [PMC free article] [PubMed] [Google Scholar]
- 43. Goshtasbi K, Abouzari M, Moshtaghi O, et al. The changing landscape of vestibular schwannoma diagnosis and management: a cross-sectional study. Laryngoscope. 2020;130(2):482–486. [DOI] [PMC free article] [PubMed] [Google Scholar]
- 44. Lewis D, Roncaroli F, Agushi E, et al. Inflammation and vascular permeability correlate with growth in sporadic vestibular schwannoma. Neuro Oncol. 2019;21(3):314–325. [DOI] [PMC free article] [PubMed] [Google Scholar]
- 45. Leisz S, Klause CH, Vital Dos Santos T, et al. Vestibular schwannoma volume and tumor growth correlates with macrophage marker expression. Cancers (Basel). 2022;14(18):4429. [DOI] [PMC free article] [PubMed] [Google Scholar]
- 46. Wang S, Liechty B, Patel S, et al. Programmed death ligand 1 expression and tumor infiltrating lymphocytes in neurofibromatosis type 1 and 2 associated tumors. J Neurooncol. 2018;138(1):183–190. [DOI] [PMC free article] [PubMed] [Google Scholar]
- 47. Bi WL, Gupta S, Mei Y, et al. Immunophenotype of vestibular schwannomas. Otol Neurotol. 2020;41(10):e1290–e1296. [DOI] [PubMed] [Google Scholar]
- 48. Amit M, Xie T, Gleber-Netto FO, et al. Distinct immune signature predicts progression of vestibular schwannoma and unveils a possible viral etiology. J Exp Clin Cancer Res. 2022;41(1):292. [DOI] [PMC free article] [PubMed] [Google Scholar]
Associated Data
This section collects any data citations, data availability statements, or supplementary materials included in this article.
Supplementary Materials
Data Availability Statement
The data will be made available upon reasonable request. The data of scRNA-seq is deposited in GEO Data Sets (Series accession: GSE230375).