Abstract
Background
Neutrophil‐to‐lymphocyte ratio (NLR) and platelet‐to‐lymphocyte ratio (PLR) are closely related to the prognosis of patients with non‐small cell lung cancer, but their effect on extensive‐stage small cell lung cancer (ES‐SCLC) remains uncertain.
Methods
This retrospective study was conducted in ES‐SCLC patients treated with first‐line atezolizumab or durvalumab and platinum‐etoposide. Clinical data from three hospitals were analyzed. Significant risk factors for survival were identified using descriptive statistics and Cox regression. Homogeneity was assessed using t‐tests or nonparametric tests. Kaplan‐Meier analysis revealed an association between high NLR level and median PFS and OS.
Results
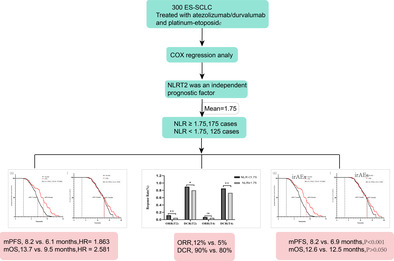
A total of 300 ES‐SCLC patients were included in the study. Cox regression analysis revealed that an elevated NLR level after the second treatment cycle (defined as NLRT2) was an independent prognostic factor for survival. Stratifying patients based on median NLRT2 showed significant differences in both PFS (HR: 1.863, 95% CI: 1.62–2.12, p < 0.001) and OS (HR: 2.581, 95% CI: 2.19–3.04, p < 0.001) between NLR ≥ 1.75 and NLR < 1.75 groups. mPFS and mOS were 8.2 versus 6.1 months and 13.7 versus 9.5 months, respectively. NLR was also associated with treatment efficacy and occurrence of irAEs. Further stratification based on NLR and irAEs showed that in the NLR < 1.75 group, patients with irAEs had prolonged mPFS and mOS. In the NLR ≥ 1.75 group, only mPFS showed a significant difference between patients with and without irAEs.
Conclusion
NLRT2 and irAEs can predict the prognosis of ES‐SCLC patients with first‐line ES‐SCLC receiving PD‐L1 inhibitors combined with chemotherapy.
Keywords: extensive‐stage small cell lung cancer, immune‐related adverse events, neutrophil‐to‐lymphocyte ratio, overall survival, PD‐L1 inhibitors, progression‐free survival
NLRT2 (NLR level after the second treatment cycle) and (immune‐related adverse events) irAEs can predict the prognosis of ES‐SCLC patients with first‐line ES‐SCLC receiving PD‐L1 inhibitors combined with chemotherapy.
INTRODUCTION
According to the 2020 report by the World Health Organization, the annual global incidence of lung cancer is approximately 2.241 million cases, with around 1.768 million deaths. The incidence and mortality rates of lung cancer are 31.5/100 000 and 25/100 000, respectively. Notably, lung cancer affects more males than females, with smoking being a prominent risk factor. 1 Over the past several years, China has witnessed a gradual increase in cancer incidence, mortality rates, and cancer‐associated deaths. 2 , 3 Among lung cancers, small cell lung cancer (SCLC) contributes to 10%–15% of lung cancer cases, with 60% of the patients diagnosed at an extensive stage. Historically, the 5‐year survival rate for patients with SCLC has been below 7%. 4 , 5 Despite first‐line platinum‐based chemotherapy, the median overall survival (mOS) of patients with lung cancer barely extends beyond 10 months. 6 Unfortunately, over 50% of patients show disease progression within 6 months, and the 2‐year survival rate post‐recurrence remains below 2%. 7 The incorporation of immune checkpoint inhibitors (ICIs) in managing extensive stage SCLC (ES‐SCLC) has changed the predominant approach of using chemotherapy for lung cancer, albeit with variable patient responses due to tumor heterogeneity and individual disparities. Therefore, it is crucial to search for accessible predictive biomarkers to accurately forecast therapeutic efficacy. Currently, the predictive markers for immunotherapy are primarily related to baseline clinical attributes or immunohistochemical assessments. However, the dynamic nature of ICI‐induced antitumor effects underscores the necessity to evaluate sustained immunotherapy outcomes. 8
The IMpower133 and Caspian trials substantiate that the first‐line treatment combining PD‐1/PD‐L1 inhibitors (atezolizumab/durvalumab) with platinum‐etoposide prolongs mOS in patients with ES‐SCLC. Notably, PD‐L1 expression in SCLC remains extremely low, with no substantial clinical benefits for high PD‐L1 expression levels. 9 , 10 , 11 The approval for pembrolizumab as a subsequent SCLC therapy, independent of PD‐L1 expression, was revoked following the failure of the Keynote604 trial. 12 Thus, the PD‐L1 level cannot serve as a prognostic biomarker for first‐line immunotherapy‐treated ES‐SCLC. In contrast, neutrophil‐to‐lymphocyte ratio (NLR) and platelet‐to‐lymphocyte ratio (PLR) are potential prognosis indicators for immunotherapy across malignancies such as melanoma, 13 gastric cancer, 14 and non‐small cell lung cancer (NSCLC). 15 A high NLR correlates with unfavorable prognosis in ICI‐treated advanced cancers, with a decrease in NLR following a prolonged response duration; this highlights its potential as a dynamic response indicator to treatment with ICIs. 16 A meta‐analysis indicated that an NLR ≥ 5 threshold predicted median progression‐free survival (mPFS) and mOS in patients with nivolumab‐treated NSCLC. 17 Noteworthy studies by Drpa et al. and Suzuki et al. evaluated ES‐SCLC patients who underwent first‐line platinum‐based chemotherapy. 18 , 19 At present, immunotherapy provides an avenue for enhanced survival in patients with SCLC. Given that the immunotherapeutic mechanism involves the mobilization of the body's immune cells for tumor eradication, lymphocytes and neutrophils play critical roles in this approach. ICI monotherapy has a substantial therapeutic effect on SCLC patients; however, there are insufficient biomarkers to assess their treatment efficacy. 20 , 21 Moreover, the significance of NLR in ES‐SCLC patients receiving platinum‐based immunotherapy as a first‐line treatment remains unclear.
In this context, the present retrospective study aimed to investigate the correlation between dynamic laboratory test‐derived NLR and PLR and mPFS and mOS in ES‐SCLC patients treated with first‐line immunotherapy.
METHODS
Retrieval of medical records
A comprehensive search was conducted in the Medical Research Data Platform of the Affiliated Hospital of Qingdao University, Qingdao Central Hospital, and Qingdao Municipal Hospital. The primary objective was to include all consecutive patients who were diagnosed to have ES‐SCLC and were receiving first‐line atezolizumab/durvalumab combined with platinum‐etoposide treatment. The enrolment period for the selected patients was December 1, 2018, to December 31, 2022. Only those patients who completed four combined treatment cycles were selected to ensure comparability and control of the study population.
The inclusion criterion was as follows: adults with histologically or cytologically confirmed ES‐SCLC, in accordance with VALG staging or the eighth American Joint Committee on Cancer (AJCC) staging manual's definition of stage III/IV. This entailed patients at stage III or IV who had not previously received systemic treatment for ES‐SCLC. All patients received a minimum of four 21‐day cycles of PD‐L1 inhibitors (durvalumab 1500 mg intravenous (iv)/atezolizumab 1200 mg iv, every 3 weeks for 4 cycles) plus platinum‐doublet chemotherapy or platinum‐doublet chemotherapy alone (every 3 weeks for 4 cycles). Patients with infectious diseases, autoimmune diseases, interstitial lung diseases, and concurrent malignancies were excluded.
Collection of patient information
The data extracted from electronic records were screened independently, subject to dual scrutiny by two independent investigators, with a third investigator called upon to resolve and any data discrepancies in the data were resolved by a third investigator. The acquired CT images were re‐evaluated by imaging and clinical experts using the RECIST criteria for clinical efficacy assessment. The following patient information was collected: gender, age, medical history, smoking history, pT stage, pN stage, pM stage, pTNM stage, and tumor metastases (including liver, bone, brain, adrenal, and/or pleural). 22 Laboratory examination parameters included white blood cells, neutrophil count, lymphocyte count, hemoglobin level, platelet count, albumin level, and lactate dehydrogenase. Baseline laboratory tests were performed at 3 days before starting PD‐1 inhibitor treatment. Furthermore, laboratory test results were obtained during the second (T2) and fourth (T4) treatment cycles and during critical time points involving diagnosis, disease progression, and/or mortality date. Data access was granted by the hospital's research office, and all patient‐specific details were anonymized.
Statistical analysis
Treatment responses were evaluated using computed tomography and categorized according to Response Evaluation Criteria in Solid Tumors (RECIST) version 1.1. 23 NLR and PLR were defined as the ratio of neutrophil count to lymphocyte count and platelet count to lymphocyte count, respectively. mPFS represented the duration from cancer diagnosis to disease progression, including deterioration of clinical performance. mOS denoted the time from cancer diagnosis to death from any cause.
Descriptive statistics comprised frequencies and percentages for categorical variables. Normally distributed continuous variables are expressed as mean ± standard error, while non‐normally distributed variables are expressed as median and interquartile range (IQR). Continuous variables were compared using the t‐test or the nonparametric Mann‐Whitney U test, as appropriate. The univariate Cox proportional hazards model was used employed to analyze the association between each variable and PFS/OS for identifying subgroups based on clinical features showing significant differences in survival prognosis. The multivariate Cox model was used to identify independent prognostic factors for PFS and OS. Kaplan‐Meier survival curves and column charts were generated using GraphPad Prism 9.4.1 (GraphPad Software Inc.). Data analysis and graphical representation were performed using SPSS version 25.0 (IBM Corporation) and GraphPad Prism 9.4.1. A p‐value of <0.05 was considered statistically significant.
RESULTS
Clinical characteristics of the study patients
A total of 1750 patients underwent initial screening, and of these 1750 patients, a cohort of 300 patients who met the selection criteria was formed. Subsequently, the clinical data of these 300 patients were retrospectively analyzed (Figure 1). The clinical characteristics of the selected patients are shown in Table 1.
FIGURE 1.
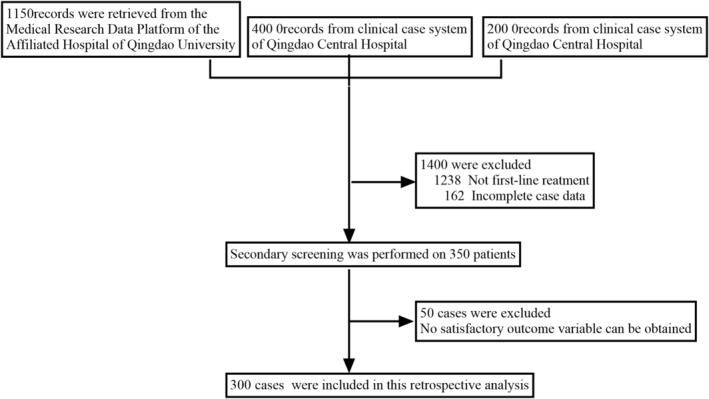
Flow chart for patient screening.
TABLE 1.
Patient and tumor characteristics.
| Features | N | Percentage (%) | |
|---|---|---|---|
| Age (years) | <60 | 89 | 29.7 |
| ≥60 | 211 | 70.3 | |
| Gender (n [%]) | Female | 72 | 24.0 |
| Male | 228 | 76.0 | |
| Smoking history (n [%]) | No | 183 | 61.0 |
| Yes | 117 | 39.0 | |
| Hypertension (n [%]) | No | 213 | 71.0 |
| Yes | 87 | 29.0 | |
| Diabetes (n [%]) | No | 250 | 83.3 |
| Yes | 50 | 16.7 | |
| Coronary heart disease (n [%]) | No | 214 | 71.3 |
| Yes | 86 | 28.7 | |
| Metastatic sites (n [%]) a | Bone | 76 | 25.3 |
| Liver | 92 | 30.7 | |
| Brain | 54 | 17.8 | |
| Adrenal gland | 30 | 10.0 | |
| Pleura | 116 | 38.7 | |
| irAEs | No | 188.0 | 62.7 |
| Yes | 112.0 | 37.3 | |
| ECOG PS | 0–1 | 250 | 83.3 |
| 2 | 50 | 17.0 |
| Features | Point‐in‐time | Median (IQR) |
|---|---|---|
| Leukocytes (109/L) | T0 | 6.65 (5.53–8.09) |
| T2 | 5.07 (4.03–6.23) | |
| T4 | 5.47 (3.91–7.08) | |
| Neutrophils (109/L) | T0 | 3.91 (2.86–5.42) |
| T2 | 2.56 (1.62–3.79) | |
| T4 | 3.04 (1.57–4.71) | |
| Lymphocytes (109/L) | T0 | 1.89 (1.50–2.49) |
| T2 | 1.70 (1.29–2.23) | |
| T4 | 1.53 (1.19–2.00) | |
| Hemoglobin (G/L) | T0 | 121 (114–136) |
| T2 | 99 (80–114) | |
| T4 | 102 (82–132) | |
| Thrombocytes (109/L) | T0 | 164 (93–266) |
| T2 | 177 (106–276) | |
| T4 | 176 (105–269) | |
| Albumin (g/L) | T0 | 38 (35–45.5) |
| T2 | 39.7 (35.7–45.2) | |
| T4 | 40.6 (36.6–46.3) | |
| LDH (U/L) | T0 | 201 (167–260) |
| T2 | 191 (164–222) | |
| T4 | 195 (164–239) | |
| NLR | T0 | 2.06 (1.45–2.69) |
| T2 | 1.47 (0.81–2.28) | |
| T4 | 1.69 (1.06–2.91) | |
| PLR | T0 | 84 (54–84) |
| T2 | 106 (61–168) | |
| T4 | 102 (70–163) |
Abbreviations: ECOG PS, Eastern Cooperative Oncology Group performance status; IQR, interquartile range; IrAEs, immune‐related adverse events; LDH, lactate dehydrogenase; NLR, neutrophil‐to‐lymphocyte ratio; PLR, platelet‐to‐lymphocyte ratio; T2, Results were tested after the second cycle of treatment; T4, Results were tested after the fourth cycle of treatment.
Because some patients exhibited multiple sites of metastasis, the percentage sum is not 100.
Of the 300 patients, 211 patients (70.3%) were aged more than 65 years, and 76% of the patients were females. An Eastern Cooperative Oncology Group (ECOG) score of 0–1 was observed in 83% of the patients, while 61% had no history of smoking. Furthermore, 29%, 16.7%, and 28.7% of the patients had a history of hypertension, type 2 diabetes, and coronary heart disease, respectively. The median NLR value after treatment in the second cycle was 1.47, and the IQR was 0.81–2.28. Following exploratory analysis, the mean NLR value in the second cycle was 1.75, which was considered the cutoff value in this study. After the second treatment cycle, 175 patients had NLR ≥ 1.75, and 125 patients had NLR < 1.75.
Survival outcomes
Both univariate and multivariate Cox regression analyses confirmed that the NLRT2 was an independent prognostic factor for both PFS (hazard ratio [HR]: 1.863, 95% confidence interval [CI]: 1.62–2.12, p < 0.001) and OS (HR: 2.581, 95% CI: 2.19–3.04, p < 0.001) (Table 2). Hereafter, the term “NLR” exclusively refers to the NLR measured after the second treatment cycle. Given the difference in PFS and OS event numbers, the population was dichotomized using the respective NLR median values. This analysis revealed a significant difference in PFS between the groups, with the elevated NLR level (NLR ≥ 1.75) showing a remarkable correlation with inferior PFS (HR: 2.414, 95% CI: 1.82–3.21, p < 0.0001) and abbreviated OS (HR: 4.252, 95% CI: 2.94–6.15, p < 0.001). Kaplan‐Meier analysis revealed that the mPFS and OS of the groups with NLR ≥ 1.75 and NLR < 1.75 were 8.2 versus 6.1 months and 13.7 versus 9.5 months, respectively (Figure 2a,b). Stratified analysis based on NLR‐median after the second treatment cycle yielded analogous results, the PFS survival rates at 6 and 9 months showed significant differences between the groups (p < 0.001). Correspondingly, the OS survival rates at 9 and 12 months also showed significant differences between the groups (p < 0.001) (Figure 3a,b).
TABLE 2.
Univariate and multivariate analyses of median progression‐free survival (mPFS) and median overall survival (mOS).
| Univariable model | Multivariable model | |||||
|---|---|---|---|---|---|---|
| HR | 95% CI | p‐value | HR | 95% CI | p‐value | |
| PFS: Cox regression analysis (N = 300, 276 events) | ||||||
| Gender | 0.860 | 0.65, 1.13 | 0.278 | |||
| Age | 0.992 | 0.98, 1.01 | 0.264 | |||
| Smoking history | 1.906 | 1.47, 2.48 | 0.000 | 1.752 | 1.35, 2.28 | <0.001 |
| Hypertension | 0.887 | 0.68, 1.16 | 0.377 | |||
| Diabetes | 0.737 | 0.53, 1.02 | 0.065 | |||
| Coronary heart disease | 0.890 | 0.68, 1.16 | 0.389 | |||
| Stage | 1.019 | 0.81, 1.28 | 0.869 | |||
| Brain metastases | 1.233 | 0.88, 1.72 | 0.218 | 0.883 | 0.58, 1.34 | 0.559 |
| Bone metastasis | 1.037 | 0.79, 1.36 | 0.793 | |||
| Liver metastases | 1.390 | 1.07, 1.81 | 0.013 | |||
| Adrenal gland metastasis | 1.186 | 0.81, 1.74 | 0.383 | |||
| Pleural metastasis | 0.957 | 0.75, 1.22 | 0.726 | |||
| Hemameba (109/L) T0 | 0.930 | 0.86, 1.00 | 0.059 | |||
| Hemameba (109/L) T2 | 0.943 | 0.88, 1.01 | 0.099 | |||
| Hemameba (109/L) T4 | 1.058 | 0.99, 1.13 | 0.084 | |||
| Neutrophils T0 | 0.994 | 0.93, 1.07 | 0.870 | |||
| Neutrophils T2 | 1.401 | 1.29, 1.52 | <0.001 | 1.111 | 1.03, 1.20 | 0.007 |
| Neutrophils T4 | 1.174 | 1.10, 1.25 | <0.001 | 0.948 | 0.88, 1.02 | 0.160 |
| Lymphocytes T0 | 1.154 | 0.94, 1.42 | 0.174 | |||
| Lymphocytes T2 | 0.800 | 0.69, 0.93 | 0.004 | 0.858 | 0.72, 1.03 | 0.098 |
| Lymphocytes T4 | 1.242 | 1.00, 1.54 | 0.050 | |||
| Hemoglobin T0 | 1.007 | 1.00, 1.01 | 0.045 | |||
| Hemoglobin T2 | 1.001 | 1.99, 1.01 | 0.720 | |||
| Hemoglobin T4 | 0.999 | 1.00, 1.00 | 0.487 | |||
| Thrombocytes T0 | 1.000 | 1.00, 1.00 | 0.640 | |||
| Thrombocytes T2 | 1.000 | 1.00, 1.00 | 0.758 | |||
| Thrombocytes T4 | 0.999 | 1.00, 1.00 | 0.387 | |||
| Albumin T0 | 0.988 | 0.97, 1.00 | 0.116 | |||
| Albumin T2 | 0.993 | 0.98, 1.01 | 0.393 | |||
| Albumin T4 | 0.988 | 0.97, 1.00 | 0.116 | |||
| LDHT0 | 1.002 | 1.00, 1.00 | 0.000 | |||
| LDHT2 | 1.002 | 1.00, 1.00 | 0.000 | |||
| LDHT4 | 1.001 | 1.00, 1.00 | 0.013 | |||
| NLR T0 | 0.979 | 0.89, 1.08 | 0.668 | |||
| NLR T2 | 1.776 | 1.58, 2.00 | <0.001 | 1.836 | 1.62, 2.08 | <0.001 |
| NLR T4 | 1.074 | 0.99, 1.16 | 0.070 | |||
| PLR T0 | 1.001 | 1.00, 1.00 | 0.582 | |||
| PLR T2 | 1.000 | 1.00, 1.00 | 0.567 | |||
| PLR T4 | 1.000 | 1.00, 1.00 | 0.349 | |||
| PLR T4 | 1.000 | 1.00, 1.00 | 0.349 | |||
| irAE | 1.131 | 0.82, 1.55 | 0.448 | |||
| OS: Cox regression analysis (N = 300, 241 events) | ||||||
| Gender | 1.080 | 0.80, 1.45 | 0.609 | |||
| Age | 1.003 | 0.99, 1.02 | 0.702 | |||
| Smoking history | 2.469 | 1.84, 3.31 | <0.001 | 2.318 | 1.70, 3.16 | <0.001 |
| Hypertension | 0.809 | 0.61, 1.07 | 0.135 | |||
| Diabetes | 1.029 | 0.7, 1.51 | 0.883 | |||
| Coronary heart disease | 0.971 | 0.73, 1.29 | 0.838 | |||
| Stage | 1.275 | 0.98, 1.66 | 0.068 | |||
| Brain metastases | 0.882 | 0.64, 1.22 | 0.449 | |||
| Bone metastasis | 1.096 | 0.81, 1.49 | 0.554 | |||
| Liver metastases | 1.290 | 0.98, 1.71 | 0.074 | |||
| Adrenal gland metastasis | 1.312 | 0.86, 2.00 | 0.206 | |||
| Pleural metastasis | 0.965 | 0.75, 1.25 | 0.787 | |||
| Hemameba (109/L) T0 | 0.954 | 0.88, 1.03 | 0.248 | |||
| Hemameba (109/L) T2 | 0.907 | 0.84, 0.98 | 0.012 | |||
| Hemameba (109/L) T2 | 1.152 | 1.08, 1.23 | <0.001 | |||
| Neutrophils TO | 0.962 | 0.88, 1.05 | 0.381 | |||
| Neutrophils T2 | 0.929 | 0.86, 1.00 | 0.066 | |||
| Neutrophils T4 | 1.131 | 1.05, 1.21 | 0.001 | 1.166 | 1.02, 1.33 | 0.021 |
| LymphocytesT0 | 0.891 | 0.71, 1.12 | 0.329 | |||
| LymphocytesT2 | 0.900 | 0.77, 1.05 | 0.172 | |||
| LymphocytesT4 | 1.075 | 0.87, 1.32 | 0.491 | |||
| Thrombocytes T0 | 1.000 | 1.00, 1.00 | 0.662 | |||
| Thrombocytes T2 | 1.000 | 1.00, 1.00 | 0.768 | |||
| Thrombocytes T4 | 1.000 | 1.00, 1.00 | 0.661 | |||
| Hemoglobin T0 | 1.004 | 1.00, 1.01 | 0.291 | |||
| Hemoglobin T2 | 0.999 | 0.99, 1.00 | 0.710 | |||
| HemoglobinT4 | 0.999 | 1.00, 1.00 | 0.585 | |||
| Albumin T0 | 1.054 | 1.03, 1.08 | 0.000 | |||
| Albumin T2 | 1.044 | 1.02, 1.06 | 0.000 | |||
| Albumin T4 | 1.043 | 1.03, 1.06 | 0.000 | 1.026 | 1.01, 1.04 | 0.005 |
| LDHT0 | 1.000 | 1.00, 1.00 | 0.875 | |||
| LDHT2 | 1.001 | 1.00, 1.00 | 0.021 | |||
| LDHT4 | 1.000 | 1.00, 1.00 | 0.581 | |||
| NLR T0 | 1.030 | 0.92, 1.15 | 0.610 | |||
| NLR T2 | 2.559 | 2.21, 2.97 | <0.001 | 2.653 | 2.25, 3.13 | <0.001 |
| NLR T4 | 1.125 | 1.04, 1.21 | 0.002 | 0.876 | 0.76, 1.00 | 0.056 |
| PLR T0 | 1.000 | 1.00, 1.00 | 0.912 | |||
| PLR T2 | 1.000 | 1.00, 1.00 | 0.943 | |||
| PLR T4 | 0.999 | 1.00, 1.00 | 0.409 | |||
| PLR T4 | 0.999 | 1.00, 1.00 | 0.409 | |||
| irAE | 1.118 | 0.80, 1.56 | 0.511 | |||
Note: Bold and red font values indicate a statistically significant difference.
Abbreviations: CI, confidence interval; HR, hazard ratio; IrAE, immune‐related adverse event; LDH, lactate dehydrogenase; NLR, neutrophil‐to‐lymphocyte ratio; PLR, platelet‐to‐lymphocyte ratio.
FIGURE 2.
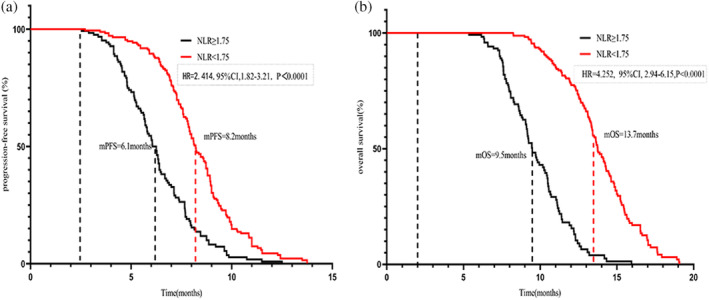
Analysis of survival according to neutrophil‐to‐lymphocyte ratio (NLR)‐median. (a) Progression‐free survival according to NLR tertiles. (b) Overall survival according to NLR‐median.
FIGURE 3.
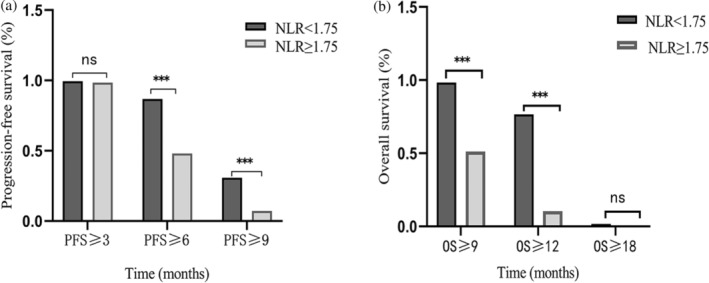
Percentage of progression‐free survival (PFS) at 3, 6, and 9 months according to neutrophil‐to‐lymphocyte ratio (NLR)‐median. (a) PFS according to NLR tertiles. (b) Percentage of median overall survival at 6, 12, and 18 months according to NLR‐median.
Response
Stratification based on the median NLRT2 of patients with NLR < 1.75 showed significantly higher objective response rate (ORR) and disease control rate (DCR) than those with NLR ≥ 1.75. Specifically, the ORR was 12% versus 5% and the DCR (comprising complete response, partial response, and stable disease) was 90% versus 80%. The DCR continued to show significant differences between the two groups even after the fourth treatment cycle, with values of 85% and 73% for the two groups, respectively (p < 0.05). Notably, ORR did not show a significant difference after the fourth cycle of treatment (p > 0.05) (Figure 4).
FIGURE 4.
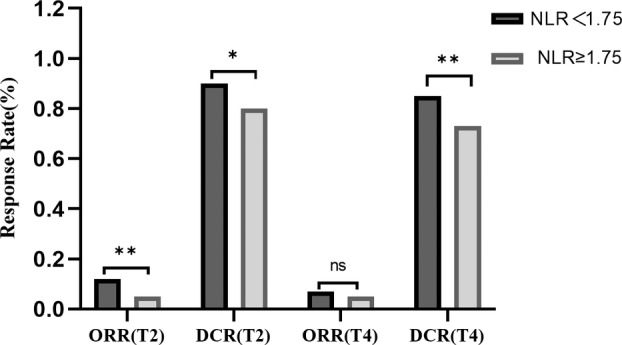
Objective response rate (ORR) and disease control rate (DCR) according to neutrophil‐to‐lymphocyte ratio (NLR)‐median. T2, Evaluation of efficacy after two cycles of treatment; T4, Evaluation of efficacy after four cycles of treatment.
Immune‐related adverse events
A total of 112 patients (37%) experienced five distinct immune‐related adverse events (irAEs) of varying grades, with 10 patients (3.3%) exhibiting high‐grade irAEs. These adverse events included kidney failure (n = 2, 0.7%), liver dysfunction (n = 3, 1%), hypothyroidism (n= 3, 1%), and severe rash (n = 2, 0.7%). An additional 102 patients exhibited mild to moderate irAEs. These 112 patients who experienced irAEs showed significantly better mPFS than the 188 patients without irAEs (8.8 months vs 7.1 months, p < 0.001). However, the two groups showed no difference in OS (Figure 5). Further stratified analysis based on NLRT2 and irAEs highlighted that patients with NLR < 1.75 (n = 175) and irAEs showed prolonged mPFS and OS than those without irAEs. Specifically, the mPFS was 7.9 and 6.7 months and the mOS was 8.8 and 7.5 months in the groups with and without irAEs, respectively (Figure 6a,b). Conversely, in patients with NLR ≥ 1.75 (n = 125), these two groups showed a significant difference in mPFS (14.5 vs. 13.4 months, p < 0.05); however, no such difference was evident in mOS (Figure 6c,d). Regardless of the NLR level, patients with irAEs exhibited superior clinical prognosis as compared to those without irAEs. Moreover, multivariate analysis revealed irAEs as an independent prognostic risk factor for both mOS and mPFS.
FIGURE 5.
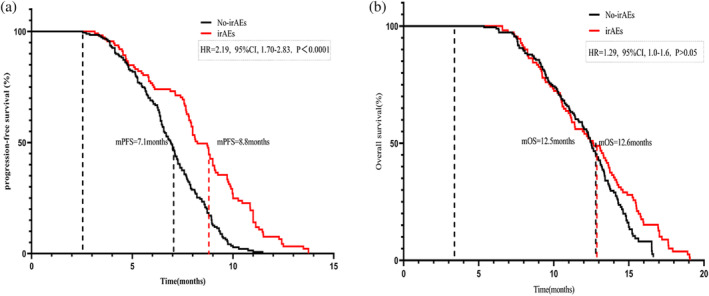
Analysis of survival according to immune‐related adverse events (irAEs). (a) Median progression‐free survival according to irAEs. (b) Median overall survival according to irAEs.
FIGURE 6.
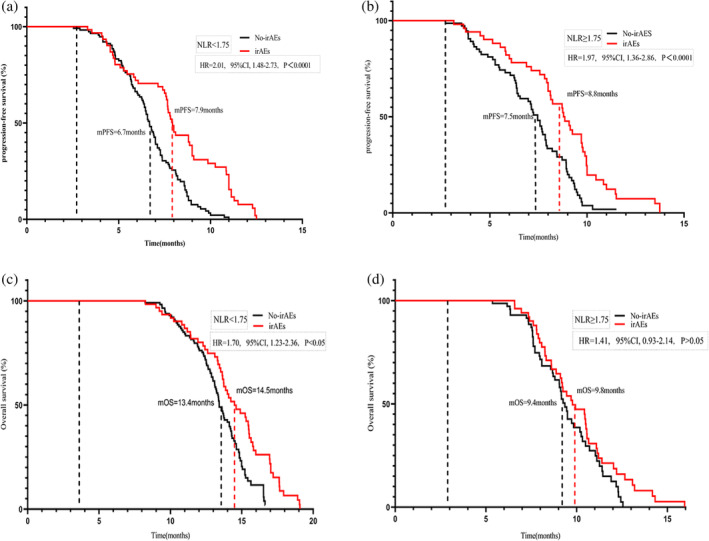
Median progression‐free survival (a, c) and meidan overall survival (b, d) curves of patients stratified according to neutrophil‐to‐lymphocyte ratio 2 (NLRT2) and immune‐related adverse events.
DISCUSSION
In the present study, we investigated the effect of NLR values after different immunochemotherapy cycles on mPFS and mOS. ES‐SCLC patients undergoing first‐line chemotherapy combined with immunotherapy exhibited better clinical prognosis (mPFS and mOS) at lower NLR values. Previous studies have shown that the baseline NLR value and the NLR value after the fourth cycle of treatment with first‐line immunochemotherapy affect the prognosis of patients with NSCLC. 24 In another study, the overall mPFS was 5.1 months (95% CI: 3.2–6.2), 25 while in our study, the mPFS of the 300 patients receiving first‐line immunotherapy was 8.2 months, thus, an apparent clearly, there is a difference in mPFS was observed. This finding might be related to the following factors. First, NLR reflects the body's immune status, wherein neutrophils participate in inflammatory responses, while lymphocytes contribute to immune equilibrium and resistance against external agents. 26 Thus, the NLR level indicates the current immune status against tumor occurrence and progression. Second, NLR can directly or indirectly reflect the state of the tumor microenvironment. 27 The elevated NLR level may lead to an enhanced neutrophil count and a decreased lymphocyte count, thereby diminishing the tumor surveillance and elimination capacity of the body.
A noteworthy issue is our definition of the elevated NLR level, as NSCLC inherently shows a low proportion of lymphocytes, leading to the NLR threshold of ≥5. 17 As observed in other studies, this threshold is not suitable for ES‐SCLC. Accordingly, we determined that NLR ≥ 1.75 was the threshold for the elevated NLR level. This is consistent with the significant difference in the proportion of tumor‐infiltrating lymphocytes between SCLC and NSCLC, 28 , 29 thus suggesting that NLR may differentially affect the prognosis of SCLC and NSCLC. It should be emphasized that only 6% (n = 30) of patients in this study had an NLR value of >5. Additionally, a higher baseline NLR does not predict worse mPFS or mOS. We noted no statistically significant differences in NLR after the fourth treatment cycle. We also attempted to observe the clinical manifestations and test results of patients clinically, but failed. A recent study reported that the authors were unable to observe a decrease in myeloid‐derived suppressor cells (MDSCs) in SCLC patients after receiving three treatment cycles. 30 The detailed mechanism of monocyte reprogramming in cancer treatment remains unclear. Overall, these results are closely associated with the immune function of the body and require further detailed investigations. Currently, we are exploring the specific mechanisms underlying this phenomenon.
It is also crucial to highlight the implications of irAEs, which are closely associated with ICI treatments. The occurrence of irAEs can lead to prompt treatment interruption or even cause life‐threatening situations. 31 Notably, our findings are consistent with the study of Nakaya et al. NSCLC patients with nivolumab‐associated irAEs showed better mPFS than those without irAEs. 32 , 33 Correspondingly, our data indicate that ES‐SCLC patients with irAEs showed prolonged mPFS and comparable OS, thus highlighting the potential of irAEs as independent prognostic markers for mPFS and OS. In this context, the clinical relevance of NLR was reinforced through stratified analysis, which showed that regardless of the NLR level, patients with irAEs exhibited better clinical prognosis than those without irAEs. Furthermore, multivariate analysis indicated that irAEs could function as an independent prognostic risk factor for both mOS and mPFS.
To improve the consistency and comparability of the results of the present study, we employed relatively strict criteria to enroll patients, and only those patients who successfully completed four cycles of immunotherapy combined with chemotherapy were included. Consequently, the sample size was relatively small, mainly due to the small cohort size and retrospective design. We attempted to overcome some limitations by using data from the TCGA database. We are, however, aware of the incomplete information regarding the treatment plans in the database. We could only determine whether the patients had received chemotherapy and/or immunotherapy but had no information about the specific types of first‐line treatment drugs; moreover, details regarding NLR, a blood test indicator used in this study, could not be obtained. Therefore, the clinical data of ES‐SCLC in the TGCA database were of little relevance to this study.
To the best of our knowledge, this is the first retrospective analysis to report the prognostic value of NLR in ES‐SCLC patients receiving first‐line PD‐L1 inhibitor immunotherapy. The NLRT2 shows a correlation with poor treatment outcome in ES‐SCLC patients.
In conclusion, our study substantiates that the elevated NLR levels (NLR ≥ 1.75) correlates with unfavorable PFS, reduced OS, and lower disease control rates in ES‐SCLC patients undergoing first‐line immunotherapy. The NLR value after the second cycle of treatment cycle can be used as a potential biomarker for the prognosis of first‐line PD‐L1 inhibitors in patients with ES‐SCLC receiving treatment with first‐line PD‐L1 inhibitors.
AUTHOR CONTRIBUTIONS
Chunling Zhang and Hongmei Wang: Conception and design, administrative support and provision of study materials. Huanhuan Bi, Dunqiang Ren, Yuting Xiao, Yinxue Zhou, Jingluan Wang, Bingqian Yi, Weizhong Han, and Yanmei Shao: Collection and assembly of data. Huanhuan Bi and Dunqiang Ren: Data analysis and interpretation. All authors wrote the manuscript and approved the final version of the manuscript.
FUNDING INFORMATION
This study was supported by the Wu Jieping Medical Foundation (grant no.: 320.6750.19094.29).
CONFLICT OF INTEREST STATEMENT
The authors declare that the research was conducted in the absence of any commercial or financial relationships that could be construed as a potential conflict of interest.
ACKNOWLEDGMENTS
We would like to thank TopEdit (www.topeditsci.com) for its linguistic assistance during the preparation of this manuscript.
Bi H, Ren D, Xiao Y, Zhou Y, Yi B, Han W, et al. Prognostic implications of neutrophil‐to‐lymphocyte ratio in patients with extensive‐stage small cell lung cancer receiving chemoimmunotherapy: A multicenter, real‐world study. Thorac Cancer. 2024;15(7):559–569. 10.1111/1759-7714.15225
Huanhuan Bi and Dunqiang Ren contributed equally to the work.
Contributor Information
Chunling Zhang, Email: qdzcl2011@163.com.
Hongmei Wang, Email: dor.whm@163.com.
DATA AVAILABILITY STATEMENT
The original contributions presented in the study are included in the article/supplementary material. Further inquiries can be directed to the corresponding authors.
REFERENCES
- 1. Sung H, Ferlay J, Siegel RL, et al. Global cancer statistics 2020: GLOBOCAN estimates of incidence and mortality worldwide for 36 cancers in 185 countries. CA Cancer J Clin. 2021;71(3):209–249. [DOI] [PubMed] [Google Scholar]
- 2. Wei W, Zeng H, Zheng R, et al. Cancer registration in China and its role in cancer prevention and control. Lancet Oncol. 2020;21(7):e342–e349. [DOI] [PubMed] [Google Scholar]
- 3. Chen W, Zheng R, Baade PD, et al. Cancer statistics in China, 2015. CA Cancer J Clin. 2016;66(2):115–132. [DOI] [PubMed] [Google Scholar]
- 4. Oronsky B, Reid TR, Oronsky A, et al. What's New in SCLC? A review. Neoplasia. 2017;19(10):842–847. [DOI] [PMC free article] [PubMed] [Google Scholar]
- 5. Gazdar AF, Bunn PA, Minna JD. Small‐cell lung cancer: what we know, what we need to know and the path forward. Nat Rev Cancer. 2017;17(12):765. [DOI] [PubMed] [Google Scholar]
- 6. Wang S, Tang J, Sun T, et al. Survival changes in patients with small cell lung cancer and disparities between different sexes, socioeconomic statuses and ages. Sci Rep. 2017;7(1):1339. [DOI] [PMC free article] [PubMed] [Google Scholar]
- 7. Rossi A, Di Maio M, Chiodini P, et al. Carboplatin‐ or cisplatin‐based chemotherapy in first‐line treatment of small‐cell lung cancer: the COCIS meta‐analysis of individual patient data. J Clin Oncol. 2012;30(14):1692–1698. [DOI] [PubMed] [Google Scholar]
- 8. Cheng Y, Han L, Wu L, et al. Effect of first‐line serplulimab vs placebo added to chemotherapy on survival in patients with extensive‐stage small cell lung cancer: The ASTRUM‐005 randomized clinical trial. Jama. 2022;328(12):1223–1232. [DOI] [PMC free article] [PubMed] [Google Scholar]
- 9. Paz‐Ares L, Dvorkin M, Chen Y, et al. Durvalumab plus platinum‐etoposide versus platinum‐etoposide in first‐line treatment of extensive‐stage small‐cell lung cancer (CASPIAN): a randomised, controlled, open‐label, phase 3 trial. Lancet. 2019;394(10212):1929–1939. [DOI] [PubMed] [Google Scholar]
- 10. Brahmer J, Reckamp KL, Baas P, et al. Nivolumab versus docetaxel in advanced squamous‐cell non‐small‐cell lung cancer. N Engl J Med. 2015;373(2):123–135. [DOI] [PMC free article] [PubMed] [Google Scholar]
- 11. Horn L, Mansfield AS, Szczęsna A, et al. First‐line atezolizumab plus chemotherapy in extensive‐stage small‐cell lung cancer. N Engl J Med. 2018;379(23):2220–2229. [DOI] [PubMed] [Google Scholar]
- 12. Chung HC, Piha‐Paul SA, Lopez‐Martin J, et al. Pembrolizumab after two or more lines of previous therapy in patients with recurrent or metastatic SCLC: Results from the KEYNOTE‐028 and KEYNOTE‐158 studies. J Thorac Oncol. 2020;15(4):618–627. [DOI] [PubMed] [Google Scholar]
- 13. Ku GY, Yuan J, Page DB, et al. Single‐institution experience with ipilimumab in advanced melanoma patients in the compassionate use setting: lymphocyte count after 2 doses correlates with survival. Cancer. 2010;116(7):1767–1775. [DOI] [PMC free article] [PubMed] [Google Scholar]
- 14. Zurlo IV, Schino M, Strippoli A, et al. Predictive value of NLR, TILs (CD4+/CD8+) and PD‐L1 expression for prognosis and response to preoperative chemotherapy in gastric cancer. Cancer Immunol Immunother. 2022;71(1):45–55. [DOI] [PMC free article] [PubMed] [Google Scholar]
- 15. Wang Z, Zhan P, Lv Y, et al. Prognostic role of pretreatment neutrophil‐to‐lymphocyte ratio in non‐small cell lung cancer patients treated with systemic therapy: a meta‐analysis. Transl Lung Cancer Res. 2019;8(3):214–226. [DOI] [PMC free article] [PubMed] [Google Scholar]
- 16. Ameratunga M, Chénard‐Poirier M, Candilejo IM, et al. Neutrophil‐lymphocyte ratio kinetics in patients with advanced solid tumours on phase I trials of PD‐1/PD‐L1 inhibitors. Eur J Cancer. 2018;89:56–63. [DOI] [PubMed] [Google Scholar]
- 17. Cao D, Xu H, Xu X, et al. A reliable and feasible way to predict the benefits of Nivolumab in patients with non‐small cell lung cancer: a pooled analysis of 14 retrospective studies. Oncoimmunology. 2018;7(11):e1507262. [DOI] [PMC free article] [PubMed] [Google Scholar]
- 18. Drpa G, Sutic M, Baranasic J, et al. Neutrophil‐to‐lymphocyte ratio can predict outcome in extensive‐stage small cell lung cancer. Radiol Oncol. 2020;54(4):437–446. [DOI] [PMC free article] [PubMed] [Google Scholar]
- 19. Suzuki R, Lin SH, Wei X, et al. Prognostic significance of pretreatment total lymphocyte count and neutrophil‐to‐lymphocyte ratio in extensive‐stage small‐cell lung cancer. Radiother Oncol. 2018;126(3):499–505. [DOI] [PMC free article] [PubMed] [Google Scholar]
- 20. Ready NE, Ott PA, Hellmann MD, et al. Nivolumab monotherapy and nivolumab plus ipilimumab in recurrent small cell lung cancer: Results from the CheckMate 032 randomized cohort. J Thorac Oncol. 2020;15(3):426–435. [DOI] [PubMed] [Google Scholar]
- 21. Ready N, Farago AF, de Braud F, et al. Third‐line nivolumab monotherapy in recurrent SCLC: CheckMate 032. J Thorac Oncol. 2019;14(2):237–244. [DOI] [PMC free article] [PubMed] [Google Scholar]
- 22. Ganti AKP, Loo BW, Bassetti M, et al. Small cell lung cancer, Version 2.2022, NCCN clinical practice guidelines in oncology. J Natl Compr Canc Netw. 2021;19(12):1441–1464. [DOI] [PMC free article] [PubMed] [Google Scholar]
- 23. Eisenhauer EA, Therasse P, Bogaerts J, et al. New response evaluation criteria in solid tumours: revised RECIST guideline (version 1.1). Eur J Cancer. 2009;45(2):228–247. [DOI] [PubMed] [Google Scholar]
- 24. Yin Y, Wang J, Wang X, et al. Prognostic value of the neutrophil to lymphocyte ratio in lung cancer: A meta‐analysis. Clinics (Sao Paulo). 2015;70(7):524–530. [DOI] [PMC free article] [PubMed] [Google Scholar]
- 25. Xiong Q, Huang Z, Xin L, et al. Post‐treatment neutrophil‐to‐lymphocyte ratio (NLR) predicts response to anti‐PD‐1/PD‐L1 antibody in SCLC patients at early phase. Cancer Immunol Immunother. 2021;70(3):713–720. [DOI] [PMC free article] [PubMed] [Google Scholar]
- 26. Diakos CI, Charles KA, McMillan DC, et al. Cancer‐related inflammation and treatment effectiveness. Lancet Oncol. 2014;15(11):e493–e503. [DOI] [PubMed] [Google Scholar]
- 27. Nøst TH, Alcala K, Urbarova I, et al. Systemic inflammation markers and cancer incidence in the UK Biobank. Eur J Epidemiol. 2021;36(8):841–848. [DOI] [PMC free article] [PubMed] [Google Scholar]
- 28. Carvajal‐Hausdorf D, Altan M, Velcheti V, et al. Expression and clinical significance of PD‐L1, B7‐H3, B7‐H4 and TILs in human small cell lung Cancer (SCLC). J Immunother Cancer. 2019;7(1):65. [DOI] [PMC free article] [PubMed] [Google Scholar]
- 29. Bonanno L, Pavan A, Dieci MV, et al. The role of immune microenvironment in small‐cell lung cancer: Distribution of PD‐L1 expression and prognostic role of FOXP3‐positive tumour infiltrating lymphocytes. Eur J Cancer. 2018;101:191–200. [DOI] [PubMed] [Google Scholar]
- 30. Hwang M, Canzoniero JV, Rosner S, et al. Peripheral blood immune cell dynamics reflect antitumor immune responses and predict clinical response to immunotherapy. J Immunother Cancer. 2022;10(6):e004688. [DOI] [PMC free article] [PubMed] [Google Scholar]
- 31. Diem S, Schmid S, Krapf M, et al. Neutrophil‐to‐Lymphocyte ratio (NLR) and Platelet‐to‐Lymphocyte ratio (PLR) as prognostic markers in patients with non‐small cell lung cancer (NSCLC) treated with nivolumab. Lung Cancer. 2017;111:176–181. [DOI] [PubMed] [Google Scholar]
- 32. Hinterleitner C, Strähle J, Malenke E, et al. Platelet PD‐L1 reflects collective intratumoral PD‐L1 expression and predicts immunotherapy response in non‐small cell lung cancer. Nat Commun. 2021;12(1):7005. [DOI] [PMC free article] [PubMed] [Google Scholar]
- 33. Nakaya A, Kurata T, Yoshioka H, et al. Neutrophil‐to‐lymphocyte ratio as an early marker of outcomes in patients with advanced non‐small‐cell lung cancer treated with nivolumab. Int J Clin Oncol. 2018;23(4):634–640. [DOI] [PMC free article] [PubMed] [Google Scholar]
Associated Data
This section collects any data citations, data availability statements, or supplementary materials included in this article.
Data Availability Statement
The original contributions presented in the study are included in the article/supplementary material. Further inquiries can be directed to the corresponding authors.


