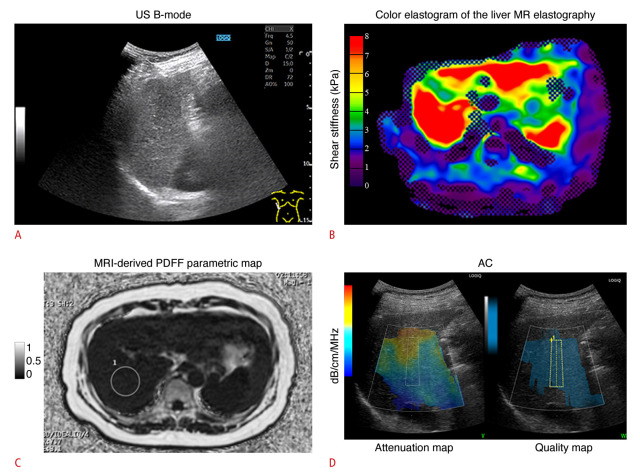
Fig. 4. A 56-year-old male outpatient with compensated cryptogenic cirrhosis who had no specific symptoms.
A. US B-mode shows a coarse speckle pattern in the liver parenchyma. The dynamic range was 72 dB. B. Color MR elastogram of the liver with a 95% confidence map is shown. Liver stiffness was 9.4 kPa, consistent with F4 fibrosis [23]. C. Parametric map of MRI-derived PDFF is shown. A single region of interest was placed in right posterior lobe of the liver. MRI-derived PDFF was 3.8%, consistent with S0 (no steatosis) [23]. D. ACs based on the ultrasound-guided attenuation parameter obtained during the same examination as the attenuation map on the left and a quality map on the right is shown. The attenuation map shows a suitable area for measuring the attenuation slope. If the measured signal contains structures such as blood vessels or the diaphragm, prediction error will be large and the attenuation map will show a dark color instead of blue. AC was 0.78 dB/cm/MHz, consistent with S3 (severe steatosis) [9]. This case demonstrates that AC overestimates hepatic steatosis in patients with F4 fibrosis [23]. AC, attenuation coefficient based on the ultrasound-guided attenuation parameter; MR, magnetic resonance; MRI, magnetic resonance imaging; PDFF, proton density fat fraction; US, ultrasonograpy.

