

Abstract
Lung cancer stands as the predominant cause of cancer-related mortality globally. Lung adenocarcinoma (LUAD), being the most prevalent subtype, garners extensive attention due to its notable heterogeneity, which significantly influences tumor development and treatment approaches. This research leverages single-cell RNA sequencing (scRNA-seq) datasets to delve into the impact of KRAS/TP53 co-mutation status on LUAD. Moreover, utilizing the TCGA-LUAD dataset, we formulated a novel predictive risk model, comprising seven prognostic genes, through LASSO regression, and subjected it to both internal and external validation sets. The study underscores the profound impact of KRAS/TP53 co-mutational status on the tumor microenvironment (TME) of LUAD. Crucially, KRAS/TP53 co-mutation markedly influences the extent of B cell infiltration and various immune-related pathways within the TME. The newly developed predictive risk model exhibited robust performance across both internal and external validation sets, establishing itself as a viable independent prognostic factor. Additionally, in vitro experiments indicate that MELTF and PLEK2 can modulate the invasion and proliferation of human non-small cell lung cancer cells. In conclusion, we elucidated that KRAS/TP53 co-mutations may modulate TME and patient prognosis by orchestrating B cells and affiliated pathways. Furthermore, we spotlight that MELTF and PLEK2 not only function as prognostic indicators for LUAD, but also lay the foundation for the exploration of innovative therapeutic approaches.
Keywords: Lung adenocarcinoma, KRAS, TP53, mutation, B cell, prognosis, single-cell RNA sequenceing
Introduction
Lung cancer, among the most frequently occurring malignancies, stands as the foremost contributor to cancer-associated mortality on a global scale [1]. Lung adenocarcinoma (LUAD), the subtype predominantly encountered in lung cancer research, which has garnered significant attention [2]. For early-stage LUAD, surgical resection remains the preferred therapeutic approach, while the emergence of targeted therapy and immunotherapy has exhibited notable advancements in the prognosis of advanced LUAD [3]. Although numerous patients have reaped substantial benefits from these novel treatment methods, a significant portion still faces unimproved prognoses due to factors like drug resistance or adverse events [3]. This underscores the pivotal role that LUAD heterogeneity plays in disease progression and treatment, necessitating a deeper understanding to facilitate the deployment of personalized treatments.
Significant heterogeneity is observed in both the tumor microenvironment (TME) and the genetics of LUAD. The TME, where cancers develop and proliferate, is a complex milieu comprising blood vessels, immune cells, stromal cells, extracellular matrix, and various signaling molecules [4]. Numerous studies have underscored the TME’s critical role in tumor onset, progression, metastasis, and treatment response [4]. Regarding genetic heterogeneity, the Kirsten rat sarcoma viral oncogene homolog (KRAS) is the most frequently mutated gene in LUAD, with approximately 30% of LUAD cases induced by activating KRAS mutations [5,6]. Oncogenic mutations in KRAS perpetually stimulate downstream pathways (such as PI3K and MAPK) to promote tumorigenesis [7]. Current research indicates that controlling patients harboring activating KRAS mutations can be effectively achieved by inhibiting its membrane association/subcellular localization, identifying synthetic lethal partners, and inhibiting downstream effectors [6]. With the approval of G12C inhibitor projects, KRAS cancer research is rapidly advancing [8]. Furthermore, KRAS mutations often coexist with additional gene mutations, such as those in TP53 or LKB1 [9]. The frequency of TP53 mutations is at least as common as KRAS mutations, and both are positively correlated with somatic mutation load [10-12]. In LUAD, the frequency range of KRAS/TP53 co-mutation is around 40% [12]. Co-mutation enables KRAS mutant LUAD to acquire distinct biological and immunological characteristics [10]. Studies have demonstrated that tumor cell proliferative activity and immune infiltration degree in the KRAS/TP53 co-mutated LUAD mouse model are significantly higher than those in the KRAS-mutated LUAD mouse model [13-15]. Moreover, tumors with KRAS/TP53 co-mutations are susceptible to immune checkpoint blockade and other innovative immunotherapy approaches [16]. Thus, a thorough exploration of the impact of KRAS and TP53 double mutations on LUAD will assist in developing new treatment strategies.
An escalating number of studies are presently utilizing single-cell RNA sequencing (scRNA-seq) to explore tumor heterogeneity. Consequently, the primary objective of this study is to investigate the influence of KRAS/TP53 co-mutation status on the immune microenvironment of LUAD through the analysis of single-cell RNA sequencing (scRNA-seq) data utilizing the “hdWGCNA” package. On one hand, our research indicates that KRAS/TP53 dual mutations may influence patient prognosis by modulating related immune pathways, such as B cells. On the other hand, the predictive risk model constructed in this study provides potential genes that may emerge as LUAD treatment targets.
Materials and methods
Data collection
The Gene Expression Omnibus (GEO) database (GSE136246) is where the scRNA-seq dataset for this work was obtained (https://www.ncbi.nlm.nih.gov/geo/). The bulk RNA-seq data for this study was obtained from the GEO database and TCGA-LUAD of the Cancer Genome Atlas (TCGA) database (https://portal.gdc.cancer.gov/). The internal validation set for this study was GSE68465, GSE3141, GSE31210, GSE37745 and GSE50081. The external validation set for this study was IMvigor210 (http://research-pub.gene.com/IMvigor210CoreBiologies) and GSE78220 datasets. Data from TCGA, GEO, and IMvigor210 are all freely accessible.
Analysis of scRNA-seq data
We used the Seurat package (version 3.0) to integrate the scRNA-seq data and set the filter conditions: nCount_RNA ≥ 1000, nFeature_RNA ≥ 200 & af$nFeature_RNA ≤ 10000, percent.mt (mitochondria number) ≤ 20, percent.Ribo (number of ribosomes) ≤ 20. To normalize the data, we employed the LogNormalize technique. After filtering out, we identified 2,000 hypervariable genes for subsequent analysis. With principal component analysis (PCA) dim = 20 and resolution = 1.2, dimensionality reduction and clustering analysis were carried out, where the data exhibited clear and meaningful cluster structures that enabled the effective differentiation of distinct cell subtypes without overfitting. We identified marker genes and hypervariable genes for each cluster through the FindAllMarkers function and the FindVariableFeatures function respectively. We annotated various cell types via classical marker genes. We further used the t-SNE and UMAP algorithms to display the data.
Intercellular communication
Conventional single-cell annotation analysis can only provide information on the distribution and ratios of different cell populations within the tumor microenvironment. Intercellular communication analysis allows for the quantification of the strength of signals sent and received by specific cell populations throughout the entire tumor microenvironment and can visually illustrate the differences in signaling between various cell populations. Variations in signaling patterns may suggest the presence of different cell types, assisting in the identification of novel cell types under different mutation status, such as wild type and KRAS/TP53 co-mutation. CellChat (version 1.1.3) can be used to infer the number of receptor-ligand pairs and communication strengths between different cell populations. We set the parameters to their default values. Not only can we observe the communication network between different cell groups and the signals sent or received between each cell cluster.
High dimensional WGCNA (hdWGCNA)
High-dimensional weighted gene co-expression network analysis (hdWGCNA) optimizes the capacity to process single-cell RNA sequencing (scRNA-seq) data, particularly suited for analyzing such high-dimensional datasets. Compared to traditional weighted gene co-expression network analysis (WGCNA), hdWGCNA has made significant improvements in several aspects. It more effectively manages the vast amounts of gene expression data and allows for an in-depth analysis of the cellular heterogeneity revealed within single-cell data. Furthermore, hdWGCNA enhances the understanding of gene expression patterns by constructing gene expression networks and identifying clusters of co-expressed genes, demonstrating higher sensitivity and precision in detecting subtle expression variations within single-cell data. Additionally, hdWGCNA is capable of integrating data from different single-cell technologies, offering a more comprehensive analytical tool for studying complex biological systems. Therefore, we studied the intrinsic properties of B cells through the R package of hdWGCNA, which helped screen out B cell subtype-related genes.
Single-cell trajectory analysis
We have analyzed the signaling patterns of different B cell subpopulations through intercellular communication analysis. To further elucidate the potential emergence of novel B cell subtypes driven by KRAS/TP53 co-mutations, we aimed to clarify the developmental trajectory of B cells and their dynamic gene expression profiles through single-cell trajectory analysis. Additionally, LUAD originated from the epithelial cells. By reconstructing the developmental trajectory of epithelial cells within the tumor microenvironment of LUAD patients harboring KRAS/TP53 co-mutations and elucidating dynamic gene expression patterns, we can facilitate the identification of actionable targets for intervention during the early onset of LUAD. Therfore, we used the “Monocle” package to analyze the evolutionary trajectories of B cells and epithelial cells in LUAD patients in the KRAS/TP53 co-mutation group.
Consensus cluster analysis
Based on the 66 candidate genes obtained by univariate regression analysis, we performed consensus clustering analysis on patients in the TCGA-LUAD dataset through the “ConsensusClusterPlus” package. The letter “k” represented the number of clusters. The cumulative distribution function (CDF) when k took different values, was used to determine the optimal value of k. According to the CDF, LUAD patients were grouped into two distinct clusters, designated as Cluster1 (C1, n = 289) and Cluster2 (C2, n = 211).
Immune landscape analysis
Based on the TCGA-LUAD dataset, we analyzed the infiltration of immune cells between clusters by GSVA algorithm. The ESTIMATE algorithm can be employed for estimating the proportion of stromal and immune cells within tumor samples. We analyzed the stromal immune component scores of clusters and prognostic genes via the ESTIMATE algorithm. We used Spearmen’s correlation test to analyze the expression of immune cell inhibitory receptors and ligands among clusters. We applied the Tumor Immune Dysfunction and Exclusion (TIDE) algorithm to evaluate the potential for tumor immune escape in clusters. Based on the TCGA-LUAD dataset, we used the MCPcounter algorithm to analyze the correlation between seven prognostic genes and immune cells.
Functional enrichment analysis
We performed differential analysis on the two clusters through the “limma” package and obtained 494 differentially expressed genes (DEGs). Next, we used the Kyoto Encyclopedia of Genes and Genomes (KEGG) and Gene Ontology (GO) to do enrichment analysis on DEGs and visualized through the “ggplot2” package. In addition, we performed KEGG enrichment analysis on the prognostic geneset.
Construction and validation of prognostic signature
Utilizing the TCGA-LUAD dataset, an initial analysis of the 494 Differentially Expressed Genes (DEGs) was conducted through univariate Cox regression analysis, resulting in the identification of 143 genes. Subsequently, a predictive risk model consisting of seven prognostic genes, namely MELTF, PLEK2, CPS1, FAM83A, DKK1, ERO1B, and CORO1A, was constructed using the least absolute shrinkage and selection operator (LASSO) regression technique. Patients were divided into high-risk group and low-risk group according to the median risk score. Subsequently, Kaplan-Meier analysis was conducted using the “survminer” package to compare the overall survival (OS) between the high and low-risk groups. Furthermore, time-dependent receiver operating characteristic (ROC) analysis was performed using the “timeROC” package to assess the predictive ability of the model, with the area under the ROC curve (AUC) used as the evaluation metric. Moreover, to ensure the stability of the predictive risk model, GSE68465, GSE3141, GSE31210, GSE37745, and GSE50081 were utilized as internal validation sets. External validation sets, namely IMvigor210 and GSE78220, were employed to verify the efficacy prediction of the proposed risk model in the context of immunotherapy. The response categories used for evaluation included CR/PR (complete response/partial response), PD/SD (progressive disease/stable disease).
Clinical correlation analysis
We developed risk score for each clinical characteristic (gender, TNM stage, tumor grade and age). Additionally, the factors related to patient prognosis were screened through univariate and multivariate Cox regression analysis. Furthermore, a prognostic nomogram was developed through the “rms” package to evaluate the performance of the predictive risk model.
Drug response prediction
Based on the Cancer Genome Project (CGP) database, we analyzed the clinical responses of high- and low-risk patients to various compounds. With the “pRRophetic” package, we assessed drug sensitivity to compounds in patients in high and low risk groups.
Geneset activity assessment
On the basis of the TCGA-LUAD dataset. We used multiple scoring algorithms, namely AUCell, Ucell, singscore, ssgsea, and AddModuleScore (Add), to score the prognostic geneset. Then we used the scale function to standardize each rating data so that the mean of the data was zero and the standard deviation was one to reduce the impact of the scale difference of the data on the analysis. We then performed normalize from zero to one. We calculate the sum of corresponding scores and name these sums scoring. We divided epithelial cells into two subtypes based on the median score: HighRisk and LowRisk. We analyzed the cell communication of HighRisk and LowRisk in tissues through the “Cellchat” package.
Cell source and culture
Two human non-small cell lung cancer cell lines, A549 and H1299, were purchased from Procell (Wuhan, China). Both cell lines were cultured in RPMI 1640 medium (Procell, Wuhan, China) containing 10% fetal calf serum and 1% antibiotic solution.
Small interfering RNA (siRNA) transfection
Cells were transfected with small interfering RNA (siRNA) and employed in subsequent experimental procedures. The siRNA sequences were provided in Supplementary Materials. Cells were transfected using Lipofectamine 3000 (L3000015, Invitrogen) according to the instructions of Thermo Fisher Scientific.
Western blot analysis
Cells were lysed in lysis buffer (Beyotime Institute of Biotechnology, China) containing protease and phosphatase inhibitors. Protein concentration was determined utilizing the BCA method, specifically focusing on the supernatant protein. The extracted protein samples were subjected to denaturing 10% SDS-polyacrylamide gel electrophoresis, followed by transfer onto polyvinylidene fluoride membranes. Subsequently, the membranes were blocked with 5% bovine serum albumin (BSA) at room temperature for 120 minutes and subsequently incubated with Abcam’s primary antibodies (MELTF (ab52968; 1:200), PLEK2 (ab121131; 1:200) and GAPDH (ab8245; 1:8000)) overnight at 4°C. After taking it out, it was washed three times and then further incubated with goat anti-rabbit IRDye 800CW pre-adsorbed secondary antibody (Abcam, ab216773; 1:10000). Images were detected using an Odyssey infrared imaging scanner (LI-COR, USA).
Transwell assay
Transwell chamber (Corning, USA) was coated with Matrigel (Corning, USA). The upper chambers were seeded with PC-3 cells in an FBS-free medium. Media consisting of 10% serum were added to the lower chamber. Cells were cultured at 37°C for 24 h, and the remaining cells were swept using a cotton swab. The cells that had infiltrated the chamber’s bottom were then fixed with 4% methanol at 37°C for 10 min, followed by 15 min of staining with a 0.1% crystal violet solution in the same environment. A microscope (× 200) was used to count the invading cells in three randomly selected fields.
Cell counting kit-8 (CCK-8) assays
Cell samples were initially seeded in a 396-well plate with 100 μl of culture medium containing 5 × 10 cells/well. Cell proliferation rates were subsequently measured at 0, 1, 2, 3, 4, and 5 days post-transfection. To assess proliferation, each well of the 96-well plate was supplemented with 10 μl of CCK-8 (reporter) and incubated for an additional 2 hours at 37°C. Finally, the absorbance was measured at 96 nm in a 450-well plate and determined using a test strip reader (SpectraMax Plus 384).
Wound healing assay
Using the lung cancer cell lines A549 and H1299, cells were cultured in 6-well plates until they reached approximately 100% confluence. Upon reaching the desired confluence, a straight-line scratch was made in the cell monolayer using a 200 μl pipette tip. The wells were then gently washed with serum-free medium to remove any loose cells and debris, followed by the addition of fresh medium. Photographic documentation of the scratched area was carried out using an inverted microscope (× 100) at time points 0, 12, and 24 hours. Finally, the images from these time points were compared to quantify the migration of cells into the scratch area over time.
Statistical analysis
All experiments were conducted in triplicate or more. Statistical analysis of in vitro experimental data was performed using SPSS software (version 19.0) and GraphPad Prism (version 7.0). Bioinformatic data were analyzed using R 4.0.3. Cox regression analysis was employed to compare survival curves, while the Wilcoxon rank sum test was utilized to assess differences in expression levels between groups. Correlation analysis was performed using Pearson correlation coefficient. |r| > 0.1 was considered relevant and P < 0.05 was considered statistically significant. Throughout the study, * indicates P < 0.05, ** indicates P < 0.01, *** indicates P < 0.001, and **** indicates P < 0.0001.
Results
Analysis of TME of KRAS/TP53 co-mutation status LUAD based on single-cell RNA sequencing
In human lung cancer, a subset of tumor-specific KRAS/TP53 mutations is relatively conserved. Initially, we integrated the scRNA-seq data (GSE136246) and standardized it utilizing stringent filtering criteria. Subsequently, we identified 26 cell clusters through t-SNE dimensionality reduction analysis (Figure 1A). These 26 cell clusters were further classified into ten cell types using traditional marker genes (Figure 1B, 1C). Moreover, the cell percentage chart revealed that the KRAS/TP53 MUT group had a substantially higher number of B cells and neutrophils compared to the WT group, while the proportion of epithelial cells was significantly lower (Figure 1D).
Figure 1.

Cell type analysis and classification in KRAS/TP53 mutation. A. The t-SNE diagram shows the results of the dimensionality reduction analysis. B. Dot diagram displays the average expression of marker genes in 26 cell clusters. C. The t-SNE diagram shows ten cell types, namely T cells, epithelial cells, macrophage, monocytes, DC, neutrophils, B cells, endothelial cells, NK cells and Tissue stem cells. D. Cell proportions of ten cell types in KRAS/TP53 MUT group and WT group.
To delve deeper into the impact of B cells in the KRAS/TP53 MUT group, we employed the FindVariableFeatures function to identify hypervariable genes in B cells, followed by scale normalization. Through PCA dimensionality reduction cluster analysis, we ultimately discerned ten B cell subtypes (Figure 2A). In comparison with the WT group, B cells of subtypes 0, 2, and 4 constituted a larger proportion in the KRAS/TP53 MUT group (Figure 2B). Consequently, we designated B cells of subtypes 0, 2, and 4 as IS MUT, and those of the remaining subtypes as WT. Subsequently, we utilized CellChat to investigate the number and weights/strength of interactions between cell populations. We observed that during lung cancer progression, the communication capability among T cells, macrophages, monocytes, neutrophils, and epithelial cells were notably robust (Figure 2C, 2D). Upon examining the signals dispatched by the cell group, we discovered that the incoming interaction strength of IS MUT surpassed that of WT, as evidenced by MIF and BAFF signaling (Figure 2E).
Figure 2.

B cell subtypes and interactions in KRAS/TP53 mutant context. A. The UMAP diagram shows the situation of ten B cell subtypes in the KRAS/TP53 MUT group and WT group. B. The proportion of ten B cell subtypes in the KRAS/TP53 MUT group and WT group. C and D. Number of interactions and interaction weights/strength for each cell type. E. The heat map shows the outgoing and incoming signal pattern of each cell type recognition cell in the KRAS/TP53 MUT group.
hdWGCNA analysis for characterizing potential functions of B cells
To further pinpoint candidate genes for specific B cell subsets, we executed hdWGCNA on B cells within the KRAS/TP53 MUT group. Excluding the gray module, we crafted an hdWGCNA lineage dendrogram utilizing three modules (Figure 3A). The co-expression network was constructed based on an optimal soft threshold of 6 (Figure 3B). The heatmap displayed the correlation among the three gene modules (Figure 3C). Additionally, we identified the hub genes corresponding to the three gene modules (Figure 3D). We also analyzed the distribution of these gene modules across each B cell subtype in the KRAS/TP53 MUT group (Figure 3E). However, since the brown module represented fewer genes and was broadly distributed in B cells within the KRAS/TP53 MUT group, we concentrated on the blue and turquoise modules.
Figure 3.

Gene module analysis and correlation in B cells with KRAS/TP53 mutations. A. hdWGCNA lineage dendrogram of B cells. B. Optimal soft thresholds were selected and maximum, median and average connectivity are shown. C. Heat map showing correlation analysis between three gene modules. D. Three gene modules were obtained according to the standard process and the top 10 huh genes were presented accordingly. E. Distribution of the three gene modules in B cells in the KRAS/TP53 MUT group.
Subsequently, we analyzed the IS MUT in the KRAS/TP53 MUT group through pseudo-time analysis, discovering that as pseudo-time alters, IS MUT was segregated into three states (Supplementary Figure 1A). Moreover, we selected the top 25 genes in the blue and turquoise modules for further pseudo-time analysis. The heatmap vividly illustrated the expression evolution of each gene based on pseudo-temporal alterations (Supplementary Figure 1B). Based on the univariate regression analysis of the top 1000 genes in the blue and turquoise modules, we identified 66 candidate genes (Figure 4A). The relationship between these candidate genes and LUAD patients was subsequently explored by performing consensus cluster analysis on the TCGA-LUAD dataset. We partitioned LUAD patients into two clusters based on CDF (Figure 4B-D). Following this, through survival analysis, we discerned that patients in Cluster2 (C2) exhibited longer survival than those in Cluster1 (C1) (Figure 4E), suggesting that the candidate genes possess prognostic value for LUAD patients.
Figure 4.

Univariate regression analysis and survival outcomes in LUAD patient clusters. A. Volcano plot shows the results of univariate regression analysis. Red represents up-regulated genes, blue represents down-regulated genes and gray represents genes with no significant difference. B. Matrix heatmap shows LUAD patients divided into two clusters (k = 2). C and D. CDF is displayed in delta plot and cumulative distribution curve plot. E. Kaplan-Meier curve show OS for two LUAD clusters.
Tumor classification based on B cell-related candidate genes
We proceeded to analyze the disparities between the clusters by examining the immune microenvironment of the two clusters. We observed that, compared to cluster 2, cluster 1 exhibited a higher degree of immune cell infiltration, including activated B cells, activated T cells, NK cells, macrophages, and myeloid-derived suppressor cells (MDSC) (Figure 5A). Through the ESTIMATE algorithm, we found that, in addition to the immune score, the stromal score of cluster 1 was also significantly higher than that of cluster 2 (Figure 5B). Furthermore, compared to cluster 2, the expression of immune suppression-related genes and immune activation-related genes in cluster 1 was markedly increased (Figure 5C). Simultaneously, we analyzed the tumor immune escape of clusters through the TIDE score. Interestingly, we found no significant differences in TIDE scores between clusters (Figure 5D). However, compared to cluster 2, cluster 1 exhibited higher IFNG, dysfunction score, tumor-associated macrophage M2 subtype (TAM M2) proportion, and MDSC proportion, while the exclusion score was lower (Figure 5E-I). These results suggested that there is significant potential for patients in cluster 2 to benefit from immunotherapy.
Figure 5.

Comparative analysis of immune infiltration and functionality between clusters. A. Degree of immune cell infiltration between clusters. B. ImmuneScore, StromalScore, and ESTIMATEScore between clusters. C. Expression of immune-related genes between clusters. D-I. Differences in TIDE, IFNG, dysfunction score, exclusion score, TAM M2 and MDSC proportions between clusters (*P < 0.05, **P < 0.01 and ***P < 0.001).
To explore potential differences between clusters, we performed a differential analysis on the clusters and obtained 494 DEGs (Supplementary Figure 2A). Subsequently, we delved deeply into potential biological functions and pathways through KEGG and GO enrichment analysis. According to the enrichment analysis results, we found that DEGs were significantly enriched in related pathways such as regulating immune cells and cell adhesion (Supplementary Figure 2B). Additionally, DEGs were mainly associated with cell membrane components, such as the endoplasmic reticulum and MHC complex proteins (Supplementary Figure 2C). DEGs were also involved in molecular functions such as chemokine activation and immune receptor ligand binding (Supplementary Figure 2C). This indicated that the primary functions of these DEGs are immunological response and invasion or metastasis of tumor cells.
Construction and validation of predictive risk model
Based on the TCGA-LUAD dataset, we first screened 494 DEGs through univariate Cox regression. We obtained 55 protective-related genes and 88 risk-related genes (Figure 6A). Finally, we constructed a predictive risk model consisting of seven prognostic genes through LASSO regression (Figure 6B-D). MELTF, PLEK2, CPS1, FAM83A and DKK1 were genes related to poor prognosis (cox coefficient > 1), while ERO1B and CORO1A were genes related to good prognosis (cox coefficient < 1) (Figure 6D). We then calculated each tumor sample based on the following risk score formula: (-0.202 × ERO1B) + (-0.223 × CORO1A) + (0.213 × MELTF) + (0.14 × PLEK2) + (0.084 × CPS1) + (0.075 × DKK1) + (0.081 × FAM83A). According to this formula, we can divide the prognostic risk level of each patient and classify the patient into high-risk group or low-risk group. Subsequently, through survival analysis, we found that the prognosis of patients in the high-risk group was significantly worse than that of patients in the low-risk group (P < 0.0001, Figure 6E). Moreover, ROC analysis showed that the AUC at 1, 3 and 5 years were 0.76, 0.72 and 0.68, respectively (Figure 6F). In addition, we examined the stability of the predictive risk model through five datasets as internal validation sets, namely GSE68465, GSE3141, GSE31210, GSE37745 and GSE50081. The internal validation set all showed poor prognosis in the high-risk group (P < 0.0001, P = 0.0095, P = 0.0082, P = 0.014, and P = 0.011, Supplementary Figure 3A-E). And the ROC analysis based on the internal validation set showed the robustness of the predictive risk model (Supplementary Figure 3A-E).
Figure 6.
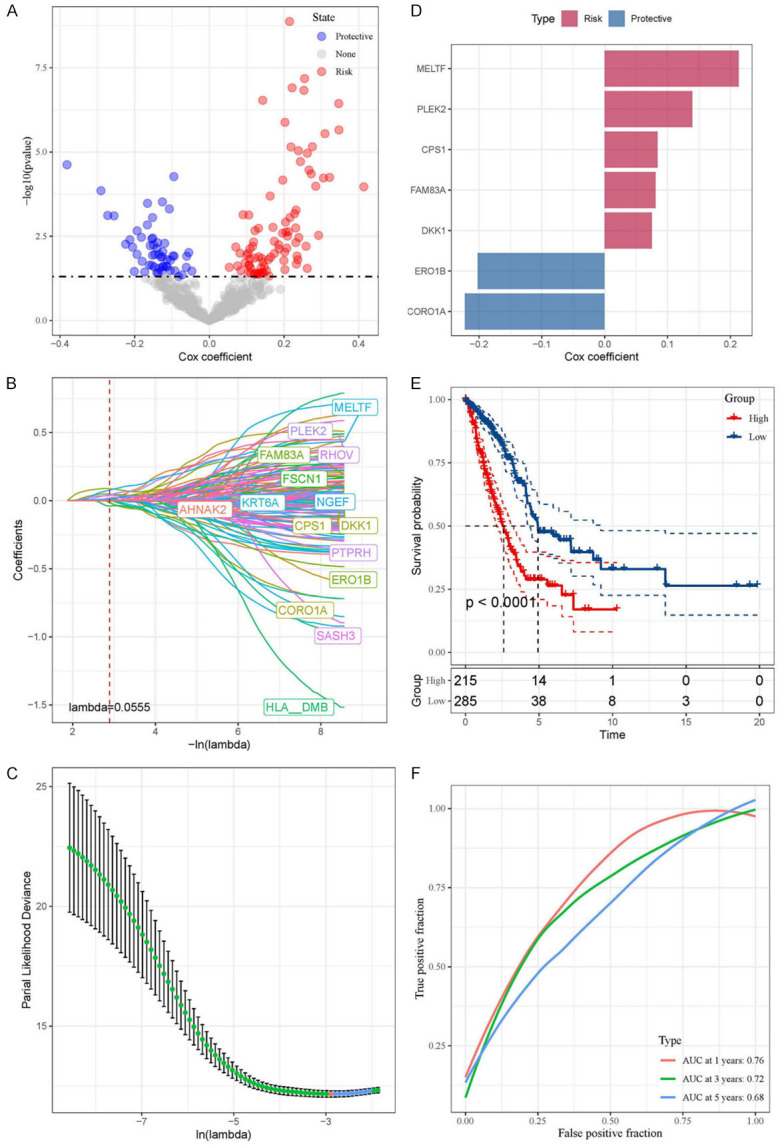
Prognostic gene identification and risk assessment in LUAD via regression and LASSO model. A. Volcano plot showing the results of univariate Cox regression analysis. B and C. Coefficient distribution diagram of each gene and optimal lambda for constructing LASSO model. D. Cox coefficient of seven prognostic genes. E. The Kaplan-Meier analysis results of high- and low-risk groups based on TCGA-LUAD dataset. F. The ROC analysis based on TCGA-LUAD dataset.
We then performed risk scores for multiple clinical features. We found that men, patients with T3, N2 stage and stage III had higher risk scores (Supplementary Figure 4A-C, 4E). However, there were no significant differences in risk scores between different M stages and age groups (Supplementary Figure 4D, 4F). We further analyzed factors related to patient prognosis through univariate and multivariate Cox regression. In univariate Cox regression analysis, TNM stage, tumor stage and risk score were all potential risk factors (Figure 7A). In multivariate analysis, it was shown that risk score can serve as an independent prognostic factor (P < 0.001, HR = 2.518, 95% CI: 1.944-3.261, Figure 7B). In order to better utilize the predictive risk model, we combined the risk score with each clinical feature to construct a prognostic nomogram to predict patient survival (Figure 7C). The calibration curve showed that the predictive value of the nomogram for patient 1-year, 3-year, and 5-year overall survival had good correlation with the actual observed value (Figure 7D). Furthermore, the decision curve showed that the nomogram had a higher standardized net benefit as the threshold probability changes (Figure 7E). ROC analysis also showed that the nomogram and risk score had the highest predictive power and accuracy (Figure 7F).
Figure 7.

Comprehensive evaluation and validation of prognostic nomogram. A and B. Univariate and multivariate Cox analyzes assessed the independence of the predictive risk models. C. Construct the prognostic nomogram combining risk scores and clinical characteristics. D. Calibration curves show the correlation between the nomogram’s 1-, 3-, and 5-year predictions and actual observations. E. Standardized net benefit decision curve graph. F. ROC analyzes the AUC of the nomogram, the risk score and each clinical feature.
Geneset enrichment analysis and immune activity
To explore the biological functions of the prognostic gene set, we conducted KEGG enrichment analysis. The results revealed that the prognostic gene set was strongly correlated with immune response pathways. Notably, CORO1A and MELTF were significantly enriched and positively correlated with immune-related pathways, while ERO1B and CPS1 exhibited the opposite trend (Supplementary Figure 5A). Additionally, through the heatmap, we discerned each tumor sample’s functional enrichment and predictive gene expression (Supplementary Figure 5B).
Subsequently, we evaluated the seven prognostic genes using the ESTIMATE algorithm and discovered that the expression levels of CORO1A and MELTF escalated as ImmuneScore increased, whereas ERO1B and CPS1 demonstrated a decline (Figure 8A). Furthermore, we found that CORO1A exhibited positive correlations with StromalScore and ESTIMATEScore, while ERO1B and CPS1 were negatively correlated (Figure 8B). We delved deeper into the correlation between prognostic genes and immune cells utilizing the “CIBERSORT” and “MCPcounter” algorithms. The prognostic genes were found to be significantly correlated with B cells, T cells, and macrophages (Figure 8C). It was noteworthy that CORO1A was significantly positively correlated with T cells, B cells, NK cells, and myeloid dendritic cells (Figure 8D).
Figure 8.

Correlation of prognostic genes with immune and stromal components. A. Correlation between prognostic gene expression levels and ImmuneScore. B. The heatmap shows correlation of prognostic genes with ImmuneScore, StromalScore and ESTIMATEScore. C. The heatmap shows the correlation of prognostic genes with 22 types of immune-related cells (*P < 0.05, **P < 0.01, ***P < 0.001). D. The heatmap shows the correlation of prognostic genes with 10 types of immune-related cells.
Predicting tumor treatment response
We subsequently utilized external validation sets (IMvigor210 and GSE78220) to ascertain whether the predictive risk model could predict patient responses to tumor treatment. Utilizing the risk score formula, we categorized patients from the IMvigor210 and GSE78220 datasets into high- and low-risk groups, respectively. We found that the survival analysis results of the external validation set were consistent with those of the test set and the internal validation set. The Overall Survival (OS) in the high-risk group was inferior to that in the low-risk group (IMvigor210: P < 0.012; GSE78220: P = 0.0091; Figure 9A, 9F). Based on the IMvigor210 dataset, we observed that the risk score of the group that responded to tumor treatment (CR/PR) was lower than that of the group that did not respond to tumor treatment (PD/SD) (Figure 9B). Moreover, the high-risk percentage in the PD/SD group was higher than that in the CR/PR group (82% and 72%, respectively, Figure 9C). Additionally, we performed separate risk scores for patients with clinical stages I and II and for patients with clinical stages III and IV. Subsequently, through survival analysis, we discovered that the predictive risk model was more sensitive for predicting patients with early-stage tumors than those with advanced-stage tumors (Figure 9D, 9E). Based on the GSE78220 dataset, we found no significant difference in risk scores between the tumor treatment-refractory group (PD) and the tumor treatment-responsive group (PR/CR) (Figure 9F, 9G). However, the high-risk percentage in the PD group was significantly higher than that in the PR/CR group (62% and 27%, respectively, Figure 9H). These results indicated that predictive risk models can effectively predict patient responses to cancer treatment, especially for patients with early-stage tumors.
Figure 9.

Evaluating a risk model’s predictive accuracy for treatment response and survival. A. Kaplan-Meier analysis based on IMvigor210 dataset. B. Differences in risk scores for different clinical response groups based on the IMvigor210 dataset. C. Proportions of high- and low-risk in different clinical response groups based on the IMvigor210 dataset. D. Based on the IMvigor210 dataset, Kaplan-Meier analysis was performed on the risk scores of clinical stages I and stages II patients. E. Based on the IMvigor210 dataset, Kaplan-Meier analysis was performed on the risk scores of clinical stages III and stages IV patients. F. Kaplan-Meier analysis based on GSE78220 dataset. G. Differences in risk scores for different clinical response groups based on the GSE78220 dataset. H. Proportions of high- and low-risk in different clinical response groups based on the GSE78220 dataset.
We conducted pharmacological response predictions for high- and low-risk patients using the CGP database. Ultimately, based on the standards, we screened out six compounds, namely AS601245, Axitinib, AZD8055, AP.24534, Nilotinib, and Temsirolimus (Supplementary Figure 6A). Patients in the low-risk group exhibited greater sensitivity to these six compounds compared to those in the high-risk group (Supplementary Figure 6B-G).
Prognostic geneset activity assessment
To delve deeper into the prognostic gene set, we scored the prognostic gene set of each cell in the KRAS/TP53 MUT group and WT group using AUCell, Ucell, singscore, ssgsea, and Add algorithms (Figure 10A). The scoring results were integrated and standardized to obtain the total score (Scoring) (Figure 10B). The results indicated that, between the KRAS/TP53 MUT group and the WT group, there were significant differences in the prognostic gene set scores in nine cell groups, with the exception of tissue stem cells (Figure 10C). Notably, the score of epithelial cells in the KRAS/TP53 MUT group was higher than that in the WT group. Since lung adenocarcinoma originates from the bronchial mucosal epithelium, we further explored based on epithelial cells. Dividing epithelial cells into HighRisk and LowRisk based on the median score, we identified communication differences between the two subtypes (Figure 10D, 10E). We observed that LowRisk epithelial cells exhibited stronger outward interaction ability on complement signaling pathways than HighRisk epithelial cells (Figure 10F). Epithelial cells underwent multiple subtypes before and after the node (Figure 10G, 10H). Furthermore, as the trajectory progressed, ERO1B, FAM83A, and CPS1 were gradually up-regulated with the transition, while MELTF and PLEK2 were gradually down-regulated with the transition (Figure 10I).
Figure 10.

Cell type scoring, interaction, and trajectory analysis in KRAS/TP53 MUT and WT groups. A. The Violin plot shows the prognostic genesets scored for ten cell types in the KRAS/TP53 MUT group and WT group based on different algorithms. B. The Bubble chart shows the scoring cluster markers of ten types of cells by different algorithms. C. The Violin plot shows the scoring of ten cell types on the prognostic geneset between the KRAS/TP53 MUT group and the WT group (*P < 0.05, **P < 0.001, ***P < 0.0001 and ****P < 0.00001). D and E. The number of interactions between cells and the proportion of interactions. F. The heatmap shows the signal flow pattern of mutual recognition cells between cells in the KRAS/TP53 MUT group. G and H. Trajectories showing pseudo-time-dependent cellular states of epithelial cells in the IKRAS/TP53 MUT group. I. The heatmap shows the expression of seven prognostic genes over pseudo-time.
In vitro experimental verification
The elevated expression of MELTF and PLEK2 genes in epithelial cells during early pseudotime prompted us to further investigate MELTF and PLEK2 in lung cancer cells. Initially, we utilized siRNA to interfere with MELTF and PLEK2 in A549 and H1299 cells. Western blot analysis revealed that both siMELTF and siPLEK2 diminished the protein levels of MELTF and PLEK2 in A549 and H1299 cells (Figure 11A). Through the CCK8 assay, we also discovered that interference with MELTF and PLEK2 expression resulted in a decline in the proliferation rate of A549 and H1299 cells (Figure 11B). Subsequently, we employed the wound-healing assay to evaluate the invasive capability of the tumor cells. Our findings demonstrated that disrupting MELTF and PLEK2 expression significantly curtailed the invasive ability of A549 and H1299 cells (Figure 11C, 11D), indicating their pivotal role in the invasiveness of lung cancer cells. Furthermore, we conducted transwell assay to observe the cell migration capability during wound closure. Results indicated that interfering with MELTF and PLEK2 expression markedly impaired the migratory capacity of A549 and H1299 cells (Figure 11E, 11F), reinforcing their potential value as biomarkers or therapeutic targets for LUAD patients. These findings provided critical insights for further research into the functions of MELTF and PLEK2, as well as their potential roles in the treatment of patients with lung adenocarcinoma.
Figure 11.

Impact of MELTF and PLEK2 knockdown on protein levels, proliferation, invasion, and migration in A549 and H1299 cells. A. Protein levels of MELTF and PLEK2 in A549 and H1299 cells after siRNA interference respectively. B. Proliferation rate of A549 and H1299 cells post MELTF and PLEK2 interference using the CCK8 assay. C. Invasive capability of A549 and H1299 cells after MELTF knockdown via wound-healing assay. D. Invasive capability of A549 and H1299 cells after PLEK2 knockdown via wound-healing assay. E. Migration ability of A549 and H1299 cells post MELTF interference in the transwell assay. F. Statistical analysis of the migration ability of A549 and H1299 cells post PLEK2 interference in the transwell assay.
Discussion
Tumor heterogeneity is a pivotal factor influencing tumor development and clinical treatment strategies. Specifically, the impact of genetic heterogeneity on tumors has consistently been a focal point of research. Penetrating tumor heterogeneity is a formidable task. In recent years, scRNA-seq has emerged as a novel aid in studying tumor heterogeneity. With the advent of continuously innovative algorithms, further mining of scRNA-seq data facilitates our in-depth analysis of intercellular differences.
In this study, we systematically compared the disparities in LUAD between the KRAS/TP53 MUT group and the WT group. We discovered that, compared to the WT group, the proportion of B cells in the KRAS/TP53 MUT group significantly increased. B cells are the primary effector cells of the humoral immune response. Although T cells have become the principal target cells in current clinical treatments with the clinical application of immune checkpoint inhibitors, some patients remain unresponsive to these treatments. Thus, exploring B cells in the TME can assist in developing new cancer treatment strategies. We found that certain B cell subtypes constituted a higher proportion in the KRAS/TP53 MUT group and observed that such B cells possess a robust ability to interact. This implied that such B cell heterogeneity revealed by intercellular communication analysis may result from different KRAS/TP53 mutation status. We then utilized hdWGCNA and univariate Cox regression to identify 66 candidate genes. LUAD patients were subsequently divided into two clusters through consensus cluster analysis. We identified significant differences in survival rates between the two clusters, as well as substantial disparities in the degree of immune infiltration between clusters. Previous studies reported that LUAD patients with flamed tumor microenvironment composed of plasmacytoid dendritic cells or myeloid-derived suppressor cells (MDSCs) rendered prognostically poor [17,18]. Besides, inflammatory signals (IFN-γ, for instance) secreted as cytokines furtehr flamed the tumor microenvironment by redirecting the cellular cascades of immune cells, whereby downregulating programmed death ligand-1 (PD-L1) expression in cancer and host cells and enhancing tumor immune escape [19-21]. Additionally, through TIDE scoring, the T cell dysfunction and exclusion scores of cluster 1 were both significantly higher than those of cluster 2. Accordingly, observations from our study suggested that LUAD patients in cluster 1 harbored activated immune mincroenvironment, more abundant infiltration levels of plasmacytoid dendritic cells and MDSCs, higher scoring of IFN-γ, T cell dysfunction and exclusion. All these cellular and molecular characteristics evidenced the unfavourable clinical outcomes and enhanced tumor immune escape of cluster 1. Therefore, we discerned that the potential for patients in cluster 2 to benefit from immunotherapy is substantial, while patients in cluster 1 may better gain survival improvement via anti-MDSCs therapies, such as P53 vaccine and all-trans retinoic acid (ATRA) [22], bevacizumab and tyrosine kinase inhibitor (TKI) targeting epidermal growth factor receptor (EGFR) [23], resveratrol [24], and curcumin [25], etc.
Subsequently, we conducted univariate Cox regression and LASSO regression based on the DEGs obtained from inter-cluster difference analysis to construct a novel predictive risk model, comprising seven prognostic genes: MELTF, PLEK2, CPS1, FAM83A, DKK1, ERO1B, and CORO1A. The predictive risk model exhibited robust performance across both internal and external validation sets. Furthermore, significant differences in risk scores were observed among different genders, TN stages, and clinical stage features. Univariate and multivariate Cox regression analyses demonstrated that the risk score can independently serve as a prognostic factor. To enhance the predictive capability of the risk model, we integrated the risk score with each clinical feature to construct a prognostic nomogram for predicting overall survival in LUAD patients. Additionally, we utilized an external validation set to verify that the predictive risk model can effectively predict patients’ responses to tumor treatment, especially for patients with early-stage tumors.
In the seven prognostic genes of the prognostic risk model. There are few MELTF-related studies on LUAD, but studies on MELTF Antisense RNA 1 (MFI2-AS1) have shown that MELTF-AS1 is associated with shortened survival time [26,27]. MELTF-AS1 is significantly up-regulated in non-small cell lung cancer (NSCLC), and interfering with MELTF-AS1 expression can inhibit the proliferation, metastasis, and invasion capabilities of tumor cells [28,29]. PLEK2 has the ability to arrange muscular protein distribution in the cell, which can induce cell diffusion [30]. In addition, PLEK2 is also involved in many important processes in tumor development, including tumors, drug resistance, and immune evasion [31-34]. Research on PLEK2 in lung cancer has already been carried out. Wu et al. found that PLEK2 can promote epithelial-mesenchymal transition (EMT), migration and invasion of NSCLC cells, and destroy the vascular endothelial barrier [33]. CPS1, as one of the carbamoyl phosphate synthases, plays an important role in removing excess ammonia from cells [35]. Çeliktas et al. discovered the functional relevance of CPS1 in liver kinase B1 (LKB1)-inactivated LUAD and its association with adverse LUAD outcomes [35]. In the same year, Kim et al. found that CPS1 has the ability to maintain the pyrimidine pool and DNA synthesis in lung cancer cells with KRAS/LKB1 mutation [36]. Interfering with CPS1 expression can reduce the growth of LUAD cells, reduce metabolite levels, and produce additive effects when combined with other chemotherapy drugs [35]. FAM83A exhibits oncogenic properties in a variety of cancers [37]. Specifically, overexpression of FAM83A in primary cells induces metabolic activation and cell proliferation of primary cells and immortalized cells [38]. In addition, studies have found that FAM38A antisense RNA 1 (FAM83A-AS1) can regulate the expression of its homologous FAM38A, thereby affecting the phosphorylation of ERK2/83 and the HIF-1α/glycolysis axis, thus promoting the proliferation and stemness of LUAD cells [39,40]. DKK1 is a classic Wnt/β-catenin pathway antagonist [41]. DKK1 has been used as a serological marker for diagnosis and prognostic evaluation and a new target for tumor treatment in several cancers. For example, interfering with the expression of DKK1 inhibits the growth of hepatocellular carcinoma (HCC) cells [42]. Furthermore, the interaction between DKK1 and cytoskeleton-associated protein 4 (CKAP4) present on macrophage membranes can trigger downstream PI3K-AKT signaling, leading to the development of an immunosuppressive microenvironment [43]. In addition to inducing tumor cell proliferation, growth and immunosuppression. Tumor-secreted DKK1 promotes tumor cell bone metastasis by regulating canonical WNT signaling in osteoblasts [44]. ERO1B, as an endoplasmic reticulum disulfide oxidase, participates in protein folding in the endoplasmic reticulum [45]. ERO1B has been found to have potential value in predicting the prognosis of various cancers, including lung cancer [46-48]. CORO1A has the function of regulating the secretion of extracellular vesicles, and also regulates the recruitment of protein kinase C-θ (PKCθ) and the downstream functions of T cell receptors [49,50]. Previous studies have also found that CORO1A is positively correlated with the TNM stage of NSCLC, but there is no further in-depth description [51]. In this study, we observed a significant association between this prognostic risk model and pathways associated with the immune system. In particular, CORO1A is positively correlated with a variety of immune cells, including T cells, B cells, and NK cells. The specific relevant signaling pathways require further in-depth study.
The prognostic genesets in epithelial cells were subsequently found to be different between the KRAS/TP53 MUT group and the WT group. As the origin of lung adenocarcinoma cells, epithelial cells still have many unresolved questions regarding their evolution into lung adenocarcinoma cells. Through pseudotime analysis, we found that MELTF and PLEK2 genes in epithelial cells are highly expressed in the early pseudo time. As pseudo time progressed, the expression levels of these two genes will gradually decrease. Current studies on MELTF-AS1 and PLEK2 related to tumor have shown that MELTF and PLEK2 are related to tumor invasion and cell proliferation. Therefore, we conducted in vitro experiments to verify the functions of these two genes. Finally, we found that interfering with the expression of MELTF and PLEK2 can affect the invasion and proliferation capabilities of A549 and H1299 cells. These findings also support the potential of MELTF and PLEK2 as biomarkers and therapeutic targets for LUAD patients.
Conclusions
This study underscores the pivotal role of KRAS/TP53 co-mutations in influencing the heterogeneity of LUAD. These co-mutations may impact the prognosis of LUAD patients by modulating immune-related pathways, particularly those involving B cells. The innovative predictive risk model developed herein offers a valuable tool for formulating clinical treatment strategies and predicting efficacy for LUAD patients. Notably, the prognostic genes identified in this study, especially MELTF and PLEK2, hold promise as potential biomarkers or therapeutic targets for LUAD patients.
Acknowledgements
We would like to show gratitude for the kind support from Shenzhen High-level Hospital Construction Fund. Besides, we thank the staff and patients who contributed data and publicly available databases.
Disclosure of conflict of interest
All authors declare that the research was conducted in the absence of any circumstances that could be construed as a potential conflict of interest.
Supporting Information
References
- 1.Thai AA, Solomon BJ, Sequist LV, Gainor JF, Heist RS. Lung cancer. Lancet. 2021;398:535–554. doi: 10.1016/S0140-6736(21)00312-3. [DOI] [PubMed] [Google Scholar]
- 2.Nicholson AG, Tsao MS, Beasley MB, Borczuk AC, Brambilla E, Cooper WA, Dacic S, Jain D, Kerr KM, Lantuejoul S, Noguchi M, Papotti M, Rekhtman N, Scagliotti G, van Schil P, Sholl L, Yatabe Y, Yoshida A, Travis WD. The 2021 WHO classification of lung tumors: impact of advances since 2015. J Thorac Oncol. 2022;17:362–387. doi: 10.1016/j.jtho.2021.11.003. [DOI] [PubMed] [Google Scholar]
- 3.Seguin L, Durandy M, Feral CC. Lung adenocarcinoma tumor origin: a guide for personalized medicine. Cancers (Basel) 2022;14:1759. doi: 10.3390/cancers14071759. [DOI] [PMC free article] [PubMed] [Google Scholar]
- 4.Xiao Y, Yu D. Tumor microenvironment as a therapeutic target in cancer. Pharmacol Ther. 2021;221:107753. doi: 10.1016/j.pharmthera.2020.107753. [DOI] [PMC free article] [PubMed] [Google Scholar]
- 5.Prior IA, Hood FE, Hartley JL. The frequency of ras mutations in cancer. Cancer Res. 2020;80:2969–2974. doi: 10.1158/0008-5472.CAN-19-3682. [DOI] [PMC free article] [PubMed] [Google Scholar]
- 6.Uras IZ, Moll HP, Casanova E. Targeting KRAS mutant non-small-cell lung cancer: past, present and future. Int J Mol Sci. 2020;21:4325. doi: 10.3390/ijms21124325. [DOI] [PMC free article] [PubMed] [Google Scholar]
- 7.Kerk SA, Papagiannakopoulos T, Shah YM, Lyssiotis CA. Metabolic networks in mutant KRAS-driven tumours: tissue specificities and the microenvironment. Nat Rev Cancer. 2021;21:510–525. doi: 10.1038/s41568-021-00375-9. [DOI] [PMC free article] [PubMed] [Google Scholar]
- 8.Drosten M, Barbacid M. Targeting KRAS mutant lung cancer: light at the end of the tunnel. Mol Oncol. 2022;16:1057–1071. doi: 10.1002/1878-0261.13168. [DOI] [PMC free article] [PubMed] [Google Scholar]
- 9.Gu M, Xu T, Chang P. KRAS/LKB1 and KRAS/TP53 co-mutations create divergent immune signatures in lung adenocarcinomas. Ther Adv Med Oncol. 2021;13:175883592–11006950. doi: 10.1177/17588359211006950. [DOI] [PMC free article] [PubMed] [Google Scholar]
- 10.Dong ZY, Zhong WZ, Zhang XC, Su J, Xie Z, Liu SY, Tu HY, Chen HJ, Sun YL, Zhou Q, Yang JJ, Yang XN, Lin JX, Yan HH, Zhai HR, Yan LX, Liao RQ, Wu SP, Wu YL. Potential predictive value of TP53 and KRAS mutation status for response to PD-1 blockade immunotherapy in lung adenocarcinoma. Clin Cancer Res. 2017;23:3012–3024. doi: 10.1158/1078-0432.CCR-16-2554. [DOI] [PubMed] [Google Scholar]
- 11.Cancer Genome Atlas Research Network. Comprehensive molecular profiling of lung adenocarcinoma. Nature. 2014;511:543–50. doi: 10.1038/nature13385. [DOI] [PMC free article] [PubMed] [Google Scholar]
- 12.Skoulidis F, Goldberg ME, Greenawalt DM, Hellmann MD, Awad MM, Gainor JF, Schrock AB, Hartmaier RJ, Trabucco SE, Gay L, Ali SM, Elvin JA, Singal G, Ross JS, Fabrizio D, Szabo PM, Chang H, Sasson A, Srinivasan S, Kirov S, Szustakowski J, Vitazka P, Edwards R, Bufill JA, Sharma N, Ou SI, Peled N, Spigel DR, Rizvi H, Aguilar EJ, Carter BW, Erasmus J, Halpenny DF, Plodkowski AJ, Long NM, Nishino M, Denning WL, Galan-Cobo A, Hamdi H, Hirz T, Tong P, Wang J, Rodriguez-Canales J, Villalobos PA, Parra ER, Kalhor N, Sholl LM, Sauter JL, Jungbluth AA, Mino-Kenudson M, Azimi R, Elamin YY, Zhang J, Leonardi GC, Jiang F, Wong KK, Lee JJ, Papadimitrakopoulou VA, Wistuba II, Miller VA, Frampton GM, Wolchok JD, Shaw AT, Jänne PA, Stephens PJ, Rudin CM, Geese WJ, Albacker LA, Heymach JV. STK11/LKB1 mutations and PD-1 inhibitor resistance in KRAS-mutant lung adenocarcinoma. Cancer Discov. 2018;8:822–835. doi: 10.1158/2159-8290.CD-18-0099. [DOI] [PMC free article] [PubMed] [Google Scholar]
- 13.Ding L, Getz G, Wheeler DA, Mardis ER, McLellan MD, Cibulskis K, Sougnez C, Greulich H, Muzny DM, Morgan MB, Fulton L, Fulton RS, Zhang Q, Wendl MC, Lawrence MS, Larson DE, Chen K, Dooling DJ, Sabo A, Hawes AC, Shen H, Jhangiani SN, Lewis LR, Hall O, Zhu Y, Mathew T, Ren Y, Yao J, Scherer SE, Clerc K, Metcalf GA, Ng B, Milosavljevic A, Gonzalez-Garay ML, Osborne JR, Meyer R, Shi X, Tang Y, Koboldt DC, Lin L, Abbott R, Miner TL, Pohl C, Fewell G, Haipek C, Schmidt H, Dunford-Shore BH, Kraja A, Crosby SD, Sawyer CS, Vickery T, Sander S, Robinson J, Winckler W, Baldwin J, Chirieac LR, Dutt A, Fennell T, Hanna M, Johnson BE, Onofrio RC, Thomas RK, Tonon G, Weir BA, Zhao X, Ziaugra L, Zody MC, Giordano T, Orringer MB, Roth JA, Spitz MR, Wistuba II, Ozenberger B, Good PJ, Chang AC, Beer DG, Watson MA, Ladanyi M, Broderick S, Yoshizawa A, Travis WD, Pao W, Province MA, Weinstock GM, Varmus HE, Gabriel SB, Lander ES, Gibbs RA, Meyerson M, Wilson RK. Somatic mutations affect key pathways in lung adenocarcinoma. Nature. 2008;455:1069–75. doi: 10.1038/nature07423. [DOI] [PMC free article] [PubMed] [Google Scholar]
- 14.Schabath MB, Welsh EA, Fulp WJ, Chen L, Teer JK, Thompson ZJ, Engel BE, Xie M, Berglund AE, Creelan BC, Antonia SJ, Gray JE, Eschrich SA, Chen DT, Cress WD, Haura EB, Beg AA. Differential association of STK11 and TP53 with KRAS mutation-associated gene expression, proliferation and immune surveillance in lung adenocarcinoma. Oncogene. 2016;35:3209–16. doi: 10.1038/onc.2015.375. [DOI] [PMC free article] [PubMed] [Google Scholar]
- 15.Busch SE, Hanke ML, Kargl J, Metz HE, MacPherson D, Houghton AM. Lung cancer subtypes generate unique immune responses. J Immunol. 2016;197:4493–4503. doi: 10.4049/jimmunol.1600576. [DOI] [PMC free article] [PubMed] [Google Scholar]
- 16.Wellenstein MD, de Visser KE. Cancer-cellintrinsic mechanisms shaping the tumor immune landscape. Immunity. 2018;48:399–416. doi: 10.1016/j.immuni.2018.03.004. [DOI] [PubMed] [Google Scholar]
- 17.Bischoff P, Trinks A, Obermayer B, Pett JP, Wiederspahn J, Uhlitz F, Liang X, Lehmann A, Jurmeister P, Elsner A, Dziodzio T, Rückert JC, Neudecker J, Falk C, Beule D, Sers C, Morkel M, Horst D, Blüthgen N, Klauschen F. Single-cell RNA sequencing reveals distinct tumor microenvironmental patterns in lung adenocarcinoma. Oncogene. 2021;40:6748–6758. doi: 10.1038/s41388-021-02054-3. [DOI] [PMC free article] [PubMed] [Google Scholar]
- 18.Yang Z, Guo J, Weng L, Tang W, Jin S, Ma W. Myeloid-derived suppressor cells-new and exciting players in lung cancer. J Hematol Oncol. 2020;13:10. doi: 10.1186/s13045-020-0843-1. [DOI] [PMC free article] [PubMed] [Google Scholar]
- 19.Ayers M, Lunceford J, Nebozhyn M, Murphy E, Loboda A, Kaufman DR, Albright A, Cheng JD, Kang SP, Shankaran V, Piha-Paul SA, Yearley J, Seiwert TY, Ribas A, McClanahan TK. IFN-γ-related mRNA profile predicts clinical response to PD-1 blockade. J Clin Invest. 2017;127:2930–2940. doi: 10.1172/JCI91190. [DOI] [PMC free article] [PubMed] [Google Scholar]
- 20.Gao Y, Yang J, Cai Y, Fu S, Zhang N, Fu X, Li L. IFN-γ-mediated inhibition of lung cancer correlates with PD-L1 expression and is regulated by PI3K-AKT signaling. Int J Cancer. 2018;143:931–943. doi: 10.1002/ijc.31357. [DOI] [PubMed] [Google Scholar]
- 21.Gao Y, Lu J, Zeng C, Yang J, Huang B, Zhang N, Li L, Fu X. IL-10 suppresses IFN-γ-mediated signaling in lung adenocarcinoma. Clin Exp Med. 2020;20:449–459. doi: 10.1007/s10238-020-00626-3. [DOI] [PubMed] [Google Scholar]
- 22.Iclozan C, Antonia S, Chiappori A, Chen DT, Gabrilovich D. Therapeutic regulation of myeloid-derived suppressor cells and immune response to cancer vaccine in patients with extensive stage small cell lung cancer. Cancer Immunol Immunother. 2013;62:909–18. doi: 10.1007/s00262-013-1396-8. [DOI] [PMC free article] [PubMed] [Google Scholar]
- 23.Feng PH, Chen KY, Huang YC, Luo CS, Wu SM, Chen TT, Lee CN, Yeh CT, Chuang HC, Han CL, Lin CF, Lee WH, Kuo CH, Lee KY. Bevacizumab reduces S100A9-positive MDSCs linked to intracranial control in patients with EGFR-mutant lung adenocarcinoma. J Thorac Oncol. 2018;13:958–967. doi: 10.1016/j.jtho.2018.03.032. [DOI] [PubMed] [Google Scholar]
- 24.Zhao Y, Shao Q, Zhu H, Xu H, Long W, Yu B, Zhou L, Xu H, Wu Y, Su Z. Resveratrol ameliorates Lewis lung carcinoma-bearing mice development, decreases granulocytic myeloidderived suppressor cell accumulation and impairs its suppressive ability. Cancer Sci. 2018;109:2677–2686. doi: 10.1111/cas.13720. [DOI] [PMC free article] [PubMed] [Google Scholar]
- 25.Liu D, You M, Xu Y, Li F, Zhang D, Li X, Hou Y. Inhibition of curcumin on myeloid-derived suppressor cells is requisite for controlling lung cancer. Int Immunopharmacol. 2016;39:265–272. doi: 10.1016/j.intimp.2016.07.035. [DOI] [PubMed] [Google Scholar]
- 26.Ding L, Liu T, Qu Y, Kang Z, Guo L, Zhang H, Jiang J, Qu F, Ge W, Zhang S. lncRNA MELTFAS1 facilitates osteosarcoma metastasis by modulating MMP14 expression. Mol Ther Nucleic Acids. 2021;26:787–97. doi: 10.1016/j.omtn.2021.08.022. [DOI] [PMC free article] [PubMed] [Google Scholar]
- 27.Flippot R, Mouawad R, Spano JP, Rouprêt M, Compérat E, Bitker MO, Parra J, Vaessen C, Allanic F, Manach Q, Tannir NM, Khayat D, Su X, Malouf GG. Expression of long non-coding RNA MFI2-AS1 is a strong predictor of recurrence in sporadic localized clear-cell renal cell carcinoma. Sci Rep. 2017;7:8540. doi: 10.1038/s41598-017-08363-6. [DOI] [PMC free article] [PubMed] [Google Scholar]
- 28.Chai J, Qin L, Zhang G, Hua P, Jin C. Long non-coding MELTF antisense RNA 1 promotes and prognosis the progression of non-small cell lung cancer by targeting miR-1299. Bioengineered. 2022;13:10594–604. doi: 10.1080/21655979.2022.2063563. [DOI] [PMC free article] [PubMed] [Google Scholar]
- 29.Lu X, Wang J, Wang W, Lu C, Qu T, He X, Liu X, Guo R, Zhang E. Copy number amplification and SP1-activated lncRNA MELTF-AS1 regulates tumorigenesis by driving phase separation of YBX1 to activate ANXA8 in non-small cell lung cancer. Oncogene. 2022;41:3222–38. doi: 10.1038/s41388-022-02292-z. [DOI] [PubMed] [Google Scholar]
- 30.Shen H, He M, Lin R, Zhan M, Xu S, Huang X, Xu C, Chen W, Yao Y, Mohan M, Wang J. PLEK2 promotes gallbladder cancer invasion and metastasis through EGFR/CCL2 pathway. J Exp Clin Cancer Res. 2019;38:247. doi: 10.1186/s13046-019-1250-8. [DOI] [PMC free article] [PubMed] [Google Scholar]
- 31.Zhao X, Shu D, Sun W, Si S, Ran W, Guo B, Cui L. PLEK2 promotes cancer stemness and tumorigenesis of head and neck squamous cell carcinoma via the c-Myc-mediated positive feedback loop. Cancer Commun (Lond) 2022;42:987–1007. doi: 10.1002/cac2.12349. [DOI] [PMC free article] [PubMed] [Google Scholar]
- 32.Wang F, Zhang C, Cheng H, Liu C, Lu Z, Zheng S, Wang S, Sun N, He J. TGF-beta-induced PLEK2 promotes metastasis and chemoresistance in oesophageal squamous cell carcinoma by regulating LCN2. Cell Death Dis. 2021;12:901. doi: 10.1038/s41419-021-04155-z. [DOI] [PMC free article] [PubMed] [Google Scholar]
- 33.Wu DM, Deng SH, Zhou J, Han R, Liu T, Zhang T, Li J, Chen JP, Xu Y. PLEK2 mediates metastasis and vascular invasion via the ubiquitin-dependent degradation of SHIP2 in nonsmall cell lung cancer. Int J Cancer. 2020;146:2563–75. doi: 10.1002/ijc.32675. [DOI] [PubMed] [Google Scholar]
- 34.Mao D, Zhou Z, Chen H, Liu X, Li D, Chen X, He Y, Liu M, Zhang C. Pleckstrin-2 promotes tumour immune escape from NK cells by activating the MT1-MMP-MICA signalling axis in gastric cancer. Cancer Lett. 2023;572:216351. doi: 10.1016/j.canlet.2023.216351. [DOI] [PubMed] [Google Scholar]
- 35.Celiktas M, Tanaka I, Tripathi SC, Fahrmann JF, Aguilar-Bonavides C, Villalobos P, Delgado O, Dhillon D, Dennison JB, Ostrin EJ, Wang H, Behrens C, Do KA, Gazdar AF, Hanash SM, Taguchi A. Role of CPS1 in cell growth, metabolism and prognosis in LKB1-inactivated lung adenocarcinoma. J Natl Cancer Inst. 2017;109:1–9. doi: 10.1093/jnci/djw231. [DOI] [PMC free article] [PubMed] [Google Scholar]
- 36.Kim J, Hu Z, Cai L, Li K, Choi E, Faubert B, Bezwada D, Rodriguez-Canales J, Villalobos P, Lin YF, Ni M, Huffman KE, Girard L, Byers LA, Unsal-Kacmaz K, Peña CG, Heymach JV, Wauters E, Vansteenkiste J, Castrillon DH, Chen BPC, Wistuba I, Lambrechts D, Xu J, Minna JD, DeBerardinis RJ. CPS1 maintains pyrimidine pools and DNA synthesis in KRAS/LKB1-mutant lung cancer cells. Nature. 2017;546:168–72. doi: 10.1038/nature22359. [DOI] [PMC free article] [PubMed] [Google Scholar]
- 37.Snijders AM, Lee SY, Hang B, Hao W, Bissell MJ, Mao JH. FAM83 family oncogenes are broadly involved in human cancers: an integrative multi-omics approach. Mol Oncol. 2017;11:167–79. doi: 10.1002/1878-0261.12016. [DOI] [PMC free article] [PubMed] [Google Scholar]
- 38.Marino N, German R, Podicheti R, Rockey P, Sandusky GE, Temm CJ, Nakshatri H, Addison RJ, Selman B, Althouse SK, Storniolo AMV. FAM83A is a potential biomarker for breast cancer initiation. Biomark Res. 2022;10:8. doi: 10.1186/s40364-022-00353-9. [DOI] [PMC free article] [PubMed] [Google Scholar]
- 39.Shi R, Jiao Z, Yu A, Wang T. Long noncoding antisense RNA FAM83A-AS1 promotes lung cancer cell progression by increasing FAM83A. J Cell Biochem. 2019;120:10505–12. doi: 10.1002/jcb.28336. [DOI] [PMC free article] [PubMed] [Google Scholar]
- 40.Chen Z, Hu Z, Sui Q, Huang Y, Zhao M, Li M, Liang J, Lu T, Zhan C, Lin Z, Sun F, Wang Q, Tan L. LncRNA FAM83A-AS1 facilitates tumor proliferation and the migration via the HIF-1alpha/glycolysis axis in lung adenocarcinoma. Int J Biol Sci. 2022;18:522–35. doi: 10.7150/ijbs.67556. [DOI] [PMC free article] [PubMed] [Google Scholar]
- 41.Kikuchi A, Fumoto K, Kimura H. The Dickkopf1-cytoskeleton-associated protein 4 axis creates a novel signalling pathway and may represent a molecular target for cancer therapy. Br J Pharmacol. 2017;174:4651–65. doi: 10.1111/bph.13863. [DOI] [PMC free article] [PubMed] [Google Scholar]
- 42.Iguchi K, Sada R, Matsumoto S, Kimura H, Zen Y, Akita M, Gon H, Fukumoto T, Kikuchi A. DKK1-CKAP4 signal axis promotes hepatocellular carcinoma aggressiveness. Cancer Sci. 2023;114:2063–77. doi: 10.1111/cas.15743. [DOI] [PMC free article] [PubMed] [Google Scholar]
- 43.Shi T, Zhang Y, Wang Y, Song X, Wang H, Zhou X, Liang K, Luo Y, Che K, Wang X, Pan Y, Liu F, Yang J, Liu Q, Yu L, Liu B, Wei J. DKK1 promotes tumor immune evasion and impedes anti-PD-1 treatment by inducing immunosuppressive macrophages in gastric cancer. Cancer Immunol Res. 2022;10:1506–24. doi: 10.1158/2326-6066.CIR-22-0218. [DOI] [PubMed] [Google Scholar]
- 44.Zhuang X, Zhang H, Li X, Li X, Cong M, Peng F, Yu J, Zhang X, Yang Q, Hu G. Differential effects on lung and bone metastasis of breast cancer by Wnt signalling inhibitor DKK1. Nat Cell Biol. 2017;19:1274–85. doi: 10.1038/ncb3613. [DOI] [PubMed] [Google Scholar]
- 45.Pagani M, Fabbri M, Benedetti C, Fassio A, Pilati S, Bulleid NJ, Cabibbo A, Sitia R. Endoplasmic reticulum oxidoreductin 1-lbeta (ERO1-Lbeta), a human gene induced in the course of the unfolded protein response. J Biol Chem. 2000;275:23685–92. doi: 10.1074/jbc.M003061200. [DOI] [PubMed] [Google Scholar]
- 46.Asada K, Kobayashi K, Joutard S, Tubaki M, Takahashi S, Takasawa K, Komatsu M, Kaneko S, Sese J, Hamamoto R. Uncovering prognosis-related genes and pathways by multiomics analysis in lung cancer. Biomolecules. 2020;10:524. doi: 10.3390/biom10040524. [DOI] [PMC free article] [PubMed] [Google Scholar]
- 47.Jiang F, Lu DF, Zhan Z, Yuan GQ, Liu GJ, Gu JY, Sun XO, Wang Z. SARS-CoV-2 pattern provides a new scoring system and predicts the prognosis and immune therapeutic response in glioma. Cells. 2022;11:3997. doi: 10.3390/cells11243997. [DOI] [PMC free article] [PubMed] [Google Scholar]
- 48.Dai J, Reyimu A, Sun A, Duoji Z, Zhou W, Liang S, Hu S, Dai W, Xu X. Establishment of prognostic risk model and drug sensitivity based on prognostic related genes of esophageal cancer. Sci Rep. 2022;12:8008. doi: 10.1038/s41598-022-11760-1. [DOI] [PMC free article] [PubMed] [Google Scholar]
- 49.Fei X, Li Z, Yang D, Kong X, Lu X, Shen Y, Li X, Xie S, Wang J, Zhao Y, Sun Y, Zhang J, Ye Z, Wang J, Cai Z. Neddylation of Coro1a determines the fate of multivesicular bodies and biogenesis of extracellular vesicles. J Extracell Vesicles. 2021;10:e12153. doi: 10.1002/jev2.12153. [DOI] [PMC free article] [PubMed] [Google Scholar]
- 50.Siegmund K, Thuille N, Posch N, Fresser F, Baier G. Novel protein kinase C theta: coronin 1A complex in T lymphocytes. Cell Commun Signal. 2015;13:22. doi: 10.1186/s12964-015-0100-3. [DOI] [PMC free article] [PubMed] [Google Scholar]
- 51.Bao M, Huang Y, Lang Z, Zhao H, Saito Y, Nagano T, Kawagoe I, Divisi D, Hu X, Jiang G. Proteomic analysis of plasma exosomes in patients with non-small cell lung cancer. Transl Lung Cancer Res. 2022;11:1434–52. doi: 10.21037/tlcr-22-467. [DOI] [PMC free article] [PubMed] [Google Scholar]
Associated Data
This section collects any data citations, data availability statements, or supplementary materials included in this article.