

Abstract
Objectives
To examine whether community health centers (CHCs) are effective in offsetting mental health emergency department (ED) visits.
Data Sources and Study Setting
The HRSA Uniform Data System and the HCUP State ED Databases for Florida patients during 2012–2019.
Study Design
We identified CHC‐year‐specific service areas using patient origin zip codes. We then estimated panel data models for number of ED mental health visits per capita in a CHC's service area. Models measured CHC mental health utilization as number of visits, unique patients, and intensity (visits per patient).
Principal Findings
CHC mental health utilization increased approximately 100% during 2012–2019. Increased CHC mental health provision was associated with small reductions in ED mental health utilization. An annual increase of 1000 CHC mental health care visits (5%) was associated with 0.44% fewer ED mental health care visits (p = 0.153), and an increase of 1000 CHC mental health care patients (15%) with 1.9% fewer ED mental health care visits (p = 0.123). An increase of 1 annual mental health visit per patient was associated with 16% fewer ED mental health care visits (p = 0.011).
Conclusions
Results suggest that mental health provision in CHCs may reduce reliance on hospital EDs, albeit minimally. Policies that promote alignment of services between CHCs and local hospitals may accelerate this effect.
Keywords: community health centers, hospital emergency departments, mental health services
What is known on this topic
A high number of patients in the U.S. seek the hospital emergency department (ED) for mental health care.
Community health centers (CHCs) integrate mental health services with primary care in a more patient‐centered, low‐cost setting.
What this study adds
Utilization of mental health care in CHCs is associated with a small reduction in ED mental health care utilization.
1. INTRODUCTION
Mental health disorders affect nearly 1 in 5 U.S. adults and children, 1 , 2 yet the health care system fails to provide adequate access to mental health care services. 3 Consequently, many patients seek mental health care in hospital emergency departments (EDs) for lack of convenient or accessible alternatives or because they are uninsured or underinsured. 3 , 4 In the U.S., mental health visits to the ED increased 57% for pediatric patients and 41% for adult patients between 2009 and 2015, despite hospital and payer efforts to steer patients toward lower‐cost alternatives. 5
Mental health patients are disproportionately high utilizers of the EDs within their communities. 6 Many are low acuity patients who face long wait times in EDs and who would be treated more effectively in calmer, more patient‐centered environments. 7 , 8 , 9 A potentially effective channel is the growing number of community health centers (CHCs), which deliver cost‐efficient primary and behavioral health care to medically underserved populations. 10 , 11 In 2021, 1373 federally‐qualified CHCs provided services to over 30 million patients. If access to CHC mental health services is low, many patients may turn to the ED to receive mental health services at a higher cost, which could be avoided with greater CHC access.
Systematic studies of reasons why people choose emergency services found the leading theme to be lack of access to primary care. 12 , 13 CHCs often are considered a primary care alternative to the ED, yet whether they are effective in lessening mental health ED utilization is unknown. Integration of primary care and behavioral health care is viewed as an effective strategy for increasing access to behavioral health services, inclusive of mental health care while enhancing coordination with primary care. 14 , 15 As providers that increasingly are integrating behavioral health into primary care, CHCs are particularly suited to meet the needs of patients who require both services. 16 Inadequate access to mental health professionals coupled with funding and regulatory support by the federal government has spurred the growth of mental health services in CHCs in recent years. While more than 90% of CHCs provide some mental health services alongside primary care, 17 the level of mental health services varies substantially across facilities and over time. We leveraged this variation to examine the linkage between access to mental health care in CHCs and utilization of ED mental health services. We hypothesized that access to CHC mental health care is associated with fewer ED mental health care visits.
2. METHODS
2.1. Data
The sample contained all 57 federally‐qualified CHCs operating in Florida during 2012–2019, varying from 49 unique CHCs delivering care at 426 sites in 2012 to 47 unique CHCs delivering care at 629 sites in 2019. Data came from two main sources. First is the Uniform Data System (UDS), an administrative dataset collected and maintained by the Health Resources and Services Administration (HRSA). The UDS contains all federally‐qualified CHCs, where data are reported at the CHC level (i.e., data from multiple sites operated by individual CHCs are aggregated). Second is the 2012–2019 Agency for Healthcare Research and Quality (AHRQ) Healthcare Cost and Utilization Project (HCUP) State Emergency Department Databases (SEDD). The Florida SEDD contains annual administrative data on 100% of hospital ED visits that do not result in an admission.
2.2. Defining CHC service areas
To our knowledge, prior research has not developed a procedure for defining unique CHC service areas. This is not straightforward because of the large number of sites operated by each CHC. In this initial operational step, we referred to the hospital literature, where market definitions commonly rely on patient flows. A widely applied approach is the Dartmouth Institute's Health Service Areas (HSAs), which comprise 3436 geographically contiguous and mutually exclusive collections of zip codes, assigned to hospitals according to where the largest proportion of their Medicare residents were hospitalized. 18 We adapted the Dartmouth method to create service areas for CHCs by assigning each zip code to the CHC where the plurality of patients from that zip code received care for any reason at a CHC.
Over the 8‐year study period, each of the Florida CHCs served patients originating from dozens of different zip codes, at multiple sites ranging from 8.7 sites per CHC in 2012 to 13.4 sites per CHC in 2019. Notwithstanding the dispersion of delivery sites, patients originated from a concentrated set of zip codes. Most of CHC's patients were included in its service area, ranging from 85.7% of CHC's patients in 2012 to 79.3% of a CHC's patients in 2019. Except for the Miami area, service areas were largely contiguous as visualized in the map of service areas in 2019 (Supporting Information, Appendix A1). CHC service areas were also highly stable over time. Of the zip codes assigned to the 37 CHCs in 2012 that were still operating in 2019, 84.2% were included in those CHC's service areas in 2019. Moreover, the CHC service areas exhibited high overlap with ED markets. In 2019, CHCs had 83.5% of their zip codes in common with the zip codes comprising the HSAs of EDs located within their service areas.
2.3. Empirical model
We estimated regression models of ED visits for mental health using 323 CHC‐year level observations, assuming prevailing supply and demand balance. In data containing both time‐series and cross‐sectional variation, or panel data, two approaches to estimation are commonly applied, random effects (RE) and fixed effects (FE). RE estimators are more efficient than FE; however, if unobserved individual effects are correlated with observed regressors, RE produces inconsistent estimates. To choose between approaches, we took the correlated random effects (CRE) approach that parametrically models potential correlation between observed and unobserved effects. 19 , 20 Results of CRE regressions indicate the presence of correlation and can detect violation of the RE assumption. (Greater detail on the CRE application is contained in Supporting Information, Appendix A2.)
2.4. Variables
We identified mental health visits according to ICD‐9‐CM diagnosis codes for 2012 through 2015 (third quarter) and ICD‐10‐CM diagnosis codes for 2015 (fourth quarter) through 2019. The dependent variable was the number of mental health ED visits per capita to all EDs located in a CHC's service area. The population of each service area was the summation of all individual residents who resided in the included zip codes as obtained from the Census Bureau. We drew from the UDS to estimate three separate independent variables measuring CHC mental health utilization: number of mental health visits, number of unique mental health care patients, and intensity of mental health care (number of visits per patient). The UDS incorporates a broad set of mental health diagnoses, categorized as disorders related to depression, anxiety, attention deficit, and other mental health conditions, and identified according to ICD‐9 and ICD‐10 codes.
3. RESULTS
CHCs increasingly integrated mental health services into care during 2012–2019 as shown by growth in CHC measures of mental health service utilization (Figure 1). Visits for mental health diagnoses grew from 12,907 to 25,616 (198%), unique patients from 3824 to 8285 (216%), and intensity (visits/patient) from 2.22 to 2.73 (23%).
FIGURE 1.
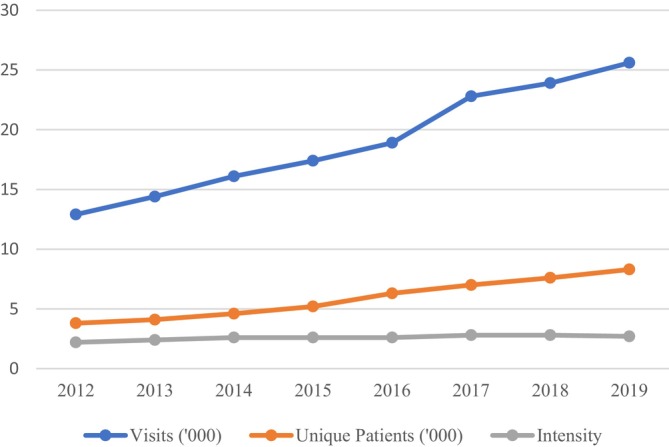
Florida Community Health Centers 2012 to 2019: visits (thousands) with mental health (MH) diagnoses grew from 12.9 to 25.6, unique patients (thousands) with MH diagnoses 3.8 to 8.3, intensity (visits/patient) 2.2 to 2.7. Source: Health Resources and Services Administration Uniform Data System Table 6A.
For statistical analysis, we selected observations following application of Cook's d‐statistic which detected three overly influential data points in preliminary panel data models. The final sample was an unbalanced panel containing 323 CHC‐year observations. Table 1 contains descriptive statistics. Over time, the population rate of mental health ED visits across CHC service areas averaged 2109 per 100,000 people, with coefficient of variation (CV) of 4.25. For Medicaid beneficiaries and uninsured individuals, who were more likely to benefit from care in CHCs, the rate was 1375 visits per 100,000 people (CV = 4.83). Mental health utilization in CHCs showed greater variation, with visits averaging 20,825 and CV equal to 2.13. Number of CHC mental health patients and of mental health visit intensity, averaged 6548 and 2.34, respectively, and varied less (CV = 1.28 and CV = 0.58).
TABLE 1.
Descriptive statistics.
| Variable | Mean | Standard deviation | Coefficient of variation | Interquartile range |
|---|---|---|---|---|
| Dependent | ||||
| ED mental health care visits (per 100,000 people) | 2,109 | 8,970 | 4.25 | 493–937 |
| ED mental health care visits (per 100,000 Medicaid beneficiaries and uninsured people) | 1,375 | 6,737 | 4.83 | 48–495 |
| Explanatory | ||||
| CHC mental health care visits | 20,825 | 44,450 | 2.13 | 2,880–17,196 |
| CHC mental health care patients | 6,548 | 8,395 | 1.28 | 1,706–8,107 |
| CHC mental health care intensity (visits/patient) | 2.34 | 1.35 | 0.58 | 1.65–2.49 |
| N = 323 observations | ||||
Note: Data comprise emergency department (ED) and community health center (CHC) mental health care utilization in Florida during 2012–2019. ED visits are from the AHRQ HCUP State Inpatient Databases. CHC visits and patients are from the HRSA Uniform Data System.
The CRE estimations detected no violation of the RE assumption in any of the six regression models. We therefore proceeded with RE as the consistent and efficient estimator. Table 2 exhibits regression results. (Full RE, FE, and CRE estimates are contained in Supporting Information, Appendix A3.) For models that measured CHC mental health utilization as number of visits for all patients, we observe a negative coefficient on visits of −9.23 (p = 0.153). The middle column exhibits estimates where CHC mental health utilization is measured as unique patients. In this case, we also observe a negative coefficient (−40.3; p = 0.123). The final column again shows a negative coefficient (−340; p = 0.011), indicating that CHC intensity of mental health care is negatively associated with ED mental health visits per capita. For estimates from models that included ED visits only for Medicaid or uninsured patients, results are as expected, negative in sign and smaller in magnitude. For utilization measured as visits, we observe a coefficient of −4.86 (p = 0.215), measured as patients of −21.6 (p = 0.171), and measured as intensity of −164 (p = 0.043).
TABLE 2.
Random effects regression estimates of mental health care ED visits per 100,000 patients.
| Variable | All ED mental health visits | Medicaid and uninsured mental health ED visits | ||||
|---|---|---|---|---|---|---|
| Visits | Patients | Intensity | Visits | Patients | Intensity | |
| Estimate | Estimate | Estimate | Estimate | Estimate | Estimate | |
| (p‐value) | (p‐value) | (p‐value) | (p‐value) | (p‐value) | (p‐value) | |
| CHC mental health visits (‘000 a ) | −9.23 | — | — | −4.87 | — | — |
| (0.153) | (0.215) | |||||
| CHC mental health patients (‘000 a ) | — | −40.3 | — | — | −21.6 | — |
| (0.123) | (0.171) | |||||
| CHC mental health intensity (visits/patient) | — | — | −340 | — | — | −164 |
| (0.011) | (0.043) | |||||
Note: Models were estimated with SAS v9.4 PROC MIXED using feasible GLS estimators; year dummies and time averages are included in all models; p‐values are for t‐tests of statistical significance.
‘000 indicates thousands.
While all measures of CHC mental health utilization had negative associations with ED mental health visits, the coefficients in themselves are not particularly meaningful. For greater clarification, we compute magnitudes of changes in ED visits associated with hypothetical and easily interpretable increases in utilization. The coefficient on mental health visits for example, which is measured in thousands, indicates that each additional 1000 CHC visits, or 5% of the mean value across observations (Table 1), is associated with 9.23 fewer ED mental health visits per 100,000 people in a CHCs service area, or 0.44% of the mean value. Similarly, each additional 1000 unique mental health care patients, or 15% of the mean value, is associated with 40.3 fewer ED mental health visits per 100,000 population, or 1.9% of the mean. The most notable effect is observed in intensity of mental health visits per patient. An increase of one visit per patient (43% of the mean value) is associated with 340 fewer ED mental health visits, or 16% of ED mental health utilization per 100,000 patients. The same hypothetical increases in utilization in visits, patients, and intensity are associated with 0.35%, 1.6%, and 11.9% decreases, respectively, in ED visits by Medicaid and uninsured patients. A caveat is that for visits and patients, the coefficients did not achieve statistical significance. A larger sample size may be required to provide greater confidence in those results. Moreover, although the magnitudes are relatively small, they represent a lower bound on ED visits as the HCUP SEDD databases match only about 80% of acute care hospitals. 21
While between 79.3% and 85.7% of CHC patients were included in the service areas we created, these reflect averages and a few CHCs had low capture rates in some years. To address the possibility that this could significantly affect results, we conducted a sensitivity analysis excluding observations for which the service area captured less than 20% of all patients treated by the CHC in a particular year (14 of 323 observations). The difference in results was negligible (see Supporting Information, Appendix A4).
4. DISCUSSION
This study builds on previous research—showing an important reason patients use the ED to be lack of access to primary care—in two ways. First, we focused specifically on mental health services. Second, we linked ED utilization with services provided in settings that often integrate primary and mental health care. With newly identified CHC service areas, results showed a negative association between CHC mental health utilization and ED mental health visits per capita. While supporting our hypotheses, results were modest and not all results were statistically significant, suggesting need for further study using larger sample sizes.
While increasing CHC mental health visits was associated with a reduction in mental health ED visits, the magnitudes of these findings were small. This suggests that increasing CHC mental health visits alone is unlikely to make a meaningful change in mental health ED visits. This raises the question of how CHCs and EDs might better align services for patients with mental health care needs. A better understanding of where care coordination for these patients has been successful and of what strategies have been effective is needed. For instance, some CHCs are part of integrated health systems or value‐based payment models in which EDs and CHCs may share an EHR or have mechanisms for care coordination; this may help divert ED patients to CHCs for mental health needs that are better treated in primary care settings.
The Community Health Center Fund (CHCF), established under the Affordable Care Act (ACA), invested billions of federal dollars into CHCs to expand CHC service capacity, including mental health services. CHC mental health service capacity expansion may still be insufficient for meeting the growing mental health needs within the population, which have escalated as a result of the COVID‐19 pandemic. 22 , 23 Increased or sustained federal funding to support behavioral health integration and service capacity at CHCs is likely necessary, yet CHCs continue to face financial risk. The CHCF has been extended several times, but only after delays and partisan congressional debate. Successful execution of new initiatives to support mental health services at CHCs will depend partly on future longer‐term funding by Congress, which will reduce uncertainty with which CHC administrators have periodically struggled.
Our study has limitations. First, we were unable to include number of CHC mental health providers, which is not publicly available in the UDS. Relatedly, our measures of utilization were based on diagnoses, not services, and so are proxies for mental health integration into primary care. Second, results may not generalize nationally, particularly to ACA Medicaid expansion states. Notwithstanding this limitation, our single‐state study allowed the capture of ED utilization at all hospitals in the state and under any payer. Third, results represent associations, not causal effects, although the panel methods we applied largely mitigate potential bias from correlation between observed and unobserved effects.
Lack of access to mental health care is an ongoing problem, and the ED is the one health care delivery setting required by law to accept patients. Our study indicates that increasing mental health services in the community for safety net populations may reduce ED use, which may be because individuals have greater access to preventive and coordinated mental health care. The unprecedented pressure on hospital capacity coupled with heightened stress on mental health brought on by the pandemic only intensifies the importance of improving access to mental health services. Further study on the role of CHCs in reducing reliance on the ED for mental health services is needed as behavioral health integration in CHCs continues to grow.
CONFLICT OF INTEREST STATEMENT
The authors declare no conflicts of interest.
Supporting information
Data S1. Supporting Information.
ACKNOWLEDGMENTS
This work was funded by the Agency for Healthcare Research and Quality #R03‐HS28054‐01A1.
Carey K, Cole MB. Mental health care provision in community health centers and hospital emergency department utilization. Health Serv Res. 2024;59(2):e14283. doi: 10.1111/1475-6773.14283
REFERENCES
- 1. National Institute of Mental Health . Mental Illness. https://www.nimh.nih.gov/health/statistics/mental-illness
- 2. Centers for Disease Control and Prevention . Improving Access to Children's Mental Health Care. https://www.cdc.gov/childrensmentalhealth/access.html
- 3. Bishop TF, Press MJ, Keyhani S, Pincus HA. Acceptance of insurance by psychiatrists and the implications for access to mental health care. JAMA Psychiatry. 2014;71(2):176‐181. [DOI] [PMC free article] [PubMed] [Google Scholar]
- 4. Shah H. Rise in Emergency Department Visits due to Limited Access to Behavioral Health Services. Institute for Health Policy Leadership, Loma Linda University Health. January 3, 2022. [Google Scholar]
- 5. Santillanes G, Axeen S, Lam CN, Menchine M. National trends in mental health‐related emergency department visits by children and adults, 2009‐2015. Am J Emerg Med. 2020;38(12):2536‐2544. [DOI] [PubMed] [Google Scholar]
- 6. Niedzwiecki MJ, Sharma PJ, Kanzaria HK, McConville S, Hsia RY. Factors associated with emergency department use by patients with and without mental health diagnoses. JAMA Netw Open. 2018;1(6):e183528. [DOI] [PMC free article] [PubMed] [Google Scholar]
- 7. Roennfeldt H, Wyder M, Byrne L, Hill N, Randall R, Hamilton B. Subjective experiences of mental health crisis care in emergency departments: a narrative review of the qualitative literature. Int J Environ Res Public Health. 2021;18(8):9650. [DOI] [PMC free article] [PubMed] [Google Scholar]
- 8. Navas C, Wells L, Bartels SA, Walker M. Patient and provider perspectives on emergency department care experiences among people with mental health concerns. Healthcare. 2022;10(7):1297. [DOI] [PMC free article] [PubMed] [Google Scholar]
- 9. Laderman M, Dasgupta A, Henderson R, Waghray A. Tackling the mental health crisis in emergency departments: look upstream for solutions. Health Affairs Forefront. January 26, 2018.
- 10. Laiteerapong N, Kirby J, Gao Y, et al. Health care utilization and receipt of preventive care for patients seen at federally funded health centers compared to other sites of primary care. Health Serv Res. 2014;49(5):1498‐1518. [DOI] [PMC free article] [PubMed] [Google Scholar]
- 11. Nocon RS, Lee SM, Sharma R, et al. Health care use and spending for Medicaid enrollees in federally qualified health centers versus other primary care settings. Am J Public Health. 2016;106(11):1981‐1989. [DOI] [PMC free article] [PubMed] [Google Scholar]
- 12. Coster JE, Turner JK, Bradbury D, Cantrell A. Why do people choose emergency and urgent care services? A rapid review utilizing a systematic literature search and narrative synthesis. Acad Emerg Med. 2017;24(9):1137‐1149. [DOI] [PMC free article] [PubMed] [Google Scholar]
- 13. Vogel JA, Rising KL, Jones J, Bowden ML, Ginde AA, Havranek EP. Reasons people choose the emergency department over primary care: a qualitative synthesis. J Gen Intern Med. 2019;34(11):2610‐2619. [DOI] [PMC free article] [PubMed] [Google Scholar]
- 14. American Psychological Association . Behavioral Health Integration Fact Sheet. https://www.apa.org/health/behavioral-integration-fact-sheet
- 15. Leung LB, Yoon J, Escarce JJ, et al. Primary care‐mental health integration in the VA: shifting mental health services for common mental illnesses to primary care. Psychiatr Serv. 2018;69(4):403‐409. [DOI] [PubMed] [Google Scholar]
- 16. Health Services & Resources Administration Health Center Program . Behavioral Health and Primary Care Integration. https://bphc.hrsa.gov/technical-assistance/clinical-quality-improvement/behavioral-health-primary-care-integration
- 17. Kaiser Family Foundation . Community Health Centers: Growing Importance in a Changing Health Care System ‐ Issue Brief. https://www.kff.org/report-section/community-health-centers-growing-importance-in-a-changing-health-care-system-issue-brief/
- 18. Dartmouth Atlas Project . Research Methods. https://www.dartmouthatlas.org/research-methods/
- 19. Mundlak Y. On the pooling of time series and cross section data. Econometrica. 1978;46(1):69‐85. [Google Scholar]
- 20. Wooldridge JM. Correlated random effects models with unbalanced panels. J Econometrics. 2019;211(1):137‐150. [Google Scholar]
- 21. Agency for Healthcare Research and Quality . HCUP Hospital Identifiers. https://www.hcup-us.ahrq.gov/db/maphosp.jsp
- 22. Holland KM, Jones C, Vivolo‐Kantor AM, et al. Trends in US emergency department visits for mental health, overdose, and violence outcomes before and during the COVID‐19 pandemic. JAMA Psychiatry. 2021;78(4):372‐379. [DOI] [PMC free article] [PubMed] [Google Scholar]
- 23. Stroever S, Brett C, Michael K, Petrini J. Emergency department utilization for mental health conditions before and after the COVID‐19 outbreak. Am J Emerg Med. 2021;47:164‐168. [DOI] [PMC free article] [PubMed] [Google Scholar]
Associated Data
This section collects any data citations, data availability statements, or supplementary materials included in this article.
Supplementary Materials
Data S1. Supporting Information.