

Abstract
Objective
To evaluate the effect of rural hospital closures on infant and maternal health outcomes.
Data Sources and Study Setting
We used restricted National Vital Statistics System birth and linked birth and infant death data, merged with county‐level hospital closures from the Sheps Center for the period 2005–2019.
Study Design
We used difference‐in‐difference and event study methods, employing new estimators that account for staggered treatment timing. Our key outcome variables were prenatal care initiation; birth outcomes (<2500 g; <1500 g; <37 weeks; <28 weeks; 5‐min Apgar); delivery outcomes (cesarean, induction, hospital birth); and infant death (<1 year of birth; <=30 days of birth; <=7 days of birth; <= 1 day after birth).
Data Collection/Extraction Methods
The analysis covered all births in the United States in rural counties (by rurality: all, most, moderately rural).
Principal Findings
We found evidence that fewer individuals delivered in their county of residence after a hospital closure, and this was most pronounced for residents of the most rural counties (29%–52% decline (p < 0.01) in the likelihood of delivering in their residence county). We found that hospital closures worsen prenatal, infant, and delivery outcomes for residents of moderately rural counties but improve those outcomes for those in the most rural counties. In moderately rural counties, low birth weight births increased by 10.4% (p < 0.01). We found suggestive evidence of decreased infant deaths in the most rural counties. This pattern of findings is consistent with closures leading residents of the most rural counties to seek care in a different county and residents of moderately rural counties to seek care at a different hospital in the same county.
Conclusions
Loss of hospital care has meaningful effects on the rural populations; investigating rural counties in aggregate may miss nuanced differences in the effects on the margin of rurality.
Keywords: health economics, hospitals, maternal and perinatal care and outcomes, obstetrics and gynecology, rural health
What is known on this topic
Disparities exist between urban and rural populations in both health care access and outcomes, especially for pregnant populations accessing prenatal care and labor/delivery services.
While research has investigated closures of hospital‐based obstetric (OB) services, less is known about the loss of hospital services per se and the degree of rurality.
What this study adds
Hospital closures in rural counties have important implications for maternal and infant health, and these consequences are different for residents of moderately rural and most rural counties.
Hospital closures appear to worsen maternal and infant outcomes for residents of moderately rural counties, but may improve them for individuals in the most rural counties.
Aggregate investigations of rural counties may miss some of the nuanced differences in the hospital closures' effects on the margin of rurality.
1. INTRODUCTION
The United States experiences significant disparities in both health care access and health outcomes between urban and rural populations. Twenty percent of Americans live in rural areas, which are often “maternity care deserts,” or areas without a hospital offering obstetric (OB) care. 1 , 2 Medicaid financed 43% of all births, but paid for 50%–60% of rural births in 2017, due to higher rates of Medicaid coverage in rural areas. 3 Pregnant individuals living in rural areas experience reduced access to health care services, which could negatively impact perinatal and maternal health outcomes (e.g., late prenatal care, prematurity, low birth weight, maternal mortality, and severe maternal morbidity). 4 , 5
Since 2010, approximately 136 rural hospitals have closed, and hundreds more are in danger of closing. 6 The pace of hospital closures has accelerated since 2014, and the COVID‐19 crisis shed new light on the fragility of rural hospital systems. Moreover, the Supreme Court's Dobbs decision may contribute to physician shortages in labor and delivery units in rural communities given changes in the state political climate surrounding abortion. 7 Rural hospitals may close because of demographic changes and rural population loss, bypassing of rural hospitals, referral patterns to larger hospitals, state and federal policy regarding Medicaid (e.g., Medicaid expansion) and Medicare payment policies, shifts in health care technology from inpatient hospital to outpatient and ambulatory care, and mismanagement. 6
Closures of rural hospitals that serve pregnant and birthing individuals may have profound health impacts due to loss of access to medical care, which may include both emergency and primary care, including loss of prenatal and postnatal care and services. Moreover, hospital closures are associated with increased driving times and/or travel distances to reach health care (e.g., health care that meets your needs), which was already higher for rural versus urban populations. 8 Consequently, loss of nearby medical care may exacerbate existing urban/rural disparities in health outcomes. Conversely, quality of care could increase following the closure of a rural hospital if the next nearest option offers higher quality care. The literature has found that hospital closures and increased distance may reduce preventive care for children (particularly racial minorities), 9 increase response times for emergency medical services, 10 and increase mortality from emergency health conditions (e.g., heart attack). 11 In particular, hospital closures were associated with no effect on mortality overall, but increased mortality for rural closures relative to urban closures. 12
A growing literature has examined the loss of obstetric services—not full hospital closures—in rural settings on perinatal health care services including prenatal care, birth, and postpartum care. The expense of labor and delivery units often results in OB unit closures of financially distressed hospitals. OB unit closures often occur in hospitals that are relatively small, private, and with less access to physician care. 13 For hospitals looking to cut costs, OB unit closures may precede a full hospital closure, 14 yet studies of OB closures focus on the first shock (OB unit closures) alone. Furthermore, even when an OB unit closes, the hospital may continue to offer other perinatal services. 15 Existing studies of all rural OB unit closures have found little impact on maternal or infant health, but have identified reductions in cesarean sections, likely due to a shift to giving birth in hospitals with stricter cesarean policies, and increases out‐of‐hospital births. 16 , 17 , 18 These effects may not be uniform across all mothers; rural OB unit closures may negatively impact infant health for Black mothers. 19 These studies analyze all rural OB unit closures. When rural OB units nonadjacent to urban counties were analyzed, infant health worsened (e.g., preterm birth). 18
We contribute to the literature in two important ways: First, the literature has focused on approximating OB unit closures when studying perinatal outcomes; our focus is on a full rural hospital closure. Hospital closure is an important shock to consider; it represents the full loss of hospital services in a geographic area (including emergency care services) and it is a relatively clean treatment (i.e., not representing a general decline in services (obstetrics) or loss of some services (obstetrics) but not others (other perinatal services)). Second, the degree of rurality of the county in which the hospital closure occurred is a margin that has received less attention in the literature.
In this study, we use data on rural hospital closures to identify potential effects on access to care prior to birth, location of birth, and maternal and infant health at and after birth. We combine restricted National Vital Statistics System (NVSS) birth data with county‐level hospital closures for the period 2005–2019. We also use linked birth and infant death data to identify infant deaths during the first year of life. We employ difference‐in‐difference (DiD) and event study (ES) methods that address staggered treatment timing. 20 We focus on rural county hospital closures and limit our sample to rural counties. Next, as we focus on counties that lose hospital care and potentially OB services simultaneously, we limit our sample to counties that did not appear to lose OB services prior to the full hospital closure. To focus on the rural counties that experienced a closure of their likely only source of hospital care, we further limit our sample to counties that lose a Critical Access Hospital (CAH) or Sole Community Hospital (SCH).
2. METHODS
2.1. Data
2.1.1. Hospital closures
We obtained data identifying rural hospital closures between 2005 and 2020 from the Cecil G. Sheps Center for Health Services Research at the University of North Carolina—Chapel Hill. These data are available at the hospital level and identify the location of the hospital, enabling us to assign county rurality where the hospital is located using the rural–urban continuum codes (RUC) from US Department of Agriculture, 21 codes that have been used in the literature. 13 , 17 We exclude urban counties (RUC codes 1–3) and focus on rural counties (RUC codes 4–9). We split all rural counties into two groups: moderately rural (RUC codes 4–7) and most rural (RUC codes 8 and 9). The Sheps Center also identifies whether the hospital that closed had a SCH or CAH designation, which we use to further specify our sample.
2.1.2. National vital statistics system birth data
We obtained restricted NVSS Birth Data with county identifiers for the universe of births in the United States between 2005 and 2019. 22 We use the term mothers throughout our discussion to align with terminology used in the birth data and literature at this time. We acknowledge, however, that births occur to individuals of all genders. The restricted data permit the identification of residence county as well as birth county. We constructed a variable indicating whether the mother gave birth in her county of residence and merged the hospital closure data based on county of residence. We assumed that the county of residence at birth and during pregnancy were the same. We began with the universe of births between 2005 and 2019 (N = 60,372,619) and were able to merge 98.7% with a county RUC code (N = 59,567,574). After limiting our sample to counties with RUC codes 4–9, we are left with N = 9,098,186 births.
Our pre‐birth variables include the month prenatal care began and whether the mother initiated prenatal care after her first trimester (i.e., late). Our at‐birth infant health outcomes consist of 5‐min Apgar score (1–10, with higher scores indicating better newborn health) and indicators for whether the birth is classified as low birth weight (<2500 g), very low birth weight (<1500 g), preterm (gestational age <37 completed weeks), and extremely preterm (gestational age <28 completed weeks). We also constructed indicators for whether a birth was delivered by cesarean, induced, and delivered at a hospital. Last, we create demographic variables including mother's age at birth, race, ethnicity, and marital status. Our regressions include the sample that has data for these demographic variables (N = 9,023,552).
While other at‐birth health variables are available (e.g., maternal gestational diabetes, maternal gestational hypertension, infant required ventilation, and infant NICU admission), we did not use these due to data quality concerns. Prior work has found that birth data, relative to medical claims or hospital discharge data, do not accurately capture certain maternal and infant conditions and procedures, including measures like gestational diabetes, NICU admission, blood transfusion, and severe maternal morbidities. 23 , 24 Importantly, the extent of the underreporting may differ by maternal characteristics (maternal education, race/ethnicity, and insurance payer), which may further differ by county rurality. 25 We also acknowledge that some of the self‐reported information (e.g., prenatal care) may also be subject to recall bias. 26
2.1.3. National vital statistics system linked birth and infant death data
We obtained restricted NVSS Linked Birth and Infant Death Data on all infant deaths in the United States between 2005 and 2018 (corresponding to births between 2005 and 2017). The data link a birth cohort (e.g., births in 2005) to deaths that occur within 1 year of birth (an infant who is born in 2005 and dies within 1 year of their birth could die in either 2005 or 2006). This sample is smaller than the birth sample, because it includes two fewer cohorts (those born in 2018 and 2019). The restricted data permit the identification of county of residence and birth. We constructed indicators for infant death: infant death <1 year of birth (i.e., infant mortality), <=30 days of birth, <=7 days of birth, and <= 1 day after birth.
2.1.4. Hospital rurality and hospital closure status
We use RUC codes to limit our sample to rural counties (N = 2,049 counties), and subsequently to split the sample into moderately rural (N = 1376 counties) and most rural counties (N = 673 counties). Next, we limit our sample to counties that did not appear to lose OB services prior to the full hospital closure (full: N = 1886; moderate: N = 1256; most: N = 630 counties). We do this to cleanly estimate the effect of a rural hospital closure. Counties are coded as having experienced a loss of OB services in year t if the average number of births occurring in the county was more than 15 in years t−3, t−2, and t−1 and <5 in the years t, t+1, and t+2 (consistent with the approach in Battaglia, 2021). 16 To focus on the rural counties that experienced a closure of their likely only source of hospital care, we further limit our sample to counties that lose a CAH or SCH (full: N = 1824; moderate: N = 1204; most: N = 620 counties). This latter sample is used in our preferred models. For this sample, there are 53 counties that experience a closure during our time period, with 36 in moderately rural and 17 in most rural counties.
This study was reviewed by the UNC‐Charlotte IRB and determined to not require IRB approval.
2.2. Empirical approach
We estimate the effect of hospital closures on maternal and infant health across rural counties using a staggered difference‐in‐difference (DiD) approach. Given the staggered nature of hospital closures (at different times over the period), and the recent literature showing that heterogenous effects can lead to biased results, we implemented models adapted to staggered treatment timing, rather than a classic two‐way fixed‐effects model (TWFE). Classic TWFE models inherently use all possible comparisons: (1) treated counties relative to never‐treated counties; (2) early treated counties relative to not‐yet‐treated counties; (3) late treated counties relative to already‐treated counties. Even if the typical TWFE assumptions are satisfied, the third type of comparisons (already (early) treated versus newly (late) treated unit) can cause the DiD estimate to be biased. Without assuming homogeneous effects, the comparison does not correctly uncover the treatment effect. In many settings, including this one, the assumption of homogenous effects is unlikely to be true. For that reason, our primary estimates are average treatment on the treated effects (ATT) obtained using Callaway and Sant'Anna (2021). 20 This estimator avoids the bias caused by heterogeneous effects by computing each of the unbiased DiD estimates (a simple DiD estimate for every possible comparison between the set of counties treated in a single year and the set of never‐treated or not‐yet‐treated counties) and then calculating a weighted average of these estimates. Each DiD estimate is of the form:
In this model, is an outcome for individual i living in county c in year y. equals 1 for the closure county(ies) in this comparison. For example, if we examine all counties that experienced a closure in 2009, equals 1 for counties with a closure in 2009 and 0 for counties that either never experience a closure during the study (never treated) or experience a closure after 2009 (not‐yet treated). Importantly, any county that has already experienced a closure is excluded from this comparison. equals 1 for the time period after the closure (2009 and later in this example) and 0 before. In practice, the effect in each “after” year is estimated in a separate DiD regression. The coefficient of interest is , which gives the effect of the closure relative to the counterfactual trend for counties that have not (yet) experienced a closure. This procedure is repeated for each closure year, and then the s for each closure year are aggregated to compute the final weighted estimate. is a vector of controls for maternal demographic information, which includes mother's age, and indicators for whether the mother reports her race as Black, her ethnicity as Hispanic, and that she is married.
We limit the years included to be no greater than 7 years before and after the closure. Our baseline regression contains all rural counties (N = 8,764,592), and then we estimate separately by moderately (N = 7,932,830) and most rural samples (N = 831,762), and with sample restrictions described above for removing OB closures (full sample N = 8,253,268) and limiting to SCH/CAH hospital closures (full sample N = 7,898,870). We present two versions of standard errors: (1) using the wild bootstrap (brackets) and (2) using wild bootstrap and clustering at the level of the county of residence (parentheses), as we recognize that there is considerable debate in the level of appropriate clustering, and that in many empirical analysis, clustered standard errors may be overly conservative. 27
Similar to a traditional ES used to support common trends in the pretreatment period, we use the Callaway and Sant'Anna (2021) 20 estimates to construct ES plots accounting for the dynamic nature of hospital closure. We use the same 14‐year window around the hospital closure year where the pre‐period coefficients are relative to t = −7 and the post‐period coefficients are relative to the year immediately preceding the hospital closure. We employ the same outcome variables and demographic controls as in our staggered DiD model. We assume that outcomes in counties where hospitals closed would have trended similarly after the closure period as those in nonclosure counties had the closure not occurred. While we cannot directly observe this counterfactual, we examine our ES estimates to assess whether this assumption is supported for the periods before the observed closure.
2.2.1. Predictions
The predicted effect of a hospital closure on health outcomes at birth (e.g., cesarean, birth weight) is ambiguous. First, if the hospital that closes provides similar care to an alternative neighbor hospital, then, all other things equal, we expect the added distance to worsen health outcomes due to delays in care. Increased travel time to a hospital might increase emergency cesarean, worsen infant health at birth, and increase infant mortality owing to life‐threatening, time‐sensitive medical conditions. Second, if the hospital that closes provides relatively low‐quality care, then outcomes may improve if the benefit of better care received at the alternative hospital outweighs the additional travel cost. For example, if there is overtreatment prior to the closure, closing a nearby hospital might lead to a reduction in more medically intensive birth practices, such as cesareans. Finally, hospital closures could lead to congestion at remaining hospitals, which could delay care and worsen outcomes.
3. RESULTS
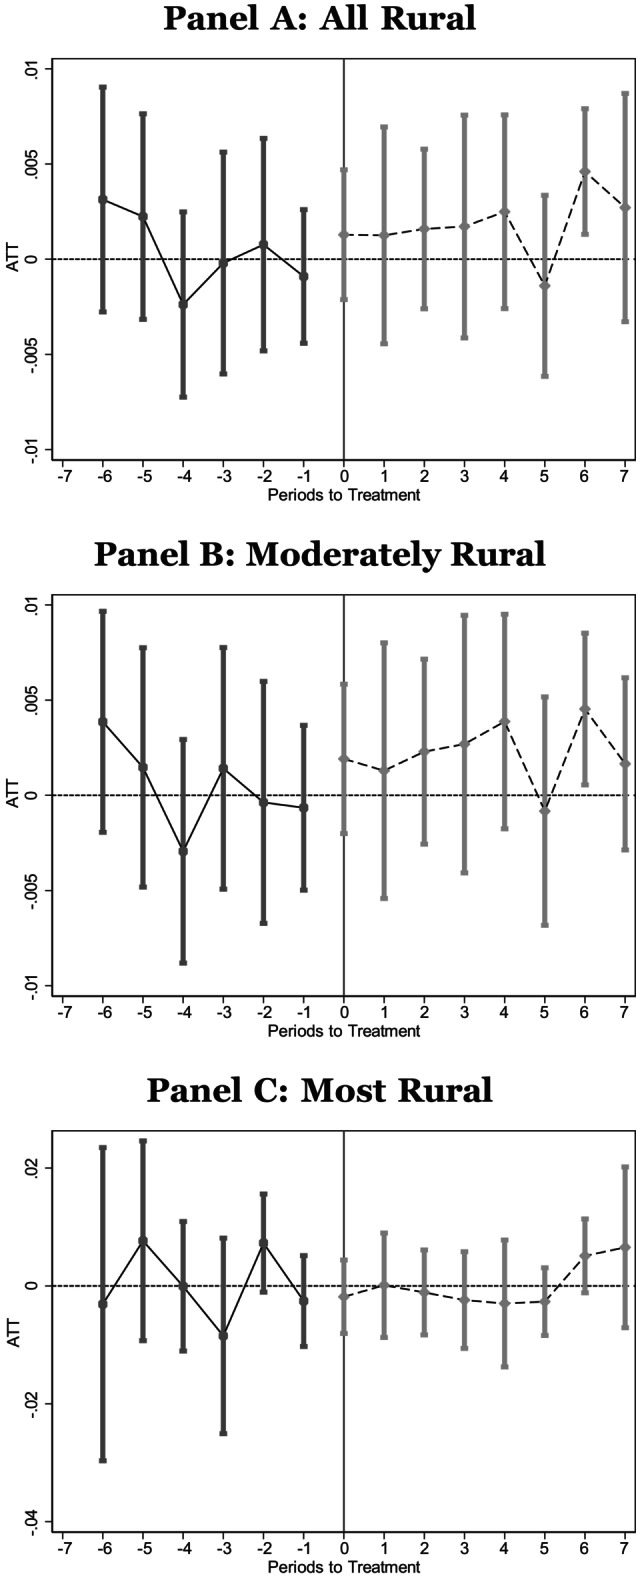
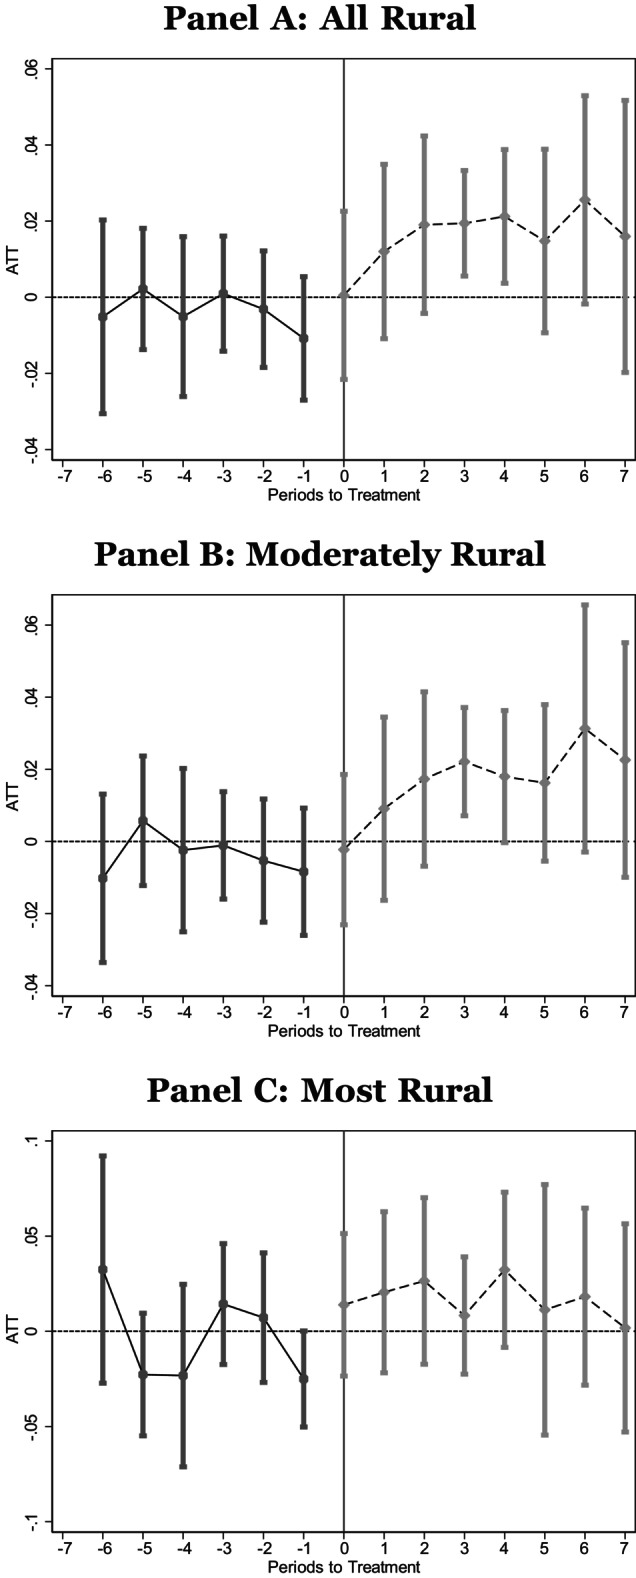
First, we explored whether the likelihood that a mother gives birth in her county of residence (same county) after a hospital closure in her county of residence is different from mothers whose county did not experience a hospital closure. Table 1 reports the ATT estimates (that is, the weighted aggregate of the ) that account for dynamic treatment effects, and Figure A1 plots the accompanying ES figures. In both the table and the figure, Column 1 includes all rural counties (full sample), Column 2 limits the sample to counties without a prior OB unit closure, and Column 3 further limits the sample to counties that experienced CAH and SCH closures only. Panel A (first row) includes all rural counties, Panel B (second row) is limited to moderately rural counties, and Panel C (third row) is limited to the most rural counties. For each regression, the sample size (N) and the sample mean (Mean) are listed below the estimate. All ATT estimates indicate a hospital closure leads to increased likelihood of giving birth outside of one's county of residence. The results for most rural counties are the largest in terms of magnitude. Relative to the sample mean, births in the same county declined between 29% (Column 1) and 52% (Column 3) for the most rural sample but <2% for the other samples, although the statistical significance of these results depends on how standard errors are estimated. Looking at the figures, there is some evidence of pretrends in moderately rural counties, leading up the closure in Columns 1 and 2, but those trends are less pronounced in Column 3 and for the most rural sample in all three columns. This buttresses our choice to focus on the more restricted sample of CAH and SCH closures (Column 3).
TABLE 1.
Birth county same as county of residence.
| All rural counties (1) | Rural counties without an OB closure (2) | Rural counties with CAH or SCH closure but no OB closure (3) | |
|---|---|---|---|
| Panel A: full sample | |||
| ATT | −0.0032 | −0.0091 | −0.0112 |
| [0.0027] | [0.0027]*** | [0.0044]*** | |
| (0.0088) | (0.0103) | (0.0115) | |
| N | 8,764,592 | 8,253,268 | 7,898,870 |
| Mean | 0.495 | 0.518 | 0.516 |
| Panel B: moderately rural | |||
| ATT | −0.0001 | −0.0058 | −0.0035 |
| [0.0025] | [0.0025]** | [0.0049] | |
| (0.0097) | (0.0105) | (0.0092) | |
| N | 7,932,830 | 7,483,683 | 7,145,272 |
| Mean | 0.536 | 0.561 | 0.561 |
| Panel C: most rural | |||
| ATT | −0.0283 | −0.0342 | −0.0495 |
| [0.0070]*** | [0.0071]*** | [0.0075]*** | |
| (0.0309) | (0.0281) | (0.0406) | |
| N | 831,762 | 769,585 | 753,598 |
| Mean | 0.096 | 0.095 | 0.096 |
Note: National Vital Statistics System Birth Data, 2005–2019. We use vital statistics birth records to estimate the relationship between a hospital closure and the likelihood that an individual gives birth in her county of residence. We estimate average treatment on the treated using csdid. Panel A contains estimates using all rural counties while Panels B and C contain estimates using only moderately rural or most rural counties, respectively. The sample for Column (1) represents all counties classified as rural; the sample for Column (2) represents rural counties that did not appear to experience a closure of their obstetric unit leading up to the hospital closure; the sample for Column (3) further restricts the sample to those that experienced a closure of a Critical Access Hospital or Sole Community Hospital and did not appear to lose obstetric services in the years leading up to the closure. Wildbootstrapped standard errors are in square brackets and standard errors in parentheses are also clustered by the county of residence.
p < 0.10;
p < 0.05;
p < 0.01.
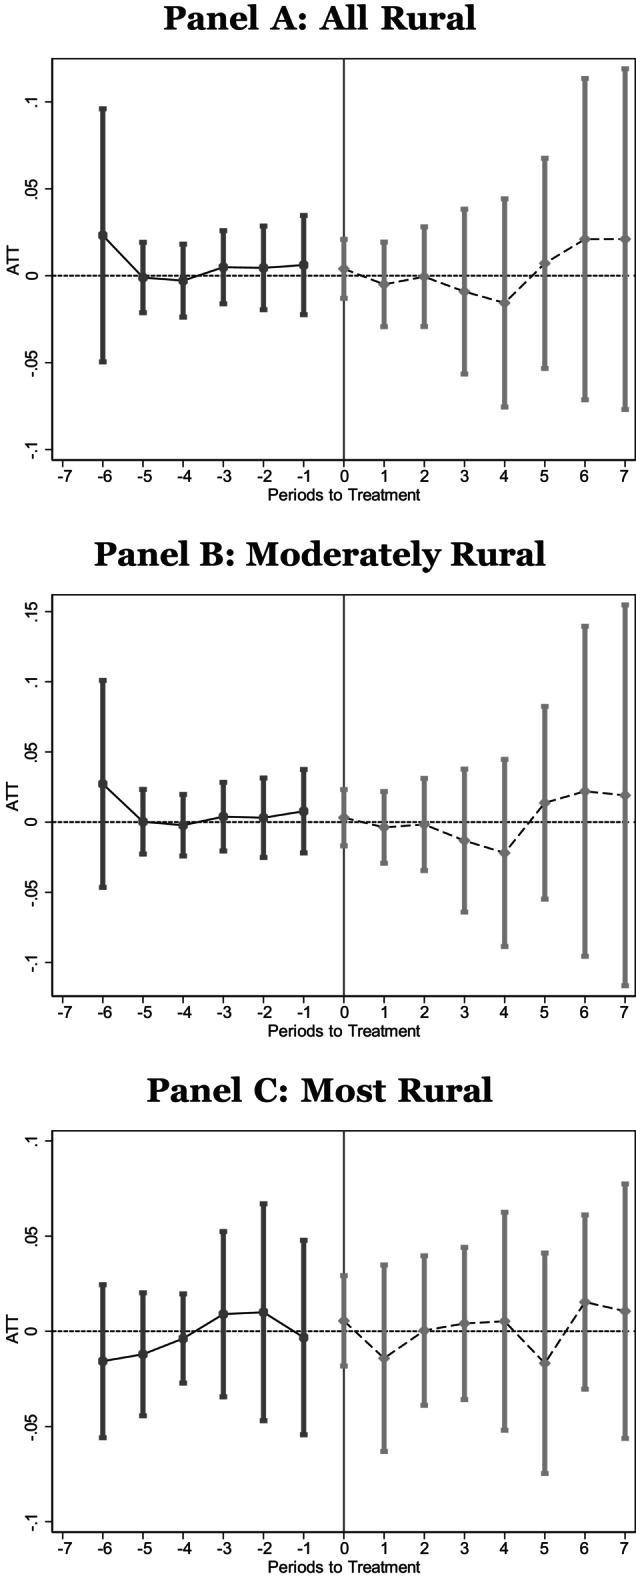
Next, we explore whether prenatal care initiation differs after a closure. Figure A2 (month prenatal care began) and Figure A3 (whether prenatal care was late, i.e., initiated after the first trimester) plot the ES estimates and Table 2 reports the ATT estimates. For all and moderately rural counties, we find suggestive evidence that the timing of prenatal care does not vary prior to the closure, but following a closure, prenatal care is initiated later. For most rural counties, however, there is little evidence of a change in the timing of prenatal care following a closure (although the confidence intervals are wide in the period immediately preceding the closure). In moderately rural counties, a birth was 9.5% more likely to initiate prenatal care late, relative to the sample mean.
TABLE 2.
Prenatal care initiation.
| Month prenatal care initiated (1) | Did not receive prenatal care in first trimester (2) | |
|---|---|---|
| Panel A: full sample | ||
| ATT | 0.0835 | 0.0205 |
| [0.0165]*** | [0.0043]*** | |
| (0.0538) | (0.0131) | |
| N | 7,107,286 | 7,200,618 |
| Mean | 3.071 | 0.257 |
| Panel B: moderately rural | ||
| ATT | 0.0820 | 0.0243 |
| [0.0197]*** | [0.0051]*** | |
| (0.0595) | (0.0154) | |
| N | 6,441,983 | 6,527,486 |
| Mean | 3.070 | 0.257 |
| Panel C: most rural | ||
| ATT | −0.0135 | −0.0001 |
| [0.0444] | [0.0128] | |
| (0.0809) | (0.0102) | |
| N | 662,072 | 669,885 |
| Mean | 3.080 | 0.258 |
Note: National Vital Statistics System Birth Data, 2005–2019. We use vital statistics birth records to estimate the relationship between a hospital closure and initiation of prenatal care. We estimate average treatment on the treated using csdid. Panel A contains estimates using all rural counties while Panels B and C contain estimates using only moderately rural or most rural counties, respectively. Similar to Column (3) of Table 1, the sample is restricted to counties that experienced a closure of a Critical Access Hospital or Sole Community Hospital and did not appear to lose obstetric services in the years leading up to the closure. Column 1 reports estimates for the month of pregnancy the individual reported prenatal care was initiated and is conditional on receiving prenatal care, while Column 2 reports estimates for an indicator for whether the mother reported prenatal care initiation in the first trimester. Wildbootstrapped standard errors are in square brackets and standard errors in parentheses are also clustered by the county of residence.
p < 0.10;
p < 0.05;
p < 0.01.
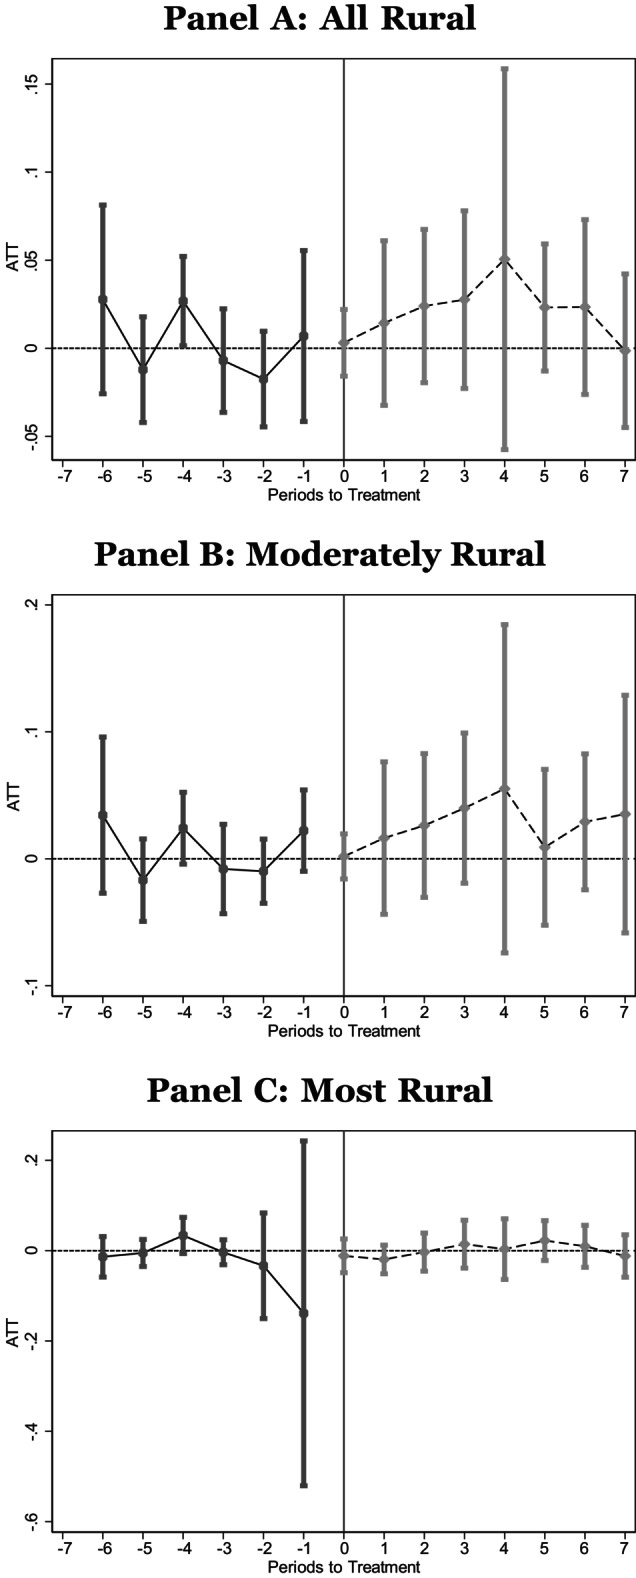
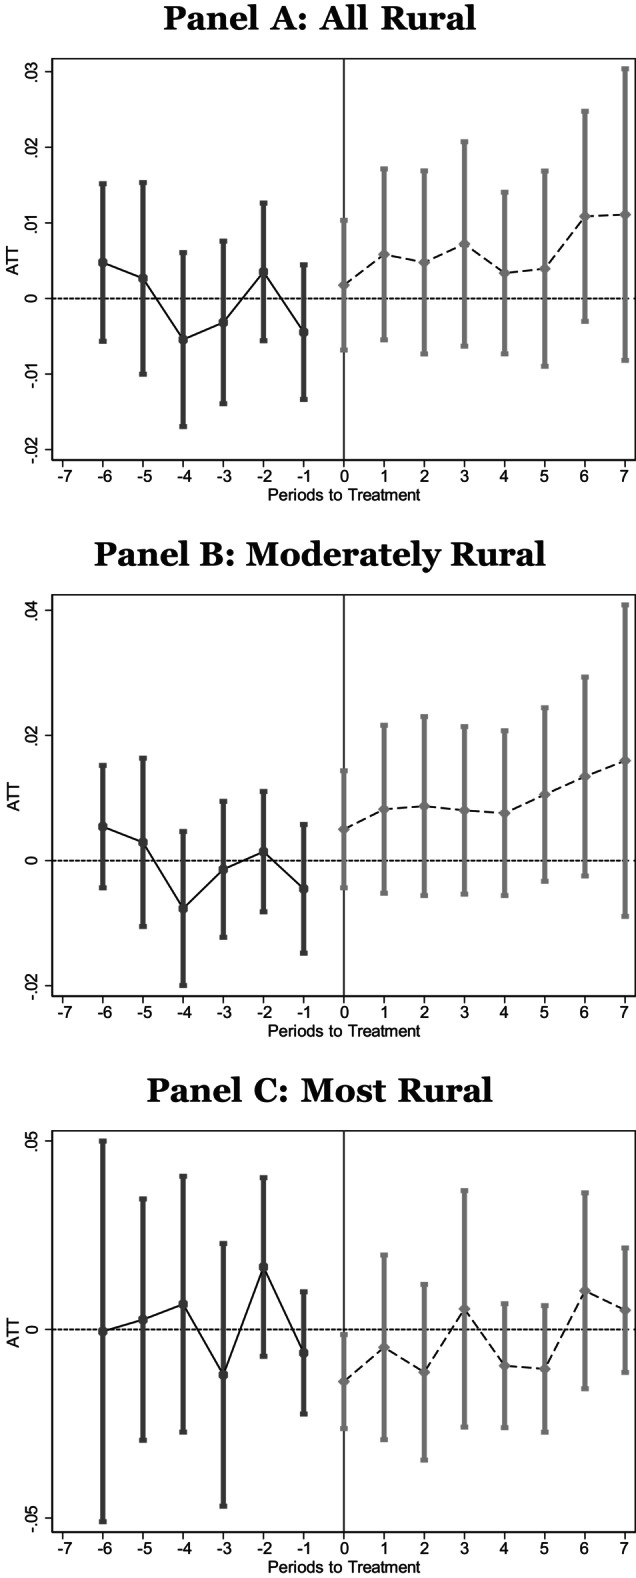
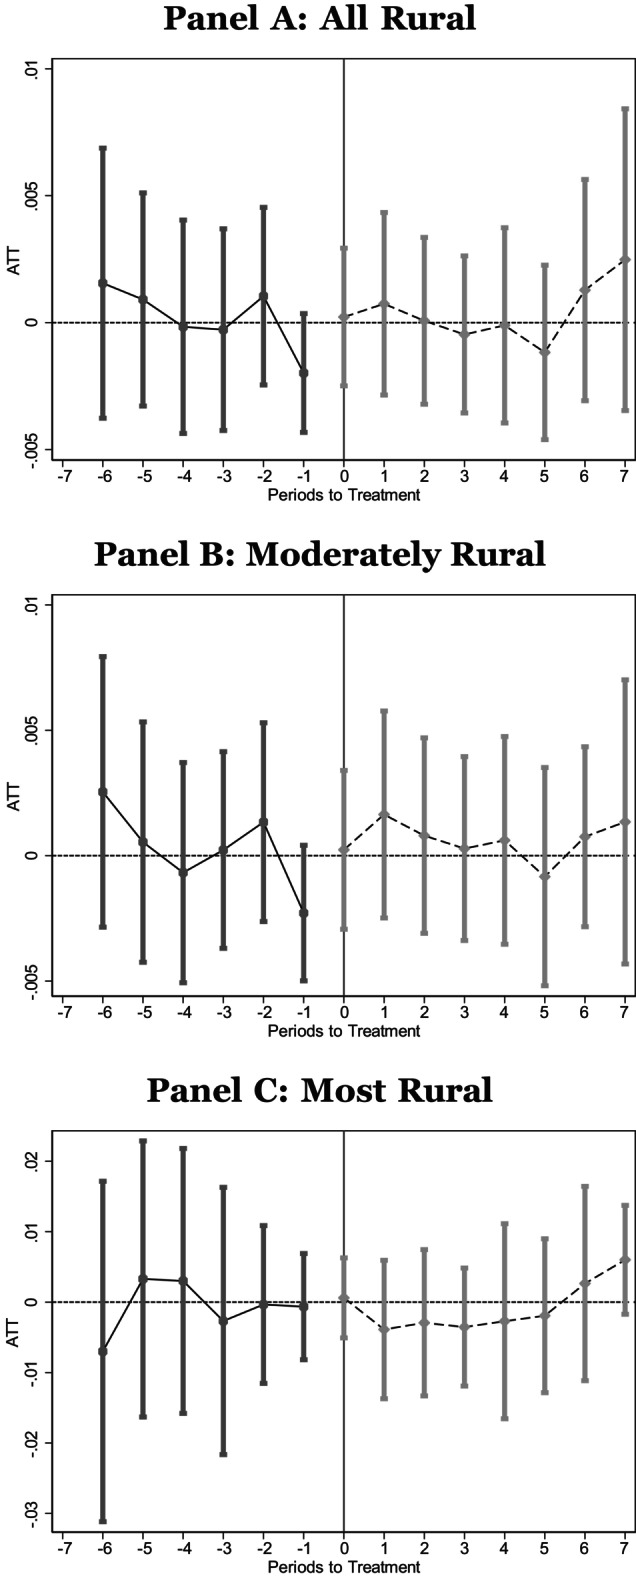
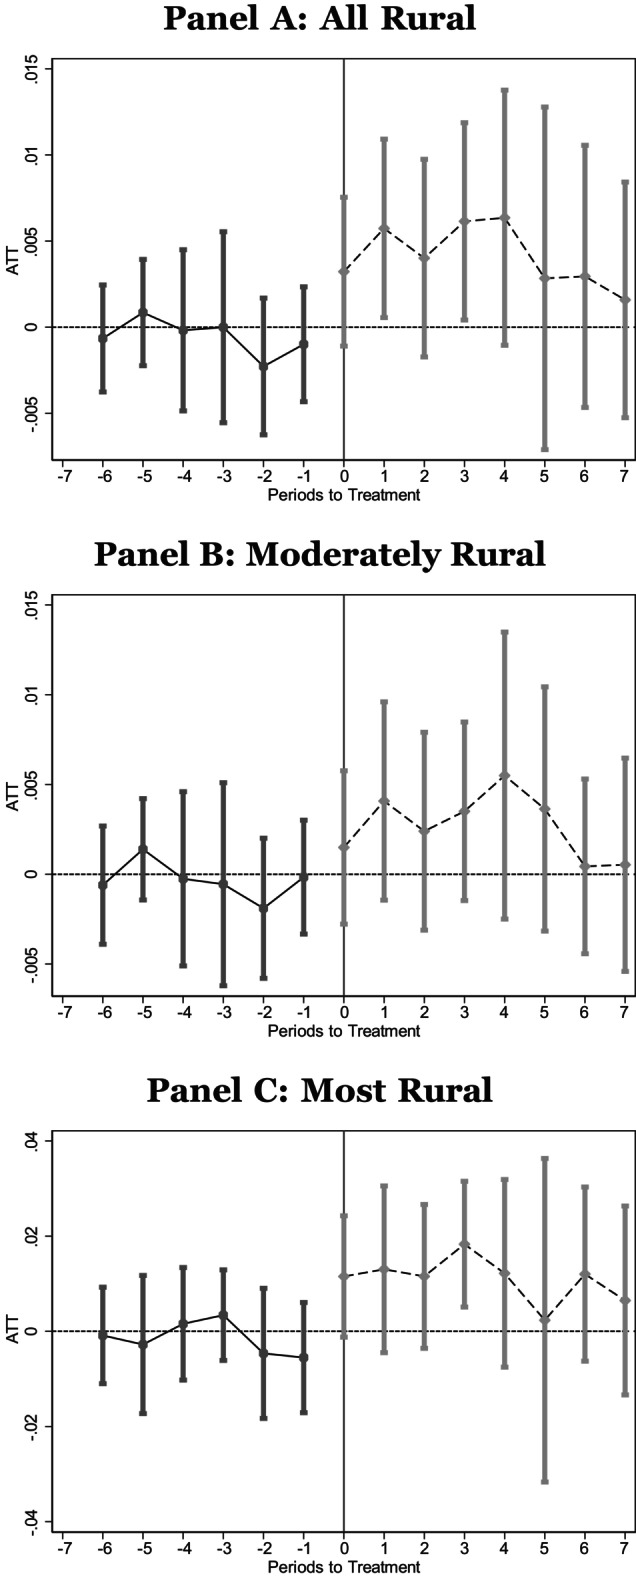
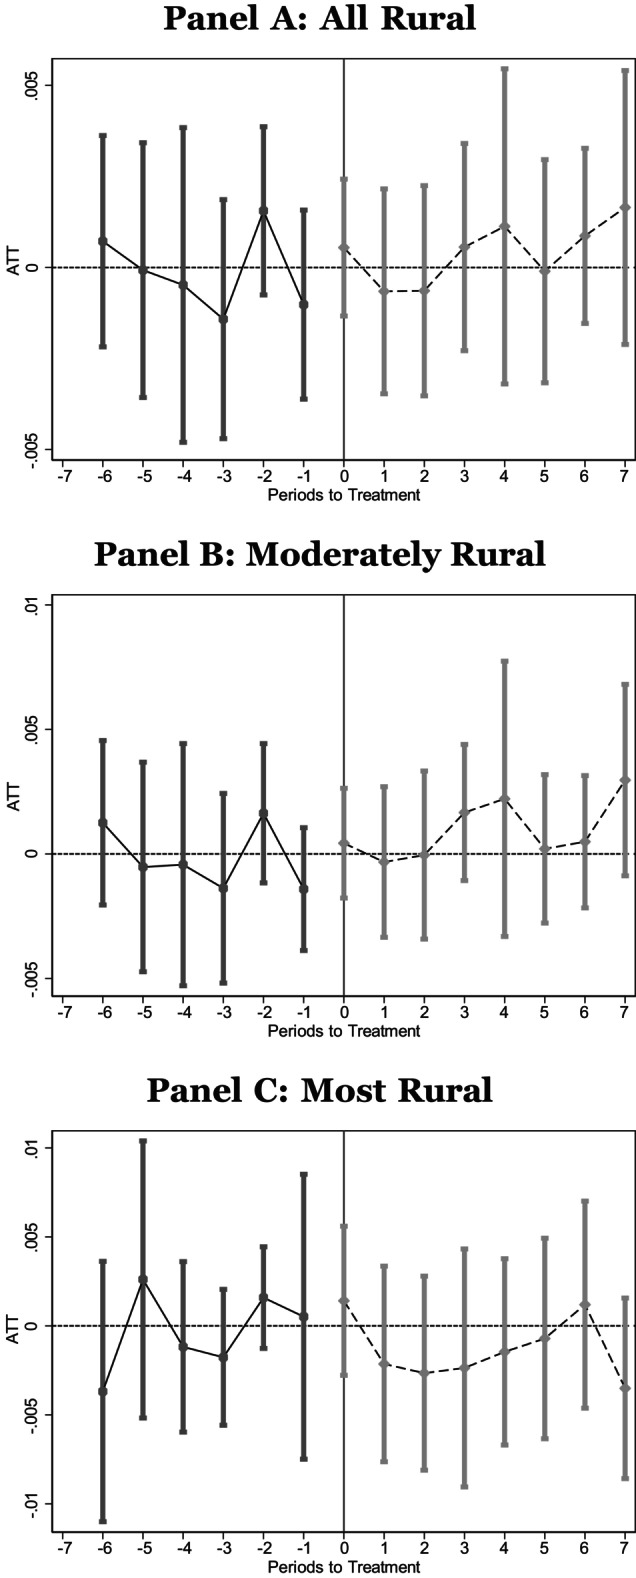
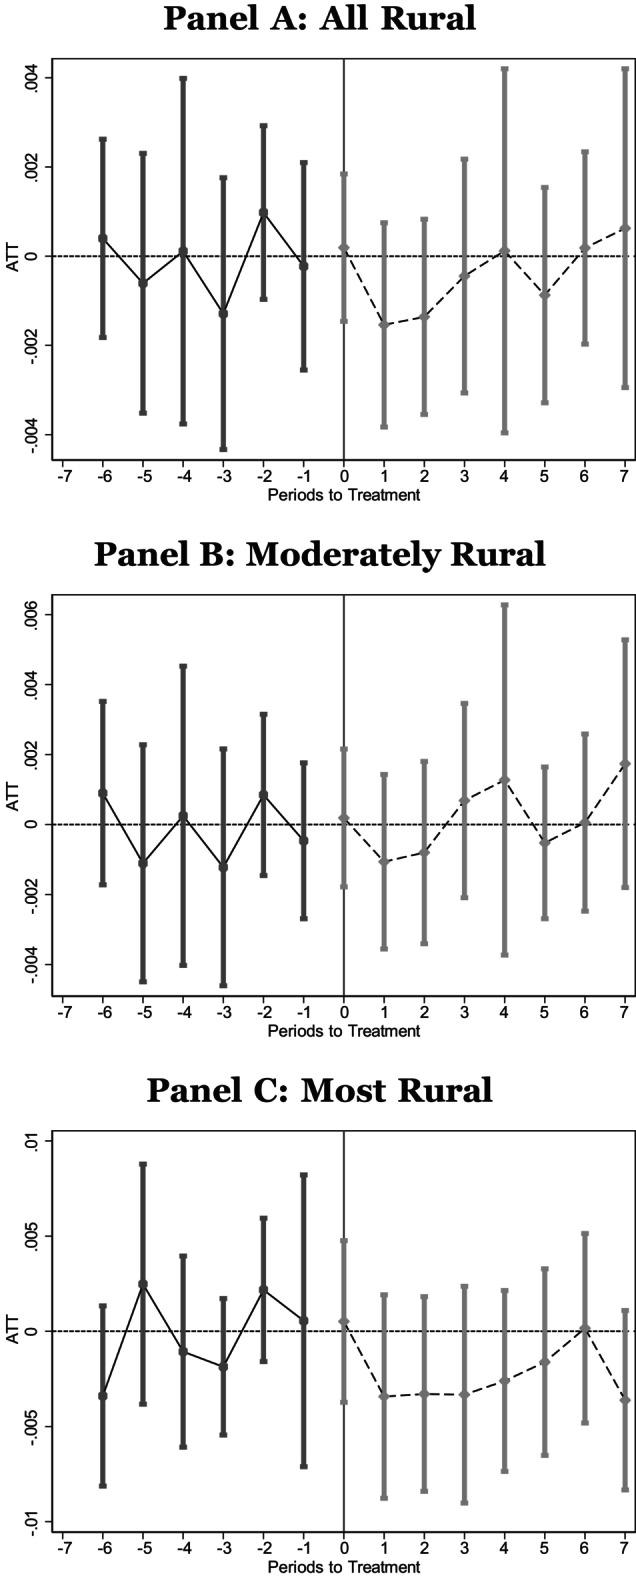
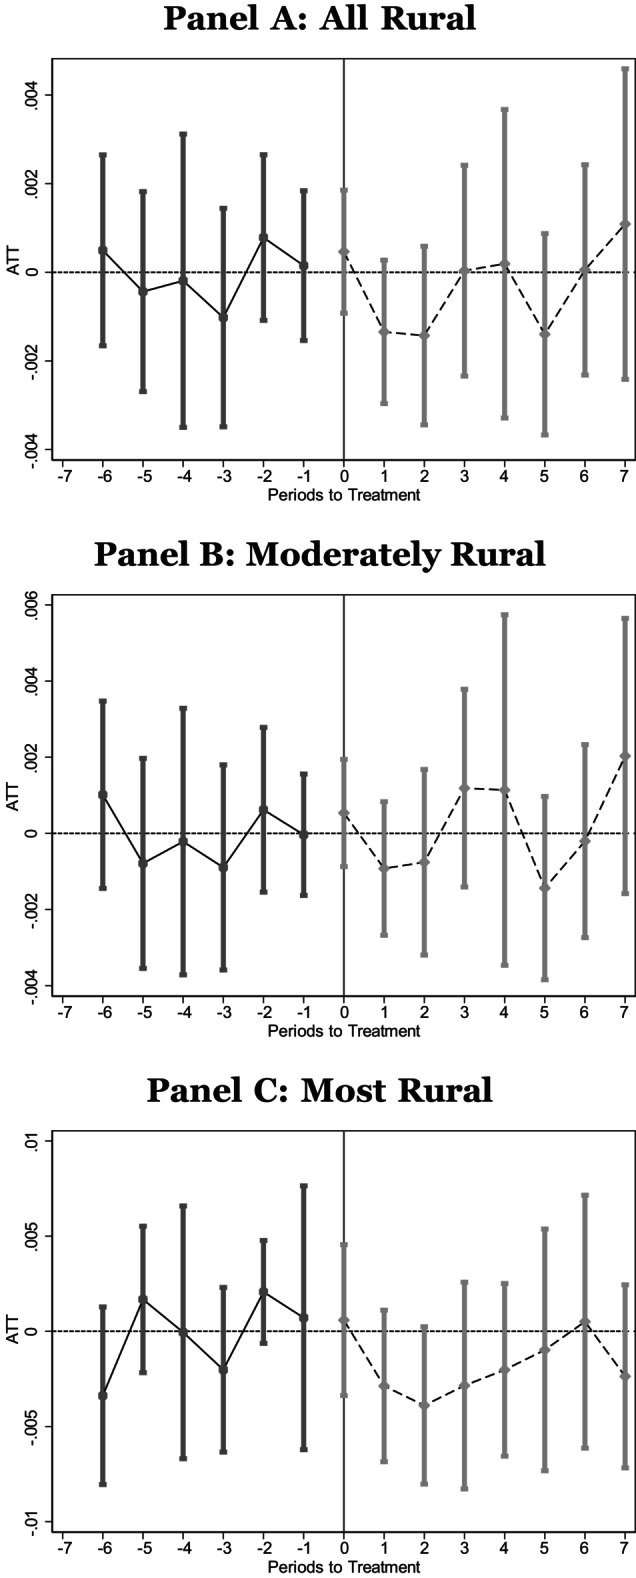
Next, we examine infant health at birth as reported in Figures A4, A5, A6, A7, A8 and Table 3 columns (1–5). For low birth weight, very low birth weight, extremely preterm, preterm, and 5‐min Apgar, we see some evidence of worse health at birth among infants born to mothers in moderately rural counties. Estimates for low birth weight, very low birth weight, and 5‐min Apgar for moderately rural counties are statistically significant for both standard error estimation schemes employed. From these results, we can infer that a birth in a moderately rural county following a hospital closure is 10% more likely to be defined as low birth weight. Moreover, a closure leads to a 0.04 reduction in the 5‐min Apgar score, on average (a decrease of 0.46%). In contrast, we see, if anything, improvements in health at birth among infants born to mothers in the most rural counties.
TABLE 3.
At‐birth outcomes.
| Low birth weight <2500 g (1) | Very low birth weight <1500 g (2) | Extremely preterm <28 wks (3) | Preterm <37 wks (4) | 5‐Min Apgar (5) | Cesarean (6) | Induction (7) | Birth at hospital (8) | |
|---|---|---|---|---|---|---|---|---|
| Panel A: full sample | ||||||||
| ATT | 0.0053 | 0.0016 | 0.0002 | −0.0007 | −0.0368 | 0.0147 | 0.0001 | 0.0044 |
| [0.0026]** | [0.0012] | [0.0009] | [0.0034] | [0.0083]*** | [0.0046]*** | [0.0043] | [0.0013]*** | |
| (0.0026)** | (0.0011) | (0.0008) | (0.0045) | (0.0150)** | (0.0049)*** | (0.0124) | (0.0018)** | |
| N | 7,892,671 | 7,892,671 | 7,890,563 | 7,890,563 | 7,853,347 | 7,883,068 | 7,884,896 | 7,898,269 |
| Mean | 0.081 | 0.014 | 0.007 | 0.123 | 8.792 | 0.315 | 0.284 | 0.979 |
| Panel B: moderately rural | ||||||||
| ATT | 0.0085 | 0.0021 | 0.0006 | 0.0020 | −0.0406 | 0.0140 | −0.0012 | 0.0029 |
| [0.0031]*** | [0.0012]* | [0.0008] | [0.0036] | [0.0095]*** | [0.0056]** | [0.0049] | [0.0011]*** | |
| (0.0030)*** | (0.0013)* | (0.0009) | (0.0052) | (0.0186)** | (0.0048)*** | (0.0147) | (0.0017)* | |
| N | 7,139,732 | 7,139,732 | 7,137,837 | 7,137,837 | 7,104,397 | 7,131,472 | 7,133,935 | 7,144,758 |
| Mean | 0.082 | 0.014 | 0.007 | 0.123 | 8.791 | 0.315 | 0.283 | 0.980 |
| Panel C: most rural | ||||||||
| ATT | −0.0046 | −0.0004 | −0.0012 | −0.0093 | −0.0099 | 0.0174 | 0.0004 | 0.0112 |
| [0.0064] | [0.0026] | [0.0019] | [0.0076] | [0.0211] | [0.0113] | [0.0101] | [0.0042]*** | |
| (0.0064) | (0.0018) | (0.0020) | (0.0046)** | (0.0375) | (0.0120) | (0.0119) | (0.0038)*** | |
| N | 752,939 | 752,939 | 752,726 | 752,726 | 748,950 | 751,596 | 750,961 | 753,511 |
| Mean | 0.080 | 0.013 | 0.007 | 0.123 | 8.799 | 0.311 | 0.288 | 0.970 |
Note: National Vital Statistics System Birth Data, 2005–2019. We use vital statistics birth records to estimate the relationship between a hospital closure and outcomes at birth for the infant (Columns 1–5) and the mode of birth (Columns 6–7). We estimate average treatment on the treated using csdid. Panel A contains estimates using all rural counties while Panels B and C contain estimates using only moderately rural or most rural counties, respectively. The sample is restricted to counties that experienced a closure of a Critical Access Hospital or Sole Community Hospital and did not appear to lose obstetric services in the years leading up to the closure. Wildbootstrapped standard errors are in square brackets and standard errors in parentheses are also clustered by the county of residence.
p < 0.10;
p < 0.05;
p < 0.01.
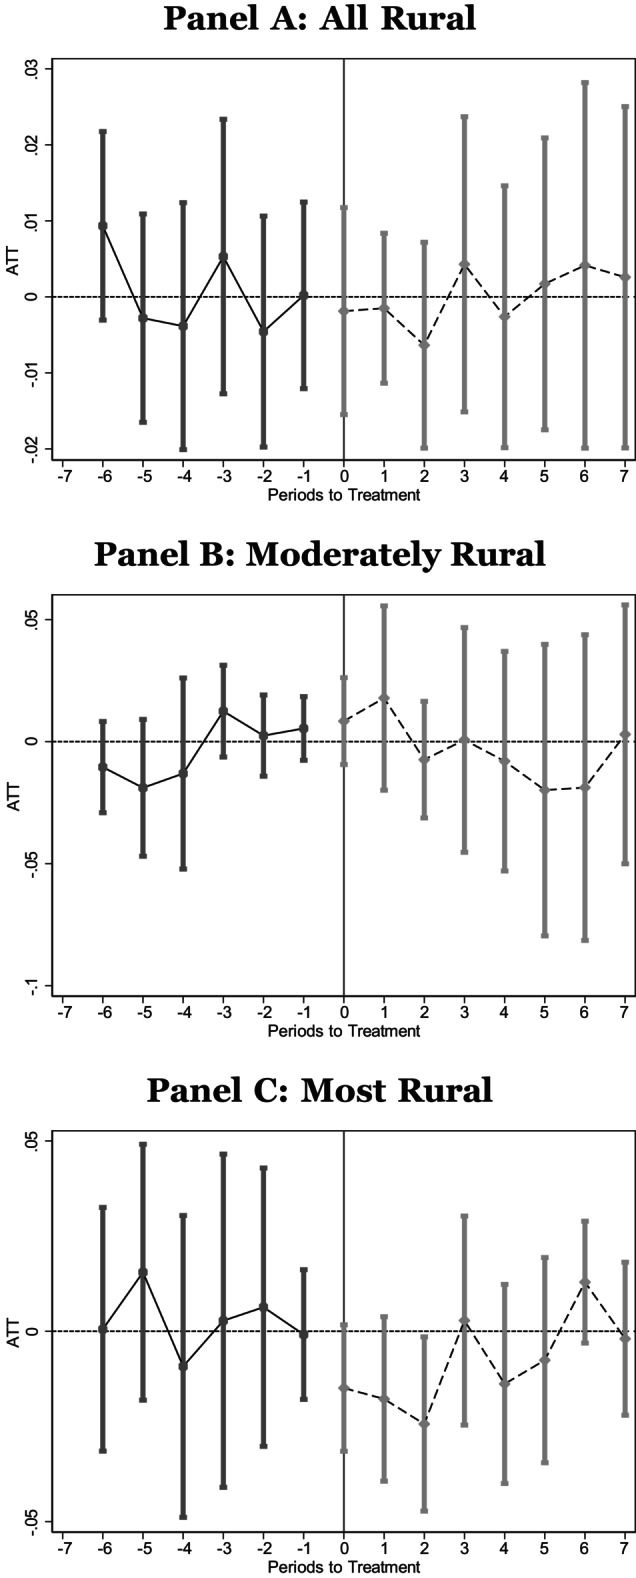
We also examine whether the closure of the hospital shifted the mode or location of the delivery as reported in Table 3, columns (6–8) and in Figures A9, A10, A11. We find that mothers in moderately rural counties are 4.4% more likely to experience cesarean, and while the coefficient is similar in magnitude for the most rural counties, it is not statistically significant. There is no change in the likelihood of induction for either group. We find that individuals in moderately rural and most rural counties are 0.30% and 1.15%, respectively, more likely to give birth in a hospital after the closure. While these effects appear small, we note that nearly all births occurred in a hospital setting.
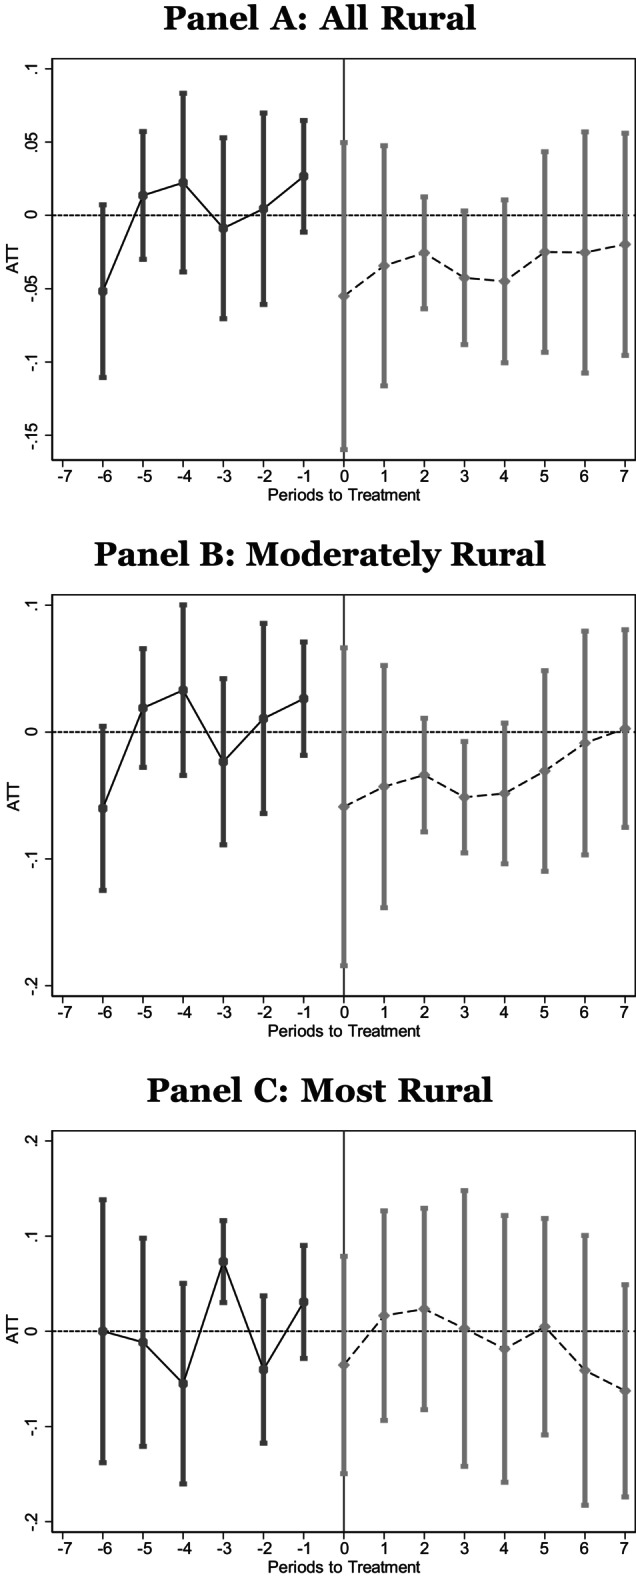
Finally, we examine the relationship between hospital closures and infant death. Using the Linked Birth and Infant Death data, we estimate the effect on infant death: <= 1 year of birth (i.e., infant mortality), <=30 days of birth, <=7 days of birth, and <=1 day after birth. Results are reported in Figures A12, A13, A14, A15 and ATT estimates are contained in Table 4. For the most rural counties, we estimate a negative, but statistically insignificant relationship between hospital closures and infant death. The event studies also indicate a similar relationship.
TABLE 4.
Infant mortality.
| Infant mortality first year (1) | Death <= 30 days (2) | Death <= 7 days (3) | Death <= 1 day (4) | |
|---|---|---|---|---|
| Panel A: full sample | ||||
| ATT | −0.0001 | 0.0002 | −0.0005 | −0.0004 |
| [0.0010] | [0.0007] | [0.0007] | [0.0006] | |
| (0.0008) | (0.0006) | (0.0006) | (0.0005) | |
| N | 6,928,377 | 6,928,377 | 6,928,377 | 6,928,377 |
| Mean | 0.007 | 0.004 | 0.003 | 0.003 |
| Panel B: moderately rural | ||||
| ATT | 0.0002 | 0.0007 | −0.0000 | 0.0001 |
| [0.0011] | [0.0009] | [0.0008] | [0.0007] | |
| (0.0009) | (0.0006) | (0.0006) | (0.0006) | |
| N | 6,267,822 | 6,267,822 | 6,267,822 | 6,267,822 |
| Mean | 0.007 | 0.004 | 0.003 | 0.003 |
| Panel C: most rural | ||||
| ATT | −0.0012 | −0.0012 | −0.0021 | −0.0018 |
| [0.0020] | [0.0016] | [0.0016] | [0.0015] | |
| (0.0015) | (0.0014) | (0.0013) | (0.0014) | |
| N | 660,555 | 660,555 | 660,555 | 660,555 |
| Mean | 0.007 | 0.004 | 0.003 | 0.003 |
Note: National Vital Statistics Linked Infant Birth‐Death data. Infant deaths in the United States between 2005 and 2018, corresponding to births between 2005 and 2017. We use vital statistics linked infant birth‐death records to estimate the relationship between a hospital closure and infant mortality. We estimate average treatment on the treated using csdid. Panel A contains estimates using all rural counties while Panels B and C contain estimates using only moderately rural or most rural counties, respectively. The sample is restricted to counties that experienced a closure of a Critical Access Hospital or Sole Community Hospital and did not appear to lose obstetric services in the years leading up to the closure. Wildbootstrapped standard errors are in square brackets and standard errors in parentheses are also clustered by the county of residence.
p < 0.10;
p < 0.05;
p < 0.01.
4. DISCUSSION
We begin by showing evidence that when a hospital in a mother's county of residence closes, she is less likely to give birth in her county of residence. Using our full sample, we predict that this shift affects approximately 6319 births each year. This result is largely consistent with prior literature. When we examine the shift by degree of rurality, our estimates reveal that this shift is more dramatic for, and likely driven by, the most rural counties. This evidence is consistent with closures pushing residents of the most rural counties to seek care in a different county and residents in moderately rural counties to seek care at a different hospital in the same county.
When we turn to prenatal care, our results indicate mothers in the moderately rural counties delay prenatal care after the closure, and this appears to precede worsening health at birth in those counties. While prior literature has found that OB unit closures are associated with reductions in cesarean, we find that hospital closures lead to increased rates of cesarean for mothers in moderately rural counties, which could indicate a larger fraction of emergent deliveries or shifts to lower quality hospitals performing a higher fraction of medically unnecessary procedures.
Our expectations suggested that a hospital closure may decrease hospital births because of additional travel distances. Yet, we find evidence of a small increase in at‐hospital births. Without a nearby hospital available for emergencies, home or birth center births may be less preferred (although most individuals deliver at a hospital).
We also hypothesized that closures may have impacted infant mortality. Our evidence does not suggest that closures lead to an increase in infant deaths and may have reduced infant deaths in the most rural counties, though we are cautious in the weight placed on these results. The prior literature has largely found no effect on infant or maternal health from OB unit closures. 16 , 17 , 18
Importantly, our findings uncover differences by the degree of rurality of the county experiencing a closure. We generally find improvements, although not always statistically significant, for individuals in the most rural counties and vice versa for the moderately rural counties, highlighting the differences in the effects by degree of rurality. These findings are distinct from the prior literature as we consider hospital closures per se and we estimate effects for moderately and most rural populations separately. Our findings suggest that the effects of hospital closures across rurality are different; approaches that are agnostic to the degree of rurality may be masking considerable treatment heterogeneity. One interpretation of our findings is that mothers in the most rural counties already have very limited access to hospital‐based maternal and infant care prior to a closure, and the closure did not substantially change their behavior regarding childbirth‐related health care. Mothers in moderately rural counties may have experienced a larger shock after losing access to a local hospital. We note that while mothers in most rural counties appear to see positive health impacts, they may suffer from other hardships created by travel distance to the nearest source of care including loss of family and other social supports, which may increase maternal stress and create additional time costs that we cannot measure.
Finally, hospital closures might not be homogenous, that is, losing a CAH/SCH may have more dire effects than losing a hospital without that designation. As such, we also focused on the effects of losing access to the (likely) only hospital nearby and not (only) the loss of OB care at a hospital. While we find modest improvement (most rural) and modest worsening (moderately rural) for most infant health measures, prior work has found no effect 16 , 17 , 18 or reduced infant health 15 from a loss of hospital‐based OB care in rural counties. Our results utilize Sheps Center data to identify rural hospital closures, which have been used in prior hospital closures literature. 28 Prior literature, however, has used different metrics: American Hospital Association data or inference of OB unit closures from birth rate trends. Differences in our findings may be driven by the use of data to identify rural hospital closures or differences in losing OB care without losing hospital care (or vice versa).
5. LIMITATIONS
We use birth data, which have known limitations, including self‐reported data. We limited our investigation to better validated outcomes in NVSS data, but some reporting bias could remain. 21 Moreover, birth data allow identification by county of residence, but not the exact address of the individual. Hospital closure data included only rural closures (not openings) and were hand‐linked to county of location based on addresses. County residents may have begun to shift health care behavior in advance of a known upcoming closure (although this should be addressed and identified in our ES models). We are unable to measure the exact hospital of birth, only county of birth, so while our evidence suggests women in moderately rural counties are likely shifting to different hospitals in the same county due to the closure, we cannot test this directly. For this reason, we are also unable to determine whether the worsening birth outcomes of infants from moderately rural counties are due to inherently worse quality of health care or diminished quality due to congestion at remaining hospital(s).
6. CONCLUSIONS
Reproductive‐age individuals experience significant differences in health care access and health outcomes between urban and rural areas. These disparities may be exacerbated by hospital closures in rural areas and, more recently, legal changes in access to reproductive health care. We find that hospital service loss has important implications for infant and maternal health at the margin of rurality. Specifically, we find fewer individuals deliver in their county of residence after a hospital closure, and this is most pronounced for residents of the most rural counties. Moreover, these differences by rurality persist when we examine prenatal health behaviors and health outcomes at birth. Mothers in moderately rural counties initiated prenatal care later in their pregnancies after a closure while those in the most rural counties initiated earlier, if they changed at all. Additionally, infants and individuals in the moderately rural counties had slightly worse health and delivery outcomes, while those in the most rural counties had slightly better health and delivery outcomes. We also find suggested evidence of decreased infant deaths in the most rural counties. Our results suggest that individuals living in most rural settings may receive higher quality care post‐closure. In summary, our results indicate that loss of hospital care, which may include loss of OB care, has meaningful effects on the rural population, and that investigating rural counties in aggregate might miss nuanced differences in the effects on the margin of rurality and points to the need for further research in this area.
FUNDING INFORMATION
This work was supported by a University of North Carolina at Charlotte, Belk College Summer Research Grant.
CONFLICT OF INTEREST STATEMENT
All authors report no conflicts of interest.
ACKNOWLEDGMENTS
We are grateful for excellent research assistance by Hayley Barwick and Lilian Ademu. We thank conference and seminar participants at the American Society of Health Economists, Association for Public Policy Analysis and Management, Carolina Region Empirical Economics Day; Southern Economic Association, and University of Nevada, Reno.
APPENDIX 1.
FIGURE A1.
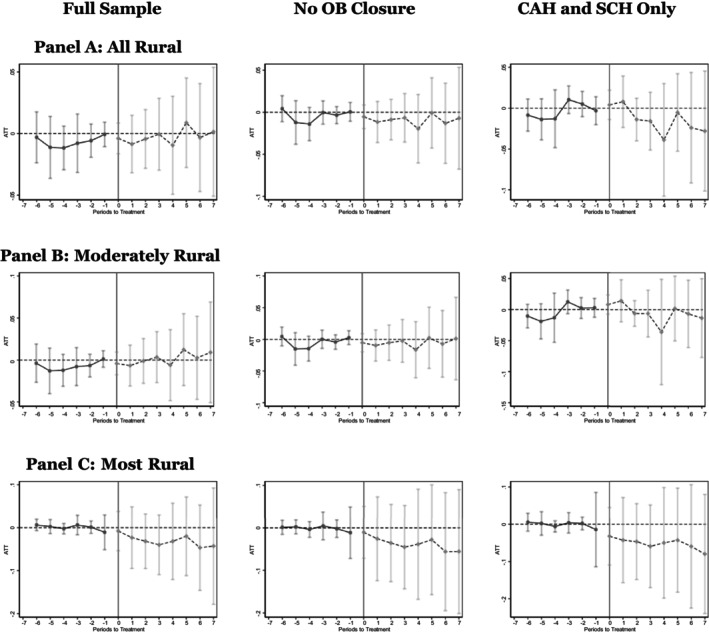
Same county. National Vital Statistics System Birth Data, 2005–2019. We use vital statistics birth records to estimate the relationship between a hospital closure and the likelihood that an individual gives birth in her county of residence. These figures give the event study figures corresponding to the regression results in Table 1. Panel A contains estimates using all rural counties while Panels B and C contain estimates using only moderately rural or most rural counties, respectively. The sample for Column (1) represents all counties classified as rural; the sample for Column (2) represents rural counties that did not appear to experience a closure of their obstetric unit leading up to the hospital closure; the sample for Column (3) further restricts the sample to those that experienced a closure of a Critical Access Hospital or Sole Community Hospital and did not appear to lose obstetric services in the years leading up to the closure.
FIGURE A2.
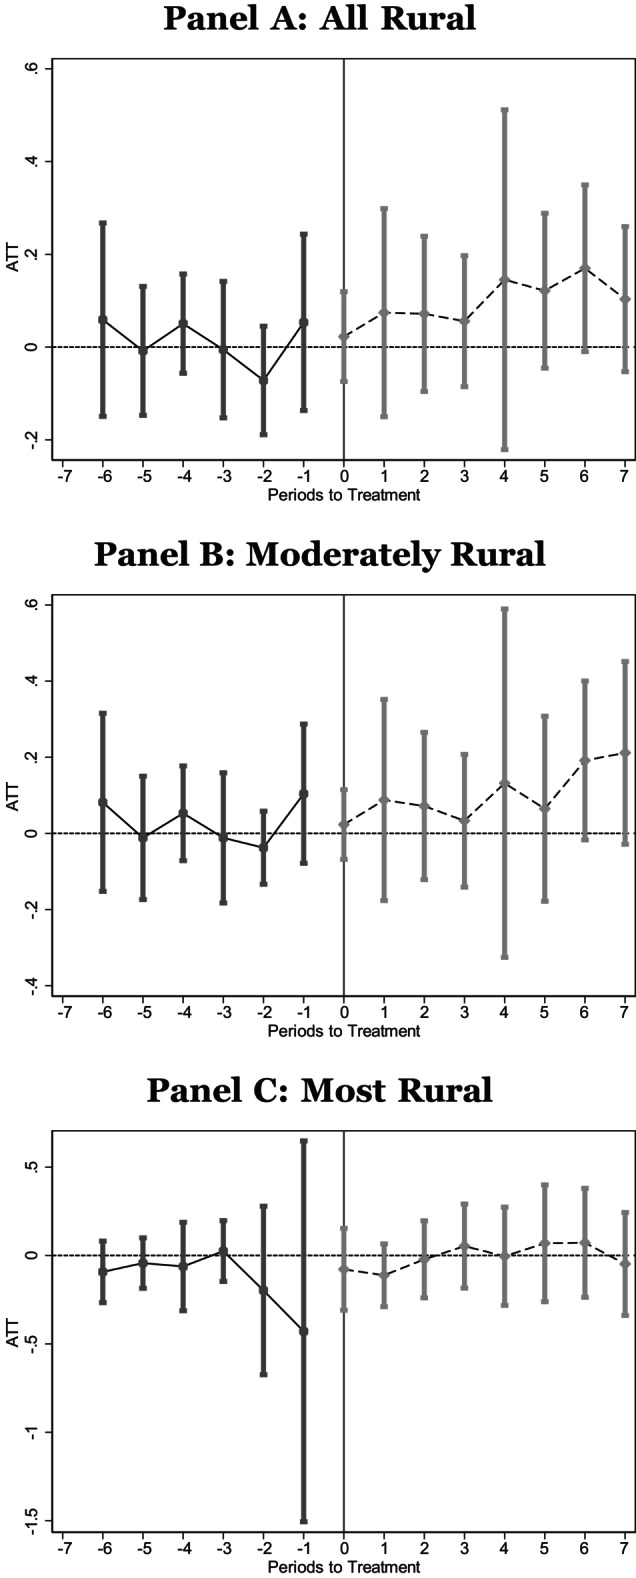
Month prenatal care initiated. National Vital Statistics System Birth Data, 2005–2019. Panel A contains estimates using all rural counties, while Panels B and C contain estimates using only moderately rural or most rural counties, respectively. These figures give the event study figures corresponding to the regression results in Table 2. The sample is restricted to counties that experienced a closure of a Critical Access Hospital or Sole Community Hospital and did not appear to lose obstetric services in the years leading up to the closure.
FIGURE A3.
Did not receive prenatal care in first trimester. National Vital Statistics System Birth Data, 2005–2019. Panel A contains estimates using all rural counties, while Panels B and C contain estimates using only moderately rural or most rural counties, respectively. These figures give the event study figures corresponding to the regression results in Table 2. The sample is restricted to counties that experienced a closure of a Critical Access Hospital or Sole Community Hospital and did not appear to lose obstetric services in the years leading up to the closure.
FIGURE A4.
Low birth weight. National Vital Statistics System Birth Data, 2005–2019. Panel A contains estimates using all rural counties, while Panels B and C contain estimates using only moderately rural or most rural counties, respectively. These figures give the event study figures corresponding to the regression results in Table 3. The sample is restricted to counties that experienced a closure of a Critical Access Hospital or Sole Community Hospital and did not appear to lose obstetric services in the years leading up to the closure.
FIGURE A5.
Very low birth weight. National Vital Statistics System Birth Data, 2005–2019. Panel A contains estimates using all rural counties, while Panels B and C contain estimates using only moderately rural or most rural counties, respectively. These figures give the event study figures corresponding to the regression results in Table 3. The sample is restricted to counties that experienced a closure of a Critical Access Hospital or Sole Community Hospital and did not appear to lose obstetric services in the years leading up to the closure.
FIGURE A6.
Extremely preterm. National Vital Statistics System Birth Data, 2005–2019. Panel A contains estimates using all rural counties, while Panels B and C contain estimates using only moderately rural or most rural counties, respectively. These figures give the event study figures corresponding to the regression results in Table 3. The sample is restricted to counties that experienced a closure of a Critical Access Hospital or Sole Community Hospital and did not appear to lose obstetric services in the years leading up to the closure.
FIGURE A7.
Preterm. National Vital Statistics System Birth Data, 2005–2019. Panel A contains estimates using all rural counties, while Panels B and C contain estimates using only moderately rural or most rural counties, respectively. These figures give the event study figures corresponding to the regression results in Table 3. The sample is restricted to counties that experienced a closure of a Critical Access Hospital or Sole Community Hospital and did not appear to lose obstetric services in the years leading up to the closure.
FIGURE A8.
5‐min Apgar. National Vital Statistics System Birth Data, 2005–2019. Panel A contains estimates using all rural counties, while Panels B and C contain estimates using only moderately rural or most rural counties, respectively. These figures give the event study figures corresponding to the regression results in Table 3. The sample is restricted to counties that experienced a closure of a Critical Access Hospital or Sole Community Hospital and did not appear to lose obstetric services in the years leading up to the closure.
FIGURE A9.
Cesarean. National Vital Statistics System Birth Data, 2005–2019. Panel A contains estimates using all rural counties, while Panels B and C contain estimates using only moderately rural or most rural counties, respectively. These figures give the event study figures corresponding to the regression results in Table 3. The sample is restricted to counties that experienced a closure of a Critical Access Hospital or Sole Community Hospital and did not appear to lose obstetric services in the years leading up to the closure.
FIGURE A10.
Induction. National Vital Statistics System Birth Data, 2005–2019. Panel A contains estimates using all rural counties, while Panels B and C contain estimates using only moderately rural or most rural counties, respectively. These figures give the event study figures corresponding to the regression results in Table 3. The sample is restricted to counties that experienced a closure of a Critical Access Hospital or Sole Community Hospital and did not appear to lose obstetric services in the years leading up to the closure.
FIGURE A11.
Birth at hospital. National Vital Statistics System Birth Data, 2005–2019. Panel A contains estimates using all rural counties, while Panels B and C contain estimates using only moderately rural or most rural counties, respectively. These figures give the event study figures corresponding to the regression results in Table 3. The sample is restricted to counties that experienced a closure of a Critical Access Hospital or Sole Community Hospital and did not appear to lose obstetric services in the years leading up to the closure.
FIGURE A12.
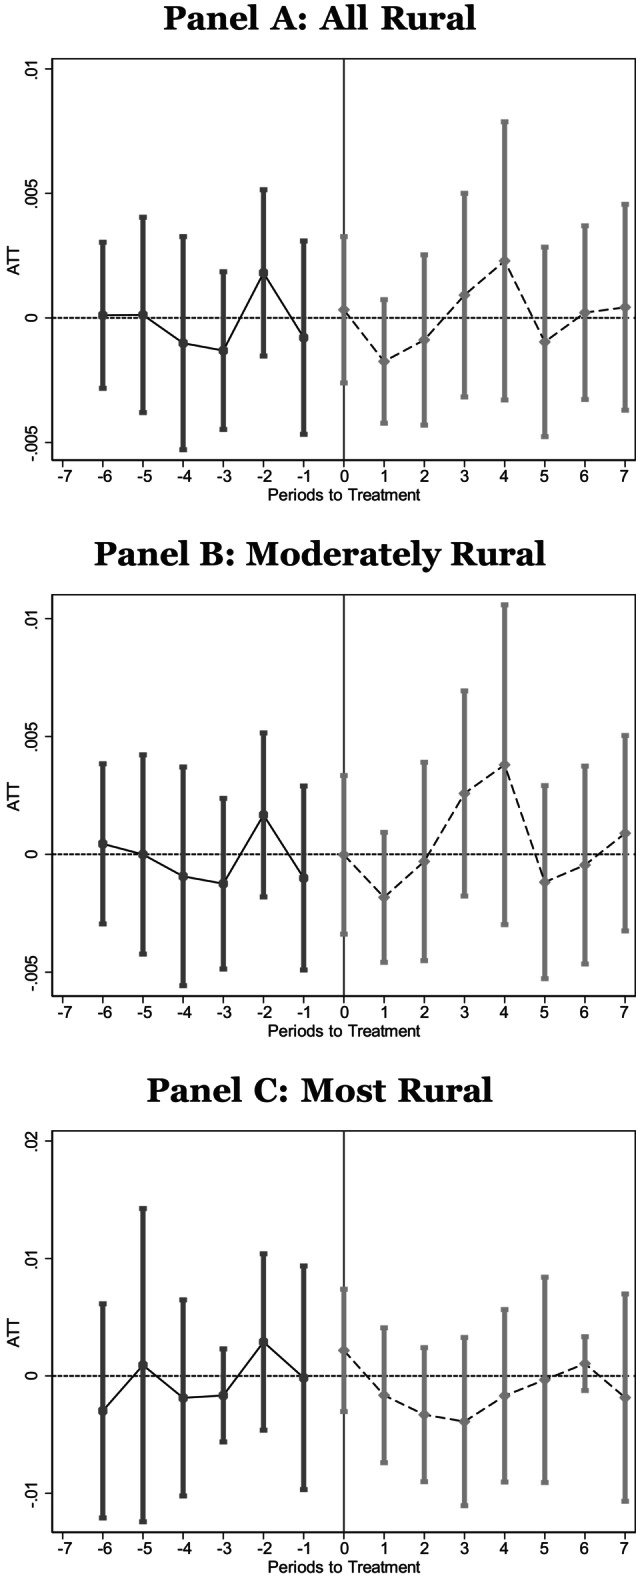
Infant death (first year). National Vital Statistics Linked Infant Birth‐Death data. Infant deaths in the United States between 2005 and 2018, corresponding to births between 2005 and 2017. Panel A contains estimates using all rural counties, while Panels B and C contain estimates using only moderately rural or most rural counties, respectively. These figures give the event study figures corresponding to the regression results in Table 4. The sample is restricted to counties that experienced a closure of a Critical Access Hospital or Sole Community Hospital and did not appear to lose obstetric services in the years leading up to the closure.
FIGURE A13.
Infant death (<=30 days of birth). National Vital Statistics Linked Infant Birth‐Death data. Infant deaths in the United States between 2005 and 2018, corresponding to births between 2005 and 2017. Panel A contains estimates using all rural counties, while Panels B and C contain estimates using only moderately rural or most rural counties, respectively. These figures give the event study figures corresponding to the regression results in Table 4. The sample is restricted to counties that experienced a closure of a Critical Access Hospital or Sole Community Hospital and did not appear to lose obstetric services in the years leading up to the closure.
FIGURE A14.
Infant death (<=7 days of birth). National Vital Statistics Linked Infant Birth‐Death data. Infant deaths in the United States between 2005 and 2018, corresponding to births between 2005 and 2017. Panel A contains estimates using all rural counties, while Panels B and C contain estimates using only moderately rural or most rural counties, respectively. These figures give the event study figures corresponding to the regression results in Table 4. The sample is restricted to counties that experienced a closure of a Critical Access Hospital or Sole Community Hospital and did not appear to lose obstetric services in the years leading up to the closure.
FIGURE A15.
Infant death (<= 1 day after birth). National Vital Statistics Linked Infant Birth‐Death data. Infant deaths in the United States between 2005 and 2018, corresponding to births between 2005 and 2017. Panel A contains estimates using all rural counties, while Panels B and C contain estimates using only moderately rural or most rural counties, respectively. These figures give the event study figures corresponding to the regression results in Table 4. The sample is restricted to counties that experienced a closure of a Critical Access Hospital or Sole Community Hospital and did not appear to lose obstetric services in the years leading up to the closure.
Durrance C, Guldi M, Schulkind L. The effect of rural hospital closures on maternal and infant health. Health Serv Res. 2024;59(2):e14248. doi: 10.1111/1475-6773.14248
REFERENCES
- 1. Hung P, Kozhimannil K, Henning‐Smith C, Casey M. Closure of Hospital Obstetric Services Disproportionately Affects less‐Populated Rural Counties. University of Minnesota Rural Health Research Center; 2017. http://rhrc.umn.edu/wp-content/files_mf/1491501904UMRHRCOBclosuresPolicyBrief.pdf [Google Scholar]
- 2. March of Dimes . Nowhere to Go: Maternity Care Deserts Across the U.S. 2018. https://www.marchofdimes.org/maternity-care-deserts-report
- 3. Government Accountability Office . Maternal health: availability of hospital‐based obstetric care in rural areas. Report to Congressional Committees. October 2022. Available at Maternal Health: Availability of Hospital‐Based Obstetric Care in Rural Areas|U.S. GAO.
- 4. Centers for Medicare & Medicaid . Improving access to maternal health care in rural communities. n.d.. https://www.cms.gov/About‐CMS/Agency‐Information/OMH/equity‐initiatives/rural‐health/09032019‐Maternal‐Health‐Care‐in‐Rural‐Communities.pdf
- 5. American College of Obstetricians and Gynecologists) . Health disparities in rural women, committee opinion No. 586. 2014. https://www.acog.org/clinical/clinical-guidance/committee-opinion/articles/2014/02/health-disparities-in-rural-women
- 6. Sheps Center . Rural hospital closures: more information. 2021. https://www.shepscenter.unc.edu/programs‐projects/rural‐health/rural‐hospital‐closures‐archive/rural‐hospital‐closures/
- 7. Tabachnik C. Idaho hospital to stop labor and delivery services citing “political climate” and doctor shortages. CBS News 2023.
- 8. Lam O, Broderick B, Toor S. How far americans live from the closest hospital differs by community type. 2016.
- 9. Currie J, Reagan P. Distance to hospital and children's use of preventive care: is being closer better and for whom? Econ Inq. 2003;41(3):378‐391. [Google Scholar]
- 10. Miller KEM, James HJ, Holmes GM, Van Houtven CH. The effect of rural hospital closures on emergency medical service response and transport times. Health Serv Res. 2020;55:288‐300. [DOI] [PMC free article] [PubMed] [Google Scholar]
- 11. Buchmueller TC, Jacobson M, Wold C. How far to the hospital?: the effect of hospital closures on access to care. J Health Econ. 2006;25(4):740‐761. [DOI] [PubMed] [Google Scholar]
- 12. Gurjal K, Basu A. Impact of rural and Urban Hospital closures on inpatient mortality. NBER Working Paper Series No. 26182 2019. https://www.nber.org/papers/w26182
- 13. Hung P, Kozhimannil K, Casey M, Moscovice I. Why are obstetric units in rural hospitals closing their doors? Health Serv Res. 2016;51(4):1546‐1560. [DOI] [PMC free article] [PubMed] [Google Scholar]
- 14. Government Accountability Office . Rural hospital closures: number and characteristics of affected hospitals and contributing factors report. 2018.
- 15. Musa A, Bonifield J. Maternity units are closing across America, forcing expectant mothers to hit the road. CNN. https://www.cnn.com/2023/04/07/health/maternity-units-closing/index.html
- 16. Battaglia E. The effect of hospital closures on maternal & infant health, Working Paper. 2021. https://emilybattaglia.github.io/Battaglia/Battaglia_JMP.pdf
- 17. Fischer SJ, Royer H, White CD. Health care centralization: the health impacts of obstetric unit closures in the US. NBER Working Paper No. 30141 2022. https://www.nber.org/papers/w30141
- 18. Kozhimannil KB, Hung P, Henning‐Smith C, Casey MM, Prasad S. Association between loss of hospital‐based obstetric services and birth outcomes in rural counties in the United States. JAMA. 2018;319(12):1239‐1247. [DOI] [PMC free article] [PubMed] [Google Scholar]
- 19. Chatterji P, Ho C, Wu X. Obstetric unit closures and racial/ethnic disparity in health. NBER Working #30986. https://www.nber.org/papers/w30986
- 20. Callaway B, Sant'Anna PHC. Difference‐in‐differences with multiple time periods. J Economet. 2021;225(2):200‐230. [Google Scholar]
- 21. USDA . Rural‐Urban commuting area codes. https://www.ers.usda.gov/data-products/rural-urban-commuting-area-codes/
- 22. National vital statistics reports: from the Centers for Disease Control and Prevention, National Center for Health Statistics, National Vital Statistics System. Hyattsville, MD: National Center for Health Statistics.
- 23. Gemmill A, Leonard SA. Risk of adverse pregnancy outcomes among US individuals with gestational diabetes by race & ethnicity. JAMA. 2022;328(4):397. [DOI] [PubMed] [Google Scholar]
- 24. Luke B, Brown MB, Liu C, Diop H, Stern JE. Validation of severe maternal morbidity on the US certificate of live birth. Epidemiology. 2018;29(4):e31‐e32. [DOI] [PMC free article] [PubMed] [Google Scholar]
- 25. Haghighat N, Hu M, Laurent O, Chung J, Nguyen P, Wu J. Comparison of birth certificates and hospital‐based birth data on pregnancy complications in Los Angeles and Orange County, California. BMC Pregnancy Childbirth. 2016;16:93. [DOI] [PMC free article] [PubMed] [Google Scholar]
- 26. Mukhopadhyay S, Wendel J, Lee W, Yang W. Analyzing the impact of prenatal care on infant health: do we have useful input and output measures? Econom Bull. 2008;9(21):1‐14. [Google Scholar]
- 27. Abadie A, Athey S, Imbens GW, Wooldridge JM. When should you adjust standard errors for clustering? Q J Econ. 2023;138(1):1‐35. doi: 10.1093/qje/qjac038 [DOI] [Google Scholar]
- 28. Alexander D, Richards MR. Economic consequences of hospital closures. J Public Econom. 2023;221:1‐16. [Google Scholar]