

Abstract
Objective
To test the reliability of Medicare claims in measuring vertical integration. We assess the accuracy of a commonly used measure of integration, primary care physician (PCP) practices billing Medicare as a hospital outpatient department (HOPD) in claims.
Data Sources and Study Setting
Medicare fee‐for‐service claims, IQVIA, and CPC+ practice surveys for this study.
Study Design
We compare measures of integration from Medicare claims to self‐reported indicators of integration from IQVIA and a survey of CPC+ participating practice sites.
Data Collection/Extraction Methods
We measure integration by using site‐of‐service billing in the 100% sample of Medicare Carrier claims from 2017–2020. In the IQVIA SK&A (2017–2018), OneKey (2019–2020), and practice survey data (2017–2019), we use self‐reported responses to measure integration.
Principal Findings
We find that currently most PCP practices sites that report themselves as being integrated with a health system do not bill as an HOPD. In 2017, 11% of CPC+ practices were identified as being vertically integrated in claims, while the equivalent numbers in SK&A and surveys were 52% and 54% integration, respectively. A t‐test found that both datasets significantly differed from claims (Survey: 41.3%–45.1%; SK&A: 45.3%–51.1%); this gap persists in 2018–2019.
Conclusion
Measuring physician‐hospital vertical integration accurately is integral to determining consolidation. The overwhelming majority of PCP practice sites not billing as an HOPD may reflect Medicare regulatory changes that have reduced the financial incentives for doing so. These findings have implications for researchers that study the growth in PCP‐hospital integration in health care markets.
Keywords: health care organizations and systems, hospitals, ownership/governance
What is known on this topic
Medicare reimburses services provided at hospital outpatient departments at a higher rate than services provided at a physician owned outpatient practice site.
Researchers commonly use site of billing in Medicare claims to measure vertical integration between physician practices and hospitals.
What this study adds
We find that Medicare claims underestimates the level of integration between primary care practices and hospitals by more than forty percentage points.
Studies that use site‐of‐service billing in claims to measure vertical integration could be underreporting the amount of PCP‐hospital integration in the health care market.
1. INTRODUCTION
Vertical integration is an increasingly common feature of American health care. 1 , 2 , 3 , 4 Most vertical integration involves hospitals acquiring, or otherwise establishing tight co‐management of physician practices 5 , 6 with hospital systems incorporating physicians into their organizations to guide the flow of clinical resources. 7 Note, vertical integration in this context does not necessarily reflect effective “clinical integration” of care delivery. 8 Rates of physician practice integration with health systems appear to vary substantially by specialty. 9 One study estimated that from 2007–2017, there was a 4%–34% increase in the number of physicians practices owned by health systems depending on specialty, 10 with adult primary care physicians (PCPs) in the middle of this range.
Documenting practice ownership by health systems remains important to informing policies to guide primary care transformation. There is robust evidence suggesting adverse impacts of physician‐hospital integration on prices, 11 , 12 , 13 utilization, 14 , 15 , 16 and quality. 17 , 18 Studies also suggest PCPs affiliated with health systems may have poorer performance on key primary care quality indicators 19 , 20 including care fragmentation. 21 As PCP‐hospital integration plays a significant role in US health care, it is imperative that researchers leverage the most accurate sources of information available to measure both levels and changes in integration to inform policy.
In this methods brief, we compare estimates of PCP‐hospital integration across three commonly used data sets. Most studies on this topic construct a measure of integration using either (1) the American Hospital Association (AHA) annual hospital survey 22 ; (2) proprietary databases of physician‐level data maintained by IQVIA (SK&A, OneKey) that cover most office‐based physicians 23 ; or (3) Medicare claims data leveraging differences in hospital outpatient vs. physician office site‐of‐service billing. There are tradeoffs to using each of these data sets as they each produce differing estimates of physician‐hospital integration. One study found a 4‐percentage point discrepancy in the self‐reported ownership status of physicians between AHA and SK&A data. 23 Another study recommended using Medicare claims because they are, “arguably the safest, since it provides a physician‐level measure where there is strong incentive for providers to accurately indicate the site of service”. 24
Accordingly, researchers have leveraged Medicare claims to measure the degree of physician‐hospital integration in a market. Due to longstanding regulations guiding the Medicare Outpatient Prospective Payment System (OPPS), services provided at hospital outpatient departments (HOPDs) have been reimbursed at a higher rate compared to physician owned outpatient practice sites. This is because physicians billing from an office were paid based on the Physician Fee Schedule (PFS), while physician services provided in HOPDs were reimbursed with separate PFS professional and OPPS facility payments for the different components of service expenses. The sum of the HOPD plus professional service payments have historically been higher than the PFS payments alone, providing a strong financial inducement for hospitals to acquire physician groups (and practice sites), and to shift Medicare physician billing to the HOPD site of service.
Billing from an HOPD implies integration because HOPD status requires the owning hospital to have both financial responsibility and administrative control over support staff and the technological infrastructure at the site. 25 Thus, practices that send physicians to an HOPD practice site cannot directly control the setting or the staff at that location. This suggests that health systems and the physician practices that bill from HOPDs are responding to the strong financial incentives and ceding control of the other facilitators of physician work to integrate with a hospital. 7
Numerous studies have used this site‐of‐service differential in billing to measure physician‐integration for outpatient care, 15 , 26 cardiology, 27 gastroenterology, 18 post‐acute care, 28 and oncology. 29 , 30 It is important to note that while HOPD billing can be a strong indicator of integration, if a practice site is more than 35 miles away from the main campus of a hospital, the site cannot bill as an HOPD. So, the absence of HOPD billing does not exclude the possibility that a physician practice site is integrated with a hospital system. Furthermore, regulatory changes may render HOPD billing a less reliable indicator of integration, at least for PCPs. In the Balanced Budget Act of 2015, 31 the Centers for Medicare and Medicaid Services (CMS) was directed to align payment rates more closely between HOPDs and freestanding offices thus reducing the financial benefits of acquiring practice sites and billing under an HOPD. There has been a phased reduction in payment rates under this bill; starting in 2017, all new HOPDs received lower payment for services but existing HOPDs continued to receive higher rates. By January 2019, the financial advantage for all off‐campus HOPDs billing primary care visits was greatly reduced, and finally eliminated by January 2020. 32 Despite litigation by the American Hospital Association, the D.C. Circuit Court sided with CMS and allowed them to adopt site‐neutral payments for all E&M visits at off‐campus HOPDs in 2020. 33 , 34 , 35
Comprehensive Primary Care Plus (CPC+) is the largest voluntary primary care Medicare payment and service delivery model designed to improve the quality and coordination of primary care. One in five practices in the U.S. where primary care was ≥40% of Medicare FFS services applied to CPC+, and 15% participated in the model. 36 The CPC+ evaluation has collected a rich set of data including IQVIA SK&A data, Medicare claims, and practice surveys. Using these diverse data sources, we were able to compare the rates of primary care practice ownership by health systems calculated from each data source over several years.
2. METHODS
We compare the integration status of 2610 CPC+ participating practices across three different data sources from 2017–2020 practice surveys, IQVIA, and Medicare claims. Appendix Table A1 shows various characteristics of primary care practices that did and did not apply to the CPC+ model located in similar regions; for example, CPC+ applicant practices were larger and had a smaller percentage of dually eligible patients.
Details about the files, years studied, and identification of integration used for each data set (e.g. exact wording of the survey responses used, and methodology in claims) are also included below. We also examine how commonly a newly integrated practice (as defined by the practice surveys and SK&A/OneKey) was identified as integrated through claims data.
CPC+ practice surveys: These surveys were sent to all CPC+ participant practice sites from 2017–2019. The response rate for these surveys was 99% in 2017, 97% in 2018, and 95% in 2019. Table 1 shows the survey questions and response categories regarding health system ownership of PCP practice sites.
TABLE 1.
This table provides the wording of the question, possible answers, and specific answer that we use to define vertical integration in the Comprehensive Primary Care Plus (CPC+) practice surveys.
| Years | Question | Vertically integrated system definition | Possible answers |
|---|---|---|---|
| 2017 | Which one of the following best describes the organization that employs the physicians at this practice site? | Hospital, hospital system, or medical school. | (1) Independent physician‐owned (2) Group‐ or staff‐model HMO (3) Hospital, hospital system, or medical school (4) Health insurance company (5) Community health center or clinic (6) Other. |
| 2018–2019 | Which one of the following best describes the organization that employs the physicians at this practice site? | Hospital, hospital system, or medical school” or Co‐owned by a group of practitioners and a hospital, hospital system, or medical school. | (1) Solely owned by 1 to 9 practitioners and/or non‐practitioners (2) Solely owned by 10 or more practitioners and/or non‐practitioners (3) Co‐owned by a group of practitioners and a hospital, hospital system, or medical school (4) Hospital, hospital system, or medical school (5) HMO – group or staff model (6) Health insurance company (7) Community health center or clinic (8) Other |
IQVIA data: We examine data from two different IQVIA data sources (SK&A and OneKey) from 2017–2020 for the set of 2610 CPC+ practices. These data rely on responses from staff contacted at the practice sites who may be more reliable reporting affiliations for themselves than for physicians working at their site. The specific variable reported by SK&A was, “Practice is owned or managed by a health system or owned by a hospital.” In 2019 IQVIA ceased maintaining the separate SK&A outpatient provider database, switching to OneKey (which encompasses SK&A outpatient clinicians but is intended to include information on a broader array of providers). The equivalent definition in OneKey was if the corporate parent of the practice site was classified as either an “Integrated Delivery Network,” or a “Corporate Owner.” While there were some discrepancies regarding physician counts between the SK&A and OneKey data sources, 37 the two data sets produced largely comparable estimates of practice integration. The reporting in OneKey invokes a broader definition of integration than that of the practice surveys as it also includes sites that are “managed” by systems. While this may represent an upper bound for estimating practice integration, this variable has been widely used in vertical integration research. 8 , 23
Medicare Claims: Using Medicare Carrier claims from 2017–2020, we classified all 2610 CPC+ practice sites as being system‐affiliated if most of the evaluation and management (E&M) claims incurred at the practice site were billed from a provider‐based facility (i.e., billed from an HOPD). More specifically, we create a ratio for each practice site‐month combination. The numerator includes the sum of all the claims incurred at the practice site and billed under the place of service (POS) codes “19” for off‐campus outpatient department, and “22” for on‐campus outpatient department. For the denominator, we sum up all the E&M claims incurred at the practice site under POS code “11” for physician office, “19”, and “22”. We then produce this ratio for each practice site and month. We then translated the monthly ratios to annual ones. If the average of the HOPD E&M claims to total E&M claims ratio in a year was greater than 0.5, then. we classify the practice site as being system affiliated. We thus create a binary flag to indicate integration based on this methodology for every practice site‐year.
As noted above, multi‐site groups affiliated with systems may have sites too distant from the hospital campus to allow HOPD billing. Nonetheless some prior research focused on billing TINs and NPIs rather than specific practice sites. CPC+ was a practice site level intervention, necessitating data specific to individual practices sites used by PCPs. Prior studies have also applied different HOPD billing thresholds to define vertical integration, ranging from 100% of claims billed, 14 to 90% 18 to thresholds as low as >50%. 29 Since we know some of the observed PCPs in CPC+ practice sites also served other locations, we used the >50% threshold to maximize the chance of identifying a practice site as an HOPD. We also present sensitivity analyses using higher thresholds for HOPD billing (>75%, >90%) in Figure 1.
FIGURE 1.
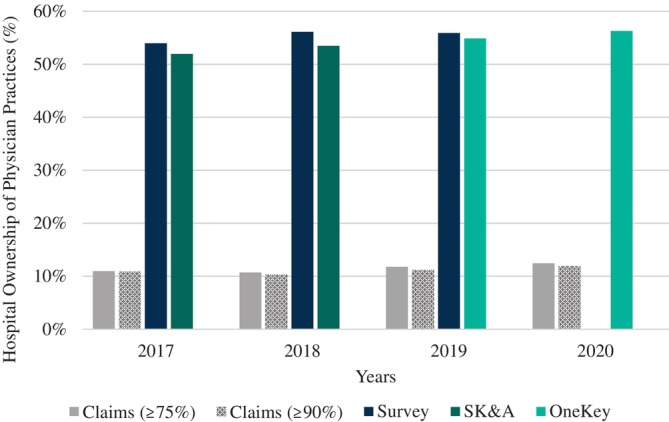
This figure provides estimates for vertical integration for Comprehensive Primary Care Plus (CPC+) participating practices from Medicare Carrier claims (2017–2020), practice surveys (2017–2019), IQVIA SK&A (2017–2018), and IQVIA OneKey (2019–2020). In medical claims, a practice is defined as being vertically integrated if >75%, or >90% of the evaluation & management claims were billed under a hospital outpatient department place of service in a year. In the practice surveys, and IQVIA data, we used the responses from the practice sites regarding ownership to categorize the sites as being integrated.
3. RESULTS
Figure 2 displays the results from comparing estimates of integration across the three data sources for the same set of CPC+ practices. In 2017, 11% of CPC+ practice sites had PCPs billing as an HOPD in Medicare claims. Compared to this, SK&A data indicated 52% and surveys indicated that 54% of CPC+ practice sites were integrated. The 2017 CPC+ practice survey and SK&A data provided similar rates of health system ownership; (t‐test comparing differences in means found no statistical difference: 0.4%, 95% C.I. −0.8% to 1.7%, p = 0.53). However, when we conduct a t‐test to compare the difference in means between these two data sets and the claims data, we find that they are statistically higher than claims (Practice Survey: 43.3%, 41.3% to 45.1%, p < 0.0001; SK&A: 43.5%, 45.3% to 51.1%, p < 0.0001). This gap between rates of integration observed between claims and the other data sources persists during 2018–2020 and the magnitude of the gap remains similar across all four study years. By 2019, 12% of practice sites had PCPs billing as HOPDs in claims. In contrast more than 56% of practice sites were identified by the CPC+ practice surveys as being system affiliated. Once again, the t‐test that compares the difference in means between claims and the other two data sources found that they were statistically different (Practice Survey: 47.1%, 95% C.I. 45.1% to 49.0%, p < 0.0001; OneKey). The switch from SK&A to OneKey data yielded relatively comparable estimates for health system ownership of CPC+ practice sites—55% in 2019 and 56% in 2019 and 2020, respectively (CPC+ practice site surveys were not conducted in 2020). Similarly, we find in 2019 that there is no statistical difference in the means for vertical integration between the CPC+ practice survey and OneKey data (0.2%, 95% C.I. −0.8% to 1.3%, p = 0.71).
FIGURE 2.
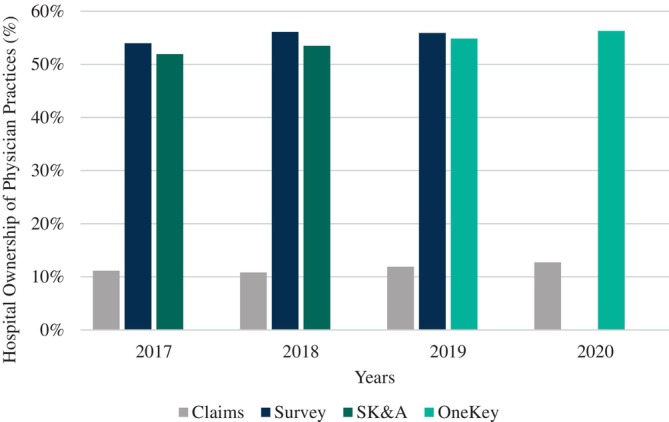
This figure provides estimates for vertical integration for Comprehensive Primary Care Plus (CPC+) participating practices from Medicare Carrier claims (2017–2020), practice surveys (2017–2019), IQVIA SK&A (2017–2018), and IQVIA OneKey (2019–2020). In medical claims, a practice is defined as being vertically integrated if the majority (>50%) of the evaluation & management claims were billed under a hospital outpatient department place of service in a year. In the practice surveys, and IQVIA data, we used the responses from the practice sites regarding ownership to categorize the sites as being integrated.
We found a 1.6 percentage point (p.p.) increase or 14.5% relative increase in the percentage of practices affiliated with health systems using the claims method from 2017 to 2020. By comparison, we found a 1.9 p.p. increase in the practice survey from 2017–2020 (a 3.6% relative increase). The relative change is smaller in the survey because it is calculated using a larger denominator. Finally, the IQVIA data reveal a relative increase in integration of 4.4 p.p. which translates to an 8.3% relative increase (more than double that of the practice survey). As the IQVIA data changed from SK&A to OneKey during the study period, these results are likely reflective of an upper bound estimate.
We separately assessed the degree to which Medicare billing from HOPDs identifies “newly integrated” practices, that is, practices that were reported as not being integrated in one year but were in the next. From the surveys we find 116 newly integrated practices in 2018, and 53 in 2019. Of these, 5 practices met criteria for billing as a HOPD in 2018, and 3 in 2019. Using SK&A data, there were 55 newly integrated practices in 2018; none met the HOPD billing criteria.
4. DISCUSSION
In our analysis of CPC+ data, we find that as of 2017, Medicare PCP visit billing from HOPDs only identifies a small proportion of all CPC+ practice sites reported in the surveys to be integrated with hospital systems. Other data sources document substantially more practice sites acquired by systems than can be detected through analysis of Medicare claims. Very few “newly‐integrated” practices billed as HOPDs supporting our concern that recent regulatory changes may render HOPD billing a less reliable indicator of PCP‐hospital integration.
CPC+ practice sites represent 15% of primary care practices in participating regions, limiting generalizability to PCP practices nationwide. Additionally, as our data begin in 2017, we cannot draw conclusions about trends in site‐of‐service billing before this year.
Policy makers presently have limited sources of information to document these affiliations, with no current authoritative source of information on hospital ownership of physician practices. For example, reporting of hospital ownership of physician practices in the Medicare Provider Enrollment, Chain, and Ownership System (PECOS) 38 has not been transparent. Accordingly, in constructing the files for the AHRQ Compendium of US Health Systems, we observed that it is uncommon for physician practice organizations identified using the Taxpayer Identification Number (TIN) to be reflected in PECOS as technically “owned” by a hospital (i.e., physician TIN reported under a hospital CMS Certification Number). 39 We also found that a practice site affiliation with a health system in the OneKey IQVIA data did not always reflect alignment of the relevant physician TIN with a specific health system. Finally, the use of self‐reported data from proprietary data sets or through surveys is expensive.
Interestingly, Compendium analyses (using 2018 Medicare claims) found most TINs affiliated with health systems had some clinicians billing from hospital outpatient facilities. 39 Many of these TINs were larger, multispecialty organizations, however, where financial advantages persist for billing specialized services from HOPDs. Financial advantages also remain for primary care physicians billing from an on‐campus HOPDs. However, because primary care physicians are typically located relatively close to the patients they serve, it is unlikely that there are large opportunities for health systems to substantially grow on‐campus primary care capabilities.
In conclusion, we find that research studying recent changes in PCP‐hospital integration cannot rely on HOPD billing reflected in Medicare claims as a reliable marker of integration. Our analyses focused on primary care practice sites; current Medicare regulations retain various opportunities for physicians to bill specialized, non‐visit services with higher HOPD facility payments. Further research will be required to assess the implications of changing patterns of HOPD billing for research on integration across various categories of specialist physicians.
FUNDING INFORMATION
Supported by the U.S. Department of Health and Human Services, Centers for Medicare and Medicaid Serices: HHSM‐500‐2014‐00034I/HHSM‐500‐T0010.
IRB
The New England Institutional Review Board (IRB) granted the initiative an IRB exemption based on the federal common rule (§45 CFR 46.101[b][5]), because the study’s purpose was to evaluate a public benefit program. The CMS model team designed and administered the model.
ACKNOWLEDGEMENTS
We would like to thank our Mathematica colleagues that worked on the Comprehensive Primary Care Plus and the Primary Care First evaluations.
APPENDIX A.
TABLE A1.
This table is adapted from the analysis done in (33). This table compares characteristics of primary care practices located in similar regions that did and did apply for the Comprehensive Primary Care Plus (CPC+) model.
| Characteristic | CPC+ applicants (n = 4346) | CPC+ nonapplicants (n = 12,537) | p‐value |
|---|---|---|---|
| Practice size | |||
| Total number of practitioners (any specialty), median (IQR) | 3.0 (2.0–6.0) | 2.0 (1.0–3.0) | <0.001 |
| Number of primary care practitioners, median (IQR) | 3.0 (2.0–5.0) | 1.0 (1.0–3.0) | <0.001 |
| Practice size | |||
| Large (>6 primary care practitioners), % (95% C.I.) | 23.2 (22.0–24.5) | 8.1 (7.6–8.6) | <0.001 |
| Medium (3–5 primary care practitioners), % (95% C.I.) | 36.2 (34.8–37.6) | 20.5 (19.8–21.2) | <0.001 |
| Small (1–2 primary care practitioners), % (95% C.I.) | 40.5 (39.1–42.0) | 71.4 (70.6–72.2) | <0.001 |
| Number of attributed Medicare FFS beneficiaries at baseline, median (IQR) | 410 (231–740) | 155 (55–311) | <0.001 |
| Number of attributed Medicare FFS beneficiaries at baseline per PCP, median (IQR) | 144 (89–214) | 99 (32–183) | <0.001 |
| Practice county characteristics | |||
| Rural location, % (95% C.I.) | 8.6 (7.7–9.4) | 14.4 (13.8–15.0) | <0.001 |
| Suburban location, % (95% C.I.) | 14.8 (13.8–15.9) | 14.4 (13.8–15.0) | 0.469 |
| Urban location, % (95% C.I.) | 76.6 (75.3–77.9) | 71.2 (70.4–72.0) | <0.001 |
| Demographics at baseline | |||
| Age | <0.001 | ||
| 0–49, % (95% C.I.) | 6.0 (5.8–6.2) | 7.8 (7.6–8.0) | <0.001 |
| 50–64, % (95% C.I.) | 13.1 (12.9–13.4) | (15.8–16.3) | <0.001 |
| 65–74, % (95% C.I.) | 45.3 (45.0–45.6) | 43.0 (42.8–43.3) | <0.001 |
| 75–84, % (95% C.I.) | 24.1 (23.9–24.3) | 22.3 (22.1–22.5) | <0.001 |
| ≥ 85, % (95% C.I.) | 11.5 (11.3–11.7) | 10.8 (10.6–11.0) | <0.001 |
| Male, % (95% C.I.) | 41.6 (41.4–41.9) | 42.7 (42.4–42.9) | <0.001 |
| Race | |||
| Black, % (95% C.I.) | 8.5 (8.1–9.0) | 13.2 (12.9–13.6) | <0.001 |
| White, % (95% C.I.) | 84.3 (83.7–84.9) | 78.6 (78.2–79.1) | <0.001 |
| Other, % (95% C.I.) | 7.2 (6.8–7.6) | 8.1 (7.8–8.4) | <0.001 |
| Dually eligible for Medicare and Medicaid, % (95% C.I.) | 17.0 (16.6–17.5) | 23.4 (23.0–23.8) | <0.001 |
Note: The table includes 16,883 of the 19,809 primary care practices in the 2017 and 2018 regions because 2926 practices that had no attributed Medicare fee for service beneficiaries in the baseline year were excluded. The baseline year is 2016 for the 2017 starters and 2017 for the 2018 starters. The urbanicity of a practice's county (rural, urban, suburban) is derived from the 2013 rural–urban continuum codes (https://www.ers.usda.gov/ data‐products/rural–urban‐continuum‐codes/documentation/) available in the Area Resource Files for both 2017 and 2018 starters. The race variables are based on the Medicare enrollment database.
Chatrath S, Rich EC, O'Malley AS, Cohen G, Jones DJ. Hospital outpatient department billing is a poor indicator of primary care practice integration with hospital systems. Health Serv Res. 2024;59(2):e14284. doi: 10.1111/1475-6773.14284
REFERENCES
- 1. Beaulieu ND, Chernew ME, McWilliams JM, et al. Organization and performance of US health systems. JAMA. 2023;329(4):325‐335. doi: 10.1001/jama.2022.24032 [DOI] [PubMed] [Google Scholar]
- 2. Casalino LP. Health systems—the present and the future. JAMA. 2023;329(4):293‐294. doi: 10.1001/jama.2022.24141 [DOI] [PubMed] [Google Scholar]
- 3. Kocher R, Sahni NR. Hospitals' race to employ physicians—the logic behind a money‐losing proposition. N Engl J Med. 2011;364(19):1790‐1793. doi: 10.1056/NEJMp1101959 [DOI] [PubMed] [Google Scholar]
- 4. Gaynor M, Mostashari F, Ginsburg PB. Making health care markets work: competition policy for health care. JAMA. 2017;317(13):1313. doi: 10.1001/jama.2017.1173 [DOI] [PubMed] [Google Scholar]
- 5. O'Malley AS, Bond AM, Berenson RA. Rising hospital employment of physicians: better quality costs. Center for Studying Health Systems Change? 2011;(136):5. [PubMed] [Google Scholar]
- 6. Reschovsky JD, Rich E. Hospital Acquisition of Physician Groups: on the road to value‐based or higher‐priced care? JAMA Intern Med. 2015;175(12):1939‐1941. doi: 10.1001/jamainternmed.2015.6183 [DOI] [PubMed] [Google Scholar]
- 7. Burns LR, Goldsmith JC, Sen A. Horizontal and vertical integration of physicians: a tale of two tails. In: Goes J, Savage GT, Friedman L, eds. Advances in Health Care Management. Vol 15. Emerald Group Publishing Limited; 2013:39‐117. doi: 10.1108/S1474-8231(2013)0000015009 [DOI] [PubMed] [Google Scholar]
- 8. Colla C, Yang W, Mainor AJ, et al. Organizational integration, practice capabilities, and outcomes in clinically complex Medicare beneficiaries. Health Serv Res. 2020;55(Suppl 3):1085‐1097. doi: 10.1111/1475-6773.13580 [DOI] [PMC free article] [PubMed] [Google Scholar]
- 9. Machta RM, D Reschovsky J, Jones DJ, Kimmey L, Furukawa MF, Rich EC. Health system integration with physician specialties varies across markets and system types. Health Serv Res. 2020;55(Suppl 3):1062‐1072. doi: 10.1111/1475-6773.13584 [DOI] [PMC free article] [PubMed] [Google Scholar]
- 10. Nikpay SS, Richards MR, Penson D. Hospital‐physician consolidation accelerated in the past decade in cardiology, oncology. Health Affairs. 2018;37(7):1123‐1127. doi: 10.1377/hlthaff.2017.1520 [DOI] [PubMed] [Google Scholar]
- 11. Ciliberto F, Dranove D. The effect of physician–hospital affiliations on hospital prices in California. J Health Econ. 2006;25(1):29‐38. doi: 10.1016/j.jhealeco.2005.04.008 [DOI] [PubMed] [Google Scholar]
- 12. Baker LC, Bundorf MK, Kessler DP. Vertical integration: hospital ownership of physician practices is associated with higher prices and spending. Health Aff. 2014;33(5):756‐763. doi: 10.1377/hlthaff.2013.1279 [DOI] [PubMed] [Google Scholar]
- 13. Capps C, Dranove D, Ody C. The effect of hospital acquisitions of physician practices on prices and spending. J Health Econ. 2018;59:139‐152. doi: 10.1016/j.jhealeco.2018.04.001 [DOI] [PubMed] [Google Scholar]
- 14. Koch TG, Wendling BW, Wilson NE. How vertical integration affects the quantity and cost of care for Medicare beneficiaries. J Health Econ. 2017;52:19‐32. doi: 10.1016/j.jhealeco.2016.12.007 [DOI] [PubMed] [Google Scholar]
- 15. Neprash HT, Chernew ME, Hicks AL, Gibson T, McWilliams JM. Association of financial integration between physicians and hospitals with commercial health care prices. JAMA Intern Med. 2015;175(12):1932‐1939. doi: 10.1001/jamainternmed.2015.4610 [DOI] [PubMed] [Google Scholar]
- 16. Ho V, Metcalfe L, Vu L, Short M, Morrow R. Annual spending per patient and quality in hospital‐owned versus physician‐owned organizations: an observational study. J Gen Intern Med. 2020;35(3):649‐655. doi: 10.1007/s11606-019-05312-z [DOI] [PMC free article] [PubMed] [Google Scholar]
- 17. Carlin CS, Dowd B, Feldman R. Changes in quality of health care delivery after vertical integration. Health Serv Res. 2015;50(4):1043‐1068. doi: 10.1111/1475-6773.12274 [DOI] [PMC free article] [PubMed] [Google Scholar]
- 18. Song L, Saghafian S, Newhouse JP, Landrum MB, Hsu J. The impact of vertical integration on physician behavior and healthcare delivery: evidence from gastroenterology practices. SSRN J. 2020. doi: 10.2139/ssrn.3704941 [DOI] [PMC free article] [PubMed] [Google Scholar]
- 19. Timmins L, Kern LM, Ghosh A, Urato C, Rich E. Predicting fragmented care: beneficiary, physician, practice, and market characteristics. Med Care. 2022;60(12):919‐930. doi: 10.1097/MLR.0000000000001786 [DOI] [PubMed] [Google Scholar]
- 20. Rich EC, Peris K, Luhr M, Ghosh A, Molinari L, O'Malley AS. Association of the range of outpatient services provided by primary care physicians with subsequent health care costs and utilization. J Gen Intern Med. 2023;38:3414–3423. doi: 10.1007/s11606-023-08363-5 [DOI] [PMC free article] [PubMed] [Google Scholar]
- 21. Jones D, Barna M, Rich E, Rittenhouse D. Vertical integration of primary care group practices with health systems, impacts on cost and quality of care. AcademyHealth. 2023. Accessed August 16, 2023. https://academyhealth.confex.com/academyhealth/2023arm/meetingapp.cgi/Paper/60940 [Google Scholar]
- 22. AHA Annual Survey Database™|AHA Data. Accessed December 28, 2022. https://www.ahadata.com/aha-annual-survey-database
- 23. Baker LC, Bundorf MK, Devlin AM, Kessler DP. Hospital ownership of physicians: hospital versus physician perspectives. Med Care Res Rev. 2018;75(1):88‐99. doi: 10.1177/1077558716676018 [DOI] [PubMed] [Google Scholar]
- 24. Post B, Buchmueller T, Ryan AM. Vertical integration of hospitals and physicians: economic theory and empirical evidence on spending and quality. Med Care Res Rev. 2018;75(4):399‐433. doi: 10.1177/1077558717727834 [DOI] [PubMed] [Google Scholar]
- 25. CMS Manual System: Chapter 2 “The Certification Process.” HHS. 2010.
- 26. Dranove D, Ody C. Employed for higher pay? How Medicare payment rules affect hospital employment of physicians. Am Econ J. 2019;11(4):249‐271. doi: 10.1257/pol.20170020 [DOI] [Google Scholar]
- 27. Song Z, Wallace J, Neprash HT, McKellar MR, Chernew ME, McWilliams JM. Medicare fee cuts and cardiologist‐hospital integration. JAMA Intern Med. 2015;175(7):1229‐1231. doi: 10.1001/jamainternmed.2015.2017 [DOI] [PMC free article] [PubMed] [Google Scholar]
- 28. Konetzka RT, Stuart EA, Werner RM. The effect of integration of hospitals and post‐acute care providers on Medicare payment and patient outcomes. J Health Econ. 2018;61:244‐258. doi: 10.1016/j.jhealeco.2018.01.005 [DOI] [PMC free article] [PubMed] [Google Scholar]
- 29. Clough JD, Dinan MA, Schulman KA. Trends in hospital‐physician integration in medical oncology. Am J Manag Care. 2017;23(10):624‐627. [PubMed] [Google Scholar]
- 30. Desai S, McWilliams JM. Consequences of the 340B drug pricing program. N Engl J Med. 2018;378(6):539‐548. doi: 10.1056/NEJMsa1706475 [DOI] [PMC free article] [PubMed] [Google Scholar]
- 31. Meehan P. Text—H.R.1314—114th Congress (2015‐2016): Bipartisan Budget Act of 2015. 2015. Accessed January 4, 2023. http://www.congress.gov/
- 32. Snow D, Wink L, Tankersley R, Krause J. CMS Finalizes Several Changes for Off‐Campus Provider‐Based Clinics | Hall Render. Law Firm | Health Care Law Firm in the USA | Hall Render. Published November 12. 2018. Accessed January 10, 2023. https://www.hallrender.com/2018/11/12/cms-finalizes-several-changes-for-off-campus-provider-based-clinics/
- 33. Kraus E, Paddock M, Thompson T. Site‐neutral payments stand: D.C. court of appeals overturns ruling and allows lower payments to off‐campus provider‐based departments. Healthcare Law Blog. Published July 23, 2020. Accessed August 15, 2023. https://www.sheppardhealthlaw.com/2020/07/articles/healthcare‐law/site‐neutral‐payments/ [Google Scholar]
- 34. Fayed R, Lutz H, Weinrich G. DC circuit sides with CMS in lawsuit challenging site‐neutral payment rule. Dentons Law. 2020; Accessed August 15, 2023. https://www.dentons.com/en/insights/newsletters/2020/july/20/dc‐circuit‐sides‐with‐cms‐in‐lawsuit‐challenging‐site‐neutral‐payment‐rule [Google Scholar]
- 35. June 2022 Report to the Congress: Medicare and the Health Care Delivery System—MedPAC. 2022. Accessed August 16, 2023. https://www.medpac.gov/document/june‐2022‐report‐to‐the‐congress‐medicare‐and‐the‐health‐care‐delivery‐system/
- 36. Singh P, Orzol S, Peikes D, Oh EG, Dale S. Participation in the comprehensive primary care plus initiative. Ann Fam Med. 2020;18(4):309‐317. doi: 10.1370/afm.2544 [DOI] [PMC free article] [PubMed] [Google Scholar]
- 37. Maurer KA, Blue L, Orzol S, Morrison Hensleigh N, Peikes D. Measuring physician practice site characteristics: a comparison of data from SK&a and a practice site survey. Health Serv Res. 2021;56(2):334‐340. doi: 10.1111/1475-6773.13601 [DOI] [PMC free article] [PubMed] [Google Scholar]
- 38. Ridgely MS, Damberg CL, Totten M, Escarce JJ. The perils of PECOS: using Medicare administrative data to answer important policy questions about health care markets. Health Affairs Forefront. 2021. Accessed February 7, 2023. doi: 10.1377/forefront.20201222.615286/full/ [DOI] [Google Scholar]
- 39. Compendium of U.S. Health Systems Technical Documentation . Agency for Healthcare Research and Quality. 2018. Accessed January 10, 2023. https://www.ahrq.gov/chsp/data-resources/compendium-2018.html