Abstract
Objective
There is an ongoing debate about whether the management of gastroenteropancreatic (GEP) neuroendocrine carcinoma (NEC) should follow the guidelines of small-cell lung cancer (SCLC). We aim to identify the genetic differences of GEPNEC and its counterpart.
Methods
We recruited GEPNEC patients as the main cohort, with lung NEC and digestive adenocarcinomas as comparative cohorts. All patients undergone next-generation sequencing (NGS). Different gene alterations were compared and analyzed between GEPNEC and lung NEC (LNEC), GEPNEC and adenocarcinoma to yield the remarkable genes.
Results
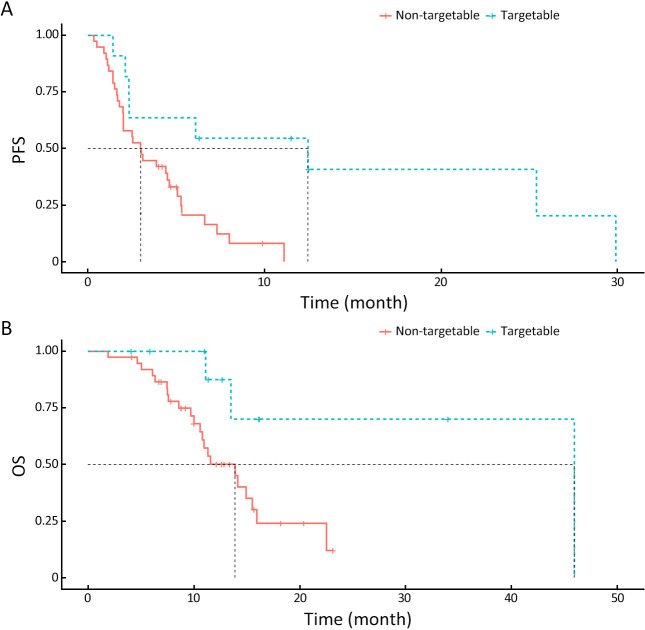
We recruited 257 patients, including 99 GEPNEC, 57 LNEC, and 101 digestive adenocarcinomas. Among the mutations, KRAS, RB1, TERT, IL7R, and CTNNB1 were found to have different gene alterations between GEPNEC and LNEC samples. Specific genes for each site were revealed: gastric NEC ( TERT amplification), colorectal NEC ( KRAS mutation), and bile tract NEC ( ARID1A mutation). The gene disparities between small-cell NEC (SCNEC) and large-cell NEC (LCNEC) were KEAP1 and CDH1. Digestive adenocarcinoma was also compared with GEPNEC and suggested RB1, APC, and KRAS as significant genes. The TP53/ RB1 mutation pattern was associated with first-line effectiveness. Putative targetable genes and biomarkers in GEPNEC were identified in 22.2% of the patients, and they had longer progression-free survival (PFS) upon targetable treatment [12.5 months vs. 3.0 months, HR=0.40 (0.21−0.75), P=0.006].
Conclusions
This work demonstrated striking gene distinctions in GEPNEC compared with LNEC and adenocarcinoma and their clinical utility.
Keywords: Neuroendocrine carcinoma, gastroenteropancreatic, lung, genetic alterations, molecular markers
Introduction
Poorly differentiated gastroenteropancreatic (GEP) neuroendocrine carcinoma (NEC), a more aggressive form of neuroendocrine neoplasms (NENs), is gaining much attention ( 1). The annual incidence rate is 0.54 per million people, but over two-thirds of GEPNEC is accompanied by disseminated disease, which always has a poor prognosis ranging from 5 to 14 months (metastatic disease). With very few studies on the carcinogenic mechanisms associated with GEPNEC, treatment options are scarce and mainly comply with small-cell lung cancer (SCLC) according to the morphological similarities ( 2). However, a comparative study of lung and extrapulmonary NEC using the Surveillance, Epidemiology, and End Results (SEER) database revealed tremendous clinical disparities ( 3).
Gene sequencing approaches have discovered the relationship among lung NECs (LNECs) [SCLC and lung large-cell neuroendocrine carcinoma (LLCNEC)]. Accumulating data support the use of genomic approaches to differentiate GEPNEC from local adenocarcinoma ( 3). However, the genomic profile of GEPNEC remains poorly investigated due to its rarity. Puccini et al. suggested that TP53, RB1, and KRAS were the most commonly altered genes ( 4). Venizelos et al. delineated the currently largest sample size molecular analyses of high-grade GEPNENs. This study showed a significant difference between NET G3 and NEC and substantial differences among different primary sites, confirming the results of the present study ( 5). Yachida et al. depicted the most comprehensive molecular landscape of high-grade GEP of unknown origins ( 6), demonstrating higher frequencies of TP53, RB1, and KRAS genomic alterations in NEC compared with local G3 NET (ATRX/DAXX mutations) ( 4, 7, 8). Other small-sample studies provided molecular features of GEPNEC of various anatomical sites and revealed KRAS, BRAF, and PI3KCA as targetable genes ( 7, 9- 22). However, these studies are predominantly based on data from Caucasian populations, and there is a lack of genomic information on GEPNEC in the Chinese population.
Current guidelines recommend treating GEPNEC following the steps for SCLC. However, emerging studies on specific sites, such as colorectal NEC (CRNEC) and pancreatic NEC (PNEC), suggest treatments that resemble local adenocarcinoma treatments, implying that other therapies may be utilized in these cases ( 16, 18). Nevertheless, no direct comparisons have been made between GEPNEC and their lung counterparts or adenocarcinoma.
We aimed to elucidate the genetic characteristics of GEPNEC by comparing them with LNEC and local adenocarcinoma using targeted next-generation sequencing (NGS) and further identify the distinct landscapes of GEPNEC in relation to lung NEC (anatomical perspectives) and local adenocarcinoma (pathological perspectives). These findings may help pave the way for novel tailored therapies in future.
Materials and methods
Patients and samples
We retrospectively analyzed NEC patients treated at Peking University Cancer Hospital between January 1, 2016, and December 1, 2020. The main cohort, referred to as GEPNEC, can be separated into the following subgroups: esophagus, gastric, duodenum, colon, rectum, pancreas and biliary tract, and unknown primary NEC, including NEC originating from the liver, mesentery, and peritoneal cavity with suspected digestive system origins. The comparative cohort was comprised of lung NECs (including SCLC and LLCNEC) and digestive adenocarcinomas (primary sites included stomach, colorectum, bile tract, and pancreas). Prior to molecular examination, tumor enrichment formalin-fixed paraffin-embedded (FFPE) tumor samples were obtained by biopsies or harvesting tissue. The FFPE samples were reviewed, and the diagnoses were immunohistochemically (IHC) confirmed by two independent pathologists according to the 2019 5th edition of the World Health Organization Classification of Neuroendocrine Tumors ( 1). Any contradictions were judged by a third expert. Samples misdiagnosed or ambiguously diagnosed (e.g., NET G3), failed quality control, contained no more than 50% tumor cells, or lacked basic clinical information were excluded.
Inclusion criteria for the main cohort included: 1) Pathological diagnosis: it was confirmed as NEC by two independent pathologists according to the 2010 World Health Organization Classification of Neuroendocrine Neoplasms and was judged by a third pathologist when necessary ( 10, 11); 2) it had completed clinical information that could be obtained from the Hospital Information System; and 3) aged 18 years or older. Exclusion criteria included: 1) origins from neither digestive system nor lung; 2) no adequate histological specimens; or 3) no baseline clinical information. We obtained informed consent from all patients in accordance with the ethical guidelines of the Helsinki Declaration. This study protocol was approved by the Institutional Review Boards of Peking University Cancer Hospital (No. 2020YJZ92).
The patients had prospective follow-up visits every six weeks, with radiologic evaluations [based on Response Evaluation Criteria in Solid Tumors version 1.1 (RECIST 1.1)] and laboratory tests. The disease control rate (DCR) was calculated as stable disease (SD), and the objective response was summarized as complete remission (CR) or partial response (PR). Progression-free survival (PFS) was defined as the time from the initiation of each line of therapy to documented progressive disease (PD) or death due to any cause. Overall survival (OS) was defined as the time from the initiation of the therapy to death. If no endpoint was observed at the time of the analysis, the patients were censored at the time of their last follow-up.
NGS-based genomic profiling
DNA was extracted from FFPE specimens obtained from biopsy or surgery and whole blood control samples using QIAamp DNA FFPE Tissue Kit and DNeasy Blood and Tissue kit (Qiagen, Berlin, Germany). Potential artifacts from the FFPE samples were excluded by a strict quality control process. The DNA concentration was measured using a Qubit 3.0 fluorometer (ThermoFisher, Carlsbad, USA). Library construction was performed using 1−2 μg of DNA and a KAPA Hyper Prep kit (KAPA Biosystems, San Diego, USA). DNA libraries were then used to generate target-enriched amplicons using a Geneseeq Prime panel (233 cancer-related genes). Constructed libraries were sequenced using Hiseq 4000 NGS platforms (Illumina, San Diego, USA). The mean sequencing depth arrived at 1,100× and was qualified for the analysis. The experiment was performed in a centralized clinical testing center (Nanjing Geneseeq Technology Inc., Nanjing, China) following the protocol reviewed and approved by the Ethical Committee of Peking University Cancer Hospital.
Data processing
We applied rigorous quality control procedures before further analyses, following the protocols described in the Picard tool ( http://broadinstitute.github.io/picard/). NGS data were aligned to the hg19 reference human genome using the Burrows-Wheeler Aligner (bwa-mem) ( 23) and then were processed using the Picard suite ( https://broadinstitute.github.io/picard/) and the Genome Analysis Toolkit (GATK). MuTect was applied to the paired plasma DNA BAM files to identify somatic single-nucleotide variants ( 24). Small insertions and deletions were detected using Scalpel ( http://scalpel.sourceforge.net). Purity-adjusted gene-level and segment-level copy number variations (CNVs) were calculated using CNV Kit ( 25). The tumor mutation burden (TMB) was defined as the number of non-synonymous mutations per sample that had not been previously described as germline alterations. Targetable genes were annotated and confirmed using the ClinVar database; only gene alterations with current clinical Food and Drug Administration (FDA)-approved potential treatment options or late-phase trials for any cancer were identified.
Statistical analysis
Categorical variables were analyzed by Pearson’s Chi-squared tests and Fisher’s exact test when necessary. Continuous variables were processed by t-tests or analysis of variation (ANOVA). Odds ratios were calculated using univariate or multivariable analyses, with 95% confidence interval (95% CI) depicting the different gene alteration frequencies of patients. False discovery rate (FDR) correction used the Benjamini-Hochberg method to adjust P values, thereby controlling the false positive rate while preserving the statistical power of our tests. Survival plots were performed in the Kaplan-Meier method, while differences within groups were assessed by log-rank tests. R software (Version 3.5.3; R Foundation for Statistical Computing, Vienna, Austria), with “ComplexHeatmap”, “ggstatsplot”, “survival”, “survminer” and “tableone” packages was used for analysis. Statistical significance was defined as a two-sided P value less than 0.05.
Results
Cohort overview and genomic profiling
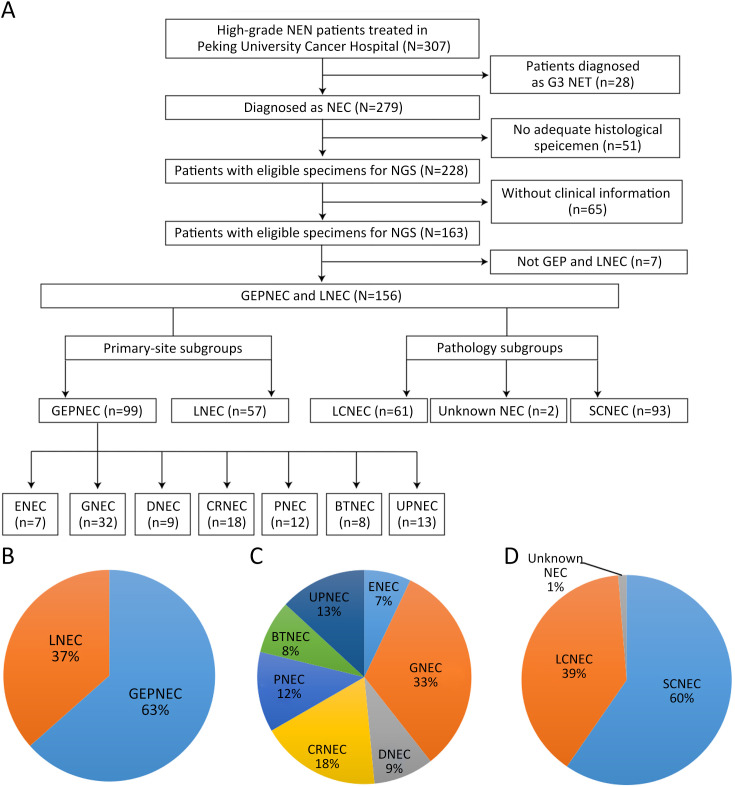
A total of 257 patients meeting the inclusion criteria were included in the genomic analysis, including 99 GEPNEC, 57 lung NEC, and 101 digestive adenocarcinomas. The flowchart of study and basic information are presented in Supplementary Figure S1 . First, we investigated the GEPNEC cohort (n=99). The median age of the cohort was 59.6 years old. Small-cell NEC (SCNEC) accounted for 55 (55.6%) patients. Mixed neuroendocrine-non-neuroendocrine neoplasia (MiNEN) accounted for 17.2% of the patients. The median percentage of positive Ki67 was 75%. Stage IV patients accounted for 81.8%, and an elevated NSE level was observed in 65.7% of the patients. The main difference between GEPNEC and LNEC was the relatively balanced proportion of pathology (P<0.001). The origins can be divided into esophagus NEC (ENEC) (n=7), gastric NEC (GNEC) (n=32), duodenal NEC (DNEC) (n=9), colorectal NEC (CRNEC) (n=18), bile tract NEC (BTNEC) (n=8), pancreatic NEC (PNEC) (n=12), and unknown primary NEC (UPNEC) (n=13). The detailed clinicopathological characteristics of the cohort comparisons are summarized in Table 1 , Supplementary Table S1 . Pathological distinctions are seen in Supplementary Figure S2 .
Figure S1.
Overview of flowchart in study inclusion process and pie charts of basic subgroups of NEC. (A) Flowchart of whole study; (B) Primary tumor sites; (C) Detailed primary tumor sites; (D) Pathology subgroups. NEN, neuroendocrine neoplasm; NET, neuroendocrine tumor; NEC, neuroendocrine carcinoma; GEP, gastroenteropancreatic; LNEC, lung NEC; LCNEC, large-cell NEC; SCNEC, small-cell NEC; ENEC, esophagus NEC; GNEC, gastric NEC; DNEC, duodenum NEC; CRNEC, colorectal NEC; PNEC, pancreas NEC; BTNEC, bile tract NEC; UPNEC, unknown primary NEC.
Table 1. Overall clinical information of GEPNEC and comparative LNEC cohort.
| Characteristics | n (%) | P | |
| GEPNEC
(N=99) |
LNEC
(N=57) |
||
| GEPNEC, gastroenteropancreatic neuroendocrine carcinoma; LNEC, lung NEC; SCNEC, small-cell NEC; LCNEC, large-cell NEC; MiNEN, mixed neuroendocrine-non-neuroendocrine neoplasia; NSE, neuron-specific enolase. #, one NEC patient had difficulty in identifying the small or large cell subtypes; *, we calculated the Ki67 index of NEC component in MiNEN. In most cases (n=12), the Ki67 index of adenocarcinoma component were concordant with that of NEC component. Only 2 MiNEN cases had different Ki67 (median Ki67 for adenocarcinoma was 20% and for NEC was 80%). | |||
Age (year) (
 )
)
|
59.6±12.2 | 61.9±9.8 | 0.054 |
| Gender | |||
| Female | 36 (36.4) | 19 (33.3) | 0.658 |
| Male | 63 (63.6) | 38 (66.7) | |
| Primary sites | − | ||
| Bile duct | 8 (8.1) | − | |
| Colorectum | 18 (18.2) | − | |
| Duodenum | 9 (9.1) | − | |
| Esophagus | 7 (7.1) | − | |
| Stomach | 32 (32.3) | − | |
| Pancreas | 12 (12.1) | − | |
| Unknown primary | 13 (13.1) | − | |
| Lung | − | 57 (100) | − |
| Pathology # | |||
| Undistinguishable | 1 (1.0) | 1 (1.8) | <0.001 |
| LCNEC | 43 (43.4) | 18 (31.6) | |
| SCNEC | 55 (55.6) | 38 (66.7) | |
| Ki67 (%) [Median (IQR)] | 75 (60, 80)* | 80 (70, 90) | 0.072 |
| Mixed component | |||
| MiNEN | 17 (17.2) | 3 (5.3) | 0.032 |
| Pure NEC | 82 (82.8) | 54 (94.7) | |
| Stage | |||
| Stage I−III | 18 (18.2) | 13 (22.8) | 0.234 |
| Stage IV | 81 (81.8) | 44 (77.2) | |
| Metastases | |||
| Liver | 58 (58.6) | 17 (29.8) | 0.061 |
| Lung | 12 (12.1) | − | 0.343 |
| Bone | 9 (9.1) | 9 (15.8) | 0.725 |
| NSE elevation | |||
| No | 34 (34.3) | 17 (29.8) | 0.562 |
| Yes | 65 (65.7) | 40 (70.2) | |
| Smoking | |||
| No | 79 (79.8) | 14 (24.6) | <0.001 |
| Yes | 20 (20.2) | 43 (75.4) | |
Table S1. Comparison of clinical characteristics of GEPNEC and digestive adenocarcinoma.
| Characteristics | n (%) | P | |
| GEPNEC (N=99) | Digestive adenocarcinoma (N=101) | ||
| GEPNEC, gastroenteropancreatic neuroendocrine carcinoma; SCNEC, small-cell NEC; LCNEC, large-cell NEC; MiNEN, mixed neuroendocrine-non-neuroendocrine neoplasia; NSE, neuron-specific enolase. #, one NEC patients had difficulty in identifying small or large cell subtypes. | |||
Age (year) (
 )
)
|
59.6±12.2 | 60.3±11.7 | 0.532 |
| Gender | 0.451 | ||
| Female | 36 (36.4) | 43 (42.6) | |
| Male | 63 (63.6) | 58 (57.4) | |
| Primary sites | − | ||
| Bile duct | 8 (8.1) | 7 (6.9) | |
| Colorectum | 18 (18.2) | 56 (55.4) | |
| Duodenum | 9 (9.1) | − | |
| Esophagus | 7 (7.1) | − | |
| Stomach | 32 (32.3) | 26 (25.7) | |
| Pancreas | 12 (12.1) | 12 (11.9) | |
| Unknown primary | 13 (13.1) | − | |
| Pathology # | − | ||
| Undistinguishable | 1 (1.0) | − | |
| LCNEC | 43 (43.4) | − | |
| SCNEC | 55 (55.6) | − | |
| Adenocarcinoma | − | 101 (100) | |
| Mixed component | − | ||
| MiNEN | 17 (17.2) | − | |
| Pure NEC | 82 (82.8) | − | |
| Stage | <0.001 | ||
| Stage I−III | 17 (17.2) | 61 (60.4) | |
| Stage IV | 82 (82.8) | 40 (39.6) | |
| Metastases | 0.166 | ||
| Liver | 58 (58.6) | 27 (26.7) | |
| Lung | 12 (12.1) | 7 (6.9) | |
| Bone | 9 (9.1) | 3 (3.0) | |
| NSE elevation | <0.001 | ||
| No | 34 (34.3) | 72 (71.3) | |
| Yes | 65 (65.7) | 29 (28.7) | |
| Smoking | 0.446 | ||
| No | 79 (79.8) | 75 (74.3) | |
| Yes | 20 (20.2) | 26 (25.7) | |
Figure S2.
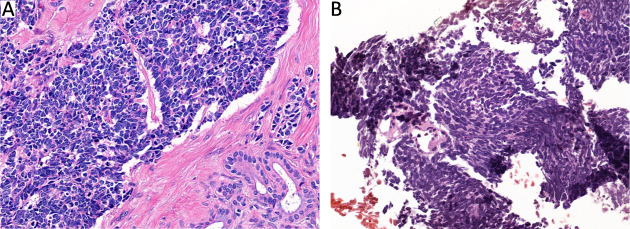
Morphological distinctions between GEPNEC and LNEC. (A) SCNEC of PNEC; (B) SCNEC of lung. GEPNEC, gastroenteropancreatic neuroendocrine carcinoma; LNEC, lung NEC; SCNEC, small-cell NEC; PNEC, pancreatic NEC. Hematoxylin-eosin staining, ×400.
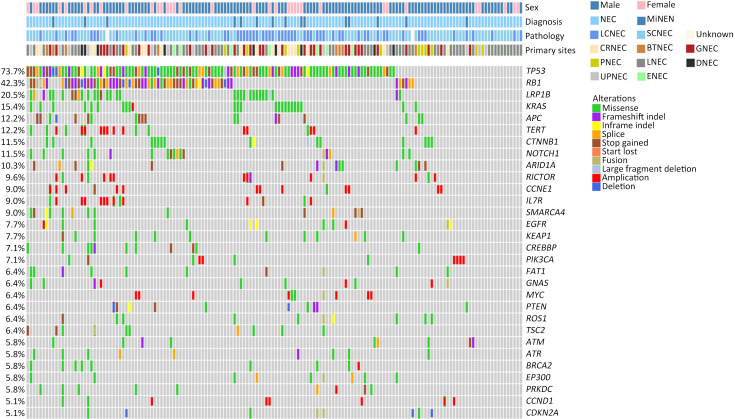
A total of 1,337 alterations were identified (8.57 variants per sample on average, ranging from 1 to 79 variants), including 955 single nucleotide variants (SNVs), 137 insertions and deletions, 183 CNVs, and 62 structure variations (SVs). The top-ranking genes in the whole cohort were TP53, RB1, LRP1B, KRAS, APC, TERT, CTNNB1, and NOTCH1, with prevalence of 73.7 (115/156), 42.3 (66/156), 20.5 (32/156), 15.4 (24/156), 12.2 (19/156) and 12.2 (19/156), 11.5 (18/156), and 11.5 (18/156), respectively ( Figure 1 ).
Figure 1.
Overview of genomic landscape of whole NEC cohort of GEPNEC and LNEC. NEC, neuroendocrine carcinoma; GEP, gastroenteropancreatic; MiNEN, mixed neuroendocrine-non-neuroendocrine neoplasm; LCNEC, large-cell NEC; SCNEC, small-cell NEC; Unknown, unknown pathological types; CRNEC, colorectal NEC; BTNEC, bile tract NEC; GNEC, gastric NEC; PNEC, pancreas NEC; LNEC, lung NEC; DNEC, duodenum NEC; UPNEC, unknown primary NEC; ENEC, esophagus NEC.
Genomic comparison of different primary sites of NEC
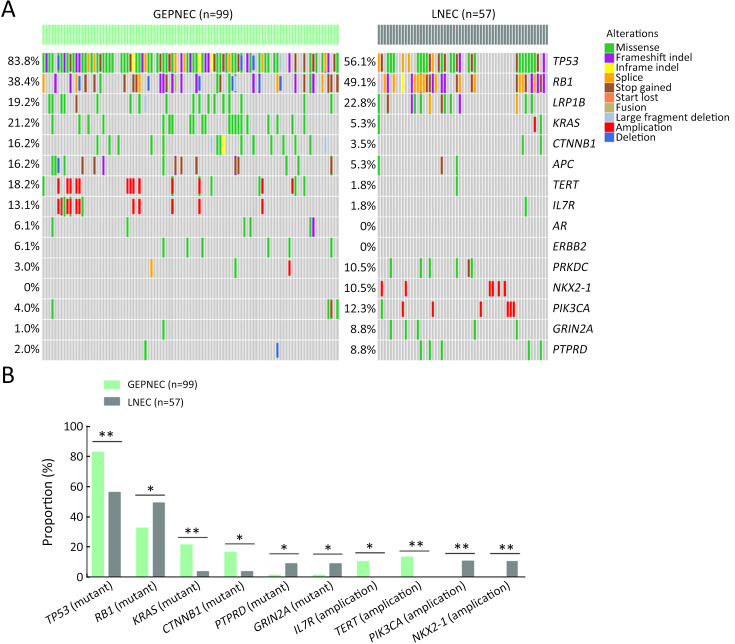
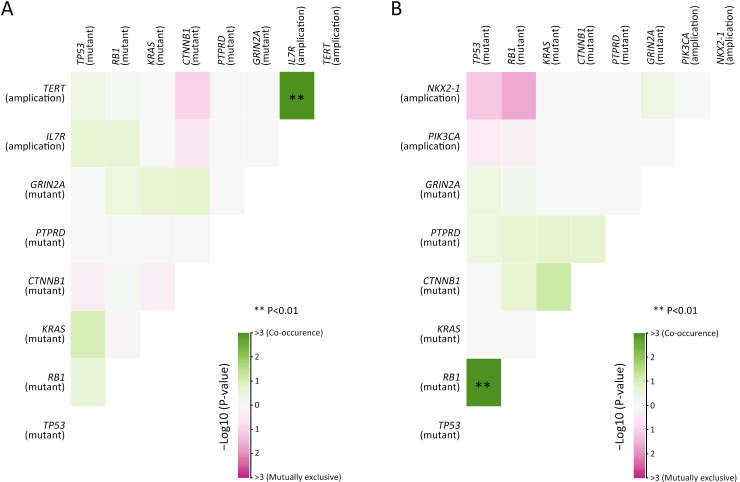
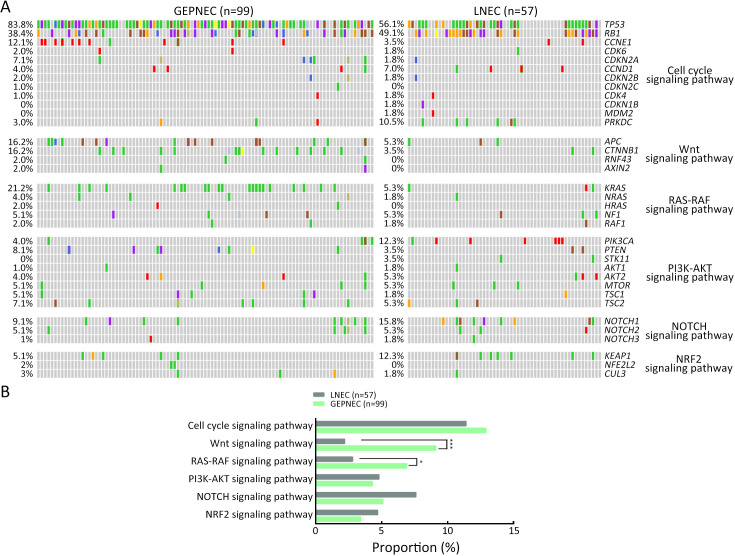
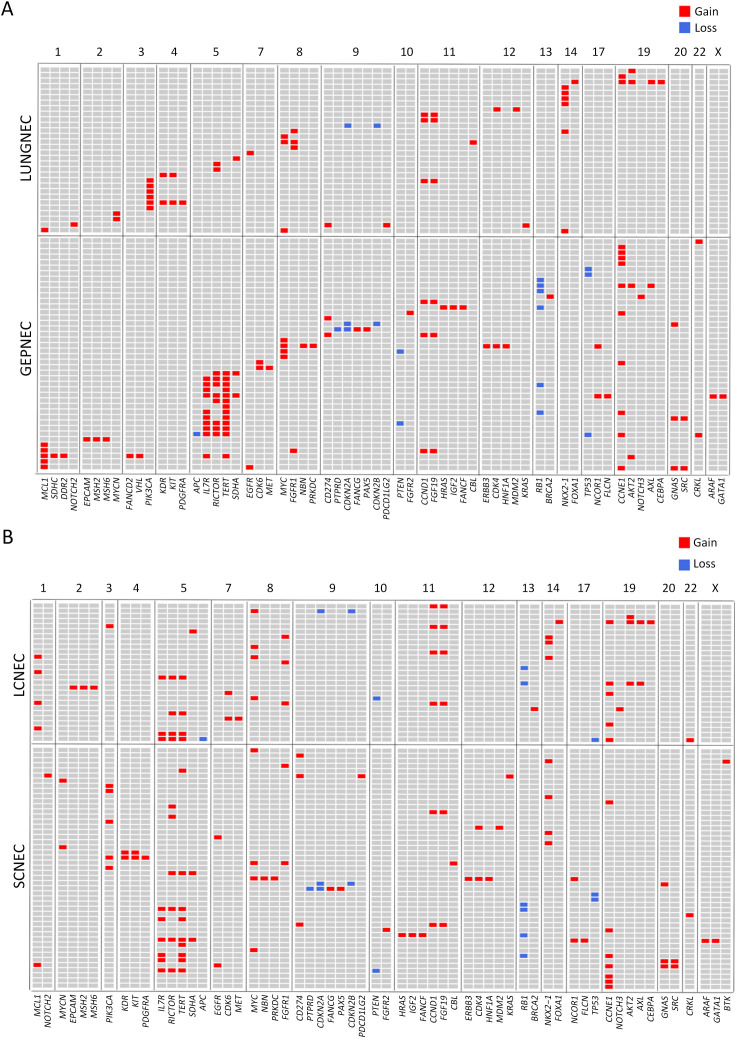
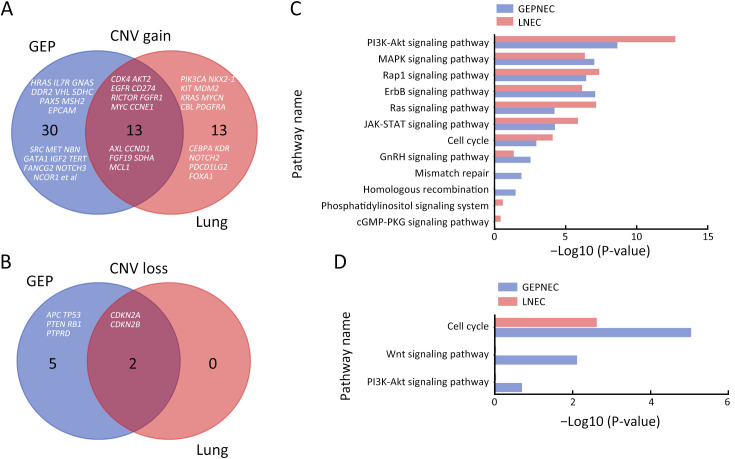
Considering the distinct pathogenetic and prognosis differences, the genetic profile of GEPNEC was comprehensively interrogated, specifically compared with LNEC ( Table 2 ). The comparison showed that GEPNEC had TP53 (82.8%), RB1 (38.4%), and KRAS mutations (21.2%). The most frequently mutated genes in LNEC were TP53 (56.1%), RB1 (49.1%), and LRP1B (22.8%). The TP53, KRAS, TERT, IL7R and CTNNB1 had higher alteration frequency in GEPNEC samples than in LNEC samples, while LNEC had typically higher PIK3CA and NKX2-1 amplifications ( Figure 2 ). The TP53 and RB1 co-mutations had high co-occurrence patterns in LNEC than that in GEPNEC. However, TERT and IL7R co-amplifications were only seen in GEPNEC (both P<0.01) ( Supplementary Figure S3 ). The commonly-seen genes ever reported are summarized in Supplementary Table S2 . We conducted a Kyoto Encyclopedia of Genes and Genomes (KEGG) analysis and concentrated on the major aberrant pathways: PI3K/Akt, Ras/Raf, cell cycle, Wnt and Notch. We then compared their roles between GEPNEC and LNEC. Pathway alterations of Wnt and MAPK signaling pathways were significantly enriched in GEPNEC ( Supplementary Figure S4 ). Furthermore, 42.4% (42/99) of GEPNEC had higher amplification of RB1, APC, PTPRD, CDKN2A, PTEN, and TP53. In contrast, 52.6% (30/57) of LNEC had CNVs. The LNEC suggested higher CNV differences of resulted mainly in increased PIK3CA and NKX2-1 amplification ( Supplementary Figures S5 , S6 ). When the genetic profiles of specific primary sites were compared with LNEC, we found that although TP53 mutation was prevalently observed in each subgroup of GEPNEC, each site had its features. In GNEC, TERT amplification was the most significantly altered gene (28.1% vs. 0, P<0.001), and RB1 mutation was relatively lower than in LNEC (28.1% vs. 49.1%, P=0.033). CRNEC had markedly higher mutations of TP53 (94.4% vs. 56.1%, P=0.004), APC (33.3% vs. 5.3%, P=0.005) and KRAS (44.4% vs. 3.5%, P=0.048) compared with LNEC. Of other categories, DNEC had higher TERT amplification, KRAS mutation, and IL7R amplification (P<0.05). BTNEC had higher CTNNB1 (37.5% vs. 3.5%, P=0.011) and ARID1A (50.0% vs. 5.3%, P=0.003) mutations than LNEC. ENEC had higher SETD2 mutation rate than LNEC (28.6% vs. 0, P=0.010) ( Supplementary Table S3 ). Major genomic differences between sub-category of GEPNEC and LNEC can be seen in Supplementary Figure S7 .
Table 2. Comparisons of significant gene alteration frequency in GEPNEC and LNEC patients.
| Gene | % (n/N) | OR (95% CI) | P | FDR | |
| GEPNEC | LNEC | ||||
| GEPNEC, gastroenteropancreatic neuroendocrine carcinoma; LNEC, lung NEC; OR, odds ratio; 95% CI, 95% confidence interval; FDR, false discovery rate; Inf and −Inf, infinitive and −infinitive. | |||||
| TP53 (mutation) | 82.8 (82/99) | 56.1 (32/57) | 0.27 (0.12−0.59) | 0.001 | 0.005 |
| NKX2-1 (amplification) | 0 (0/99) | 10.5 (6/57) | Inf (2.17−Inf) | 0.002 | 0.005 |
| PIK3CA (amplification) | 0 (0/99) | 10.5 (6/57) | Inf (2.17−Inf) | 0.002 | 0.005 |
| KRAS (mutation) | 21.2 (21/99) | 3.5 (2/57) | 0.14 (0.01−0.60) | 0.002 | 0.005 |
| TERT (amplification) | 13.1 (13/99) | 0 (0/57) | 0 (0−0.52) | 0.002 | 0.006 |
| IL7R (amplification) | 10.1 (10/99) | 0 (0/57) | 0 (0−0.73) | 0.014 | 0.023 |
| CTNNB1 (mutation) | 16.2 (16/99) | 3.5 (2/57) | 0.19 (0.02−0.86) | 0.019 | 0.027 |
| GRIN2A (mutation) | 1.0 (1/99) | 8.8 (5/57) | 9.29 (1.00−449.03) | 0.025 | 0.028 |
| PTPRD (mutation) | 1.0 (1/99) | 8.8 (5/57) | 9.29 (1.00−449.03) | 0.025 | 0.028 |
| RB1 (mutation) | 38.4 (38/99) | 49.1 (28/57) | 1.48 (0.95−8.46) | 0.042 | 0.050 |
Figure 2.
Comparisons of significant gene alteration frequency of GEPNEC and LNEC patients. (A) Oncoprints showing the top most frequent and significant gene alterations between GEPNEC and LNEC; (B) Bar plots of pathway alteration proportions of GEPNEC and LNEC. GEPNEC, gastroenteropancreatic neuroendocrine carcinoma; LNEC, lung NEC. P values were determined using Fisher’s exact test. *, P<0.05; **, P<0.01.
Figure S3.
Correlations analysis of co-occurrence genes in GEPNEC and LNEC. (A) Co-occurrence and mutual exclusiveness of gene alteration pattern in GEPNEC patients; (B) Co-occurrence and mutual exclusiveness of gene alteration pattern in LNEC patients. GEPNEC, gastroenteropancreatic neuroendocrine carcinoma; LNEC, lung NEC. Co-occurring mutations are indicated by green squares and mutually exclusive mutations between gene pairs in purple. The color intensity is proportionate the –log10 (P-value). P values were determined using Fisher’s exact test.
Table S2. Summary of genomic characteristics of GEPNEC patients undergone target NGS.
| Year | Author (ref.) | N (n)* | Primary site (N) | N | % | ||||||||||
| LCNEC ¶ | Panel | TP53 | RB1 | KRAS | BRAF | APC | CTNNB1 | CDKN2A | PI3KCA | ERBB2 | |||||
| GEPENC, gastroenteropancreatic neuroendocrine carcinoma; NGS, next-generation sequencing; MiNEN, mixed neuroendocrine-non-neuroendocrine neoplasia; LCNEC, large-cell NEC; WES, whole-exome sequencing. *, N means numbers of the total GEPNEC samples, n referred to the MiNEN mentioned in the cohort (if accessible) in the study; ¶, numbers of LCNEC patients; §, Puccini et al. and Busico et al. have not provided the relative proportions of NEC among the G3 NEN; ‖, Venizelos et al. have included 29 G3 NET into the total 181 patients. | |||||||||||||||
| References | |||||||||||||||
|
1. Karkouche R, Bachet JB, Sandrini J, et al. Colorectal neuroendocrine carcinomas and adenocarcinomas share oncogenic pathways. A clinico-pathologic study of 12 cases. Eur J Gastroenterol Hepatol 2012;24:1430-7. | |||||||||||||||
|
2. Scardoni M, Vittoria E, Volante M, et al. Mixed adenoneuroendocrine carcinomas of the gastrointestinal tract: Targeted next-generation sequencing suggests a monoclonal origin of the two components. Neuroendocrinology 2014;100:310-6. | |||||||||||||||
|
3. Sahnane N, Furlan D, Monti M, et al. Microsatellite unstable gastrointestinal neuroendocrine carcinomas: A new clinicopathologic entity. Endocr Relat Cancer 2015;22:35-45. | |||||||||||||||
|
4. Olevian DC, Nikiforova MN, Chiosea S, et al. Colorectal poorly differentiated neuroendocrine carcinomas frequently exhibit BRAF mutations and are associated with poor overall survival. Hum Pathol 2016;49:124-34. | |||||||||||||||
|
5. Bergsland EK, Roy R, Stephens P, et al. Genomic profiling to distinguish poorly differentiated neuroendocrine carcinomas arising in different sites. J Clin Oncol 2016;34(15_suppl):4020. | |||||||||||||||
|
6. Vijayvergia N, Boland PM, Handorf E, et al. Molecular profiling of neuroendocrine malignancies to identify prognostic and therapeutic markers: A Fox Chase Cancer Center Pilot Study. Br J Cancer 2016;115:564-70. | |||||||||||||||
|
7. Makuuchi R, Terashima M, Kusuhara M, et al. Comprehensive analysis of gene mutation and expression profiles in neuroendocrine carcinomas of the stomach. Biomed Res 2017;38:19-27. | |||||||||||||||
|
8. Woischke C, Schaaf CW, Yang HM, et al. In-depth mutational analyses of colorectal neuroendocrine carcinomas with adenoma or adenocarcinoma components. Mod Pathol 2017;30:95-103. | |||||||||||||||
|
9. Takizawa N, Ohishi Y, Hirahashi M, et al. Molecular characteristics of colorectal neuroendocrine carcinoma; Similarities with adenocarcinoma rather than neuroendocrine tumor. Hum Pathol 2015;46:1890-900. | |||||||||||||||
|
10. Jesinghaus M, Konukiewitz B, Keller G, et al. Colorectal mixed adenoneuroendocrine carcinomas and neuroendocrine carcinomas are genetically closely related to colorectal adenocarcinomas. Mod Pathol 2017;30:610-9. | |||||||||||||||
|
11. Konukiewitz B, Jesinghaus M, Steiger K, et al. Pancreatic neuroendocrine carcinomas reveal a closer relationship to ductal adenocarcinomas than to neuroendocrine tumors G3. Hum Pathol 2018;77:70-9. | |||||||||||||||
|
12. Shamir E, Devine WP, Jones K, et al. Genomic profiling of colorectal neuroendocrine carcinoma (NEC) reveals multiple mechanisms of RB1 inactivation. Lab Invest 2018;98(suppl 1):301. | |||||||||||||||
|
13. Chen L, Liu M, Zhang Y, et al. Genetic characteristics of colorectal neuroendocrine carcinoma: more similar to colorectal adenocarcinoma. Clin Colorectal Cancer 2021;20:177-85. | |||||||||||||||
|
14. Dizdar L, Werner TA, Drusenheimer JC, et al. BRAFV600E mutation: A promising target in colorectal neuroendocrine carcinoma. Int J Cancer 2019;144:1379-90. | |||||||||||||||
|
15. Krishnamurthy K, Cusnir M, Schwartz M, et al. Retinoblastoma co-repressor 1 (RB) and cyclin-dependent kinase inhibitor (CDKN) as a multi-gene panel for differentiating pulmonary from non-pulmonary origin in metastatic neuroendocrine carcinomas. Pathol Res Pract 2020;216:153051. | |||||||||||||||
|
16. Tanaka H, Hijioka S, Hosoda W, et al. Pancreatic neuroendocrine carcinoma G3 may be heterogeneous and could be classified into two distinct groups. Pancreatology 2020;20:1421-7. | |||||||||||||||
|
17. Busico A, Maisonneuve P, Prinzi N, et al. Gastroenteropancreatic high-grade neuroendocrine neoplasms: histology and molecular analysis, two sides of the same coin. Neuroendocrinology 2020;110:616-29. | |||||||||||||||
|
18. Puccini A, Poorman K, Salem ME, et al. Comprehensive genomic profiling of gastroenteropancreatic neuroendocrine neoplasms (GEP-NENs). Clin Cancer Res 2020;26:5943-51. | |||||||||||||||
|
19. Koh J, Nam SK, Kwak Y, et al. Comprehensive genetic features of gastric mixed adenoneuroendocrine carcinomas and pure neuroendocrine carcinomas. J Pathol 2021;253:94-105. | |||||||||||||||
|
20. Ishida S, Akita M, Fujikura K, et al. Neuroendocrine carcinoma and mixed neuroendocrine-non-neuroendocrine neoplasm of the stomach: a clinicopathological and exome sequencing study. Hum Pathol 2021;110:1-10. | |||||||||||||||
|
21. Liu F, Li Y, Ying D, et al. Whole-exome mutational landscape of neuroendocrine carcinomas of the gallbladder. Signal Transduct Target Ther 2021;6:55. | |||||||||||||||
|
22. de Bitter TJJ, Kroeze LI, de Reuver PR, et al. Unraveling neuroendocrine gallbladder cancer: comprehensive clinicopathologic and molecular characterization. JCO Precis Oncol 2021;5:PO.20.00487. | |||||||||||||||
|
23. Venizelos A, Elvebakken H, Perren A, et al. The molecular characteristics of high-grade gastroenteropancreatic neuroendocrine neoplasms. Endocr Relat Cancer 2021;29:1-14. | |||||||||||||||
|
24. Lee SM, Sung CO. Comprehensive analysis of mutational and clinicopathologic characteristics of poorly differentiated colorectal neuroendocrine carcinomas. Sci Rep 2021;11:6203. | |||||||||||||||
|
25. Yachida S, Totoki Y, Noë M, et al. Comprehensive genomic profiling of neuroendocrine carcinomas of the gastrointestinal system. Cancer Discov 2022;12:692-711. | |||||||||||||||
|
26. Wu H, Yu Z, Liu Y, et al. Genomic characterization reveals distinct mutation landscapes and therapeutic implications in neuroendocrine carcinomas of the gastrointestinal tract. Cancer Commun (Lond) 2022;42:1367-86. | |||||||||||||||
| 2012 | Karkouche R ( 1) | 12 (8) | Colorectum | 12 | − | − | − | 33 | 17 | − | − | − | − | − | |
| 2017 | Scardoni M ( 2) | 6 (−) | Stomach | − | − | 83 | 17 | 17 | − | − | 0 | − | − | − | |
| 2015 | Sahnane N ( 3) | 89 (36) | Esophagus (6), stomach (36),
duodenum (4), colorectum (37), gallbladder (3), pancreas (3) |
40 | − | − | − | 17 | 7 | − | − | − | − | − | |
| 2016 | Olevian DC. ( 4) | 29 (−) | Colorectum | − | − | − | − | 17 | 59 | − | − | − | − | − | |
| 2016 | Bergsland EK ( 5) | 123 | Pancreas | − | 192 | 18 | 10 | 7 | − | 3 | − | 21 | − | − | |
| 2016 | Bergsland EK ( 5) | 92 | Colon | − | 192 | 59 | 34 | 37 | − | 47 | − | 5 | − | − | |
| 2016 | Bergsland EK ( 5) | 59 | Others: (esophagus,
stomach, small intestine) |
− | 192 | 49 | 29 | 3 | − | 8 | − | 25 | − | − | |
| 2016 | Vijayvergia.N ( 6) | 23 (4) | Colon (9), pancreas (4),
small intestine (1), others (9) |
− | 50 | 57 | 9 | 30 | 13 | 22 | − | − | 22 | − | |
| 2017 | Makuuchi R ( 7) | 6 | Stomach | − | 35 | 100 | 17 | 17 | − | 0 | − | − | 17 | − | |
| 2017 | Woischke C ( 8) | 15 (10) | Colorectum | 11 | 50 | 100 | 30 | 90 | 20 | 80 | − | − | 40 | − | |
| 2018 | Takizawa N ( 9) | 25 | Colorectum | 16 | − | 21 | − | 8 | − | 4 | 4 | − | − | − | |
| 2018 | Moritz J ( 10) | 19 | Colorectum (MiNEN) | − | 32 | 53 | 5 | 21 | 37 | 16 | 0 | − | − | 5 | |
| 2018 | Moritz J ( 10) | 8 | Colorectum (NEC) | 7 | 32 | 63 | 0 | 25 | 25 | 63 | 0 | − | − | 0 | |
| 2018 | Konukiewitz B ( 11) | 12 | Pancreas | 9 | 409 | 67 | 33 | 42 | 8 | 8 | 0 | 8 | 8 | 8 | |
| 2019 | Shamir ER ( 12 | 25 (−) | Colorectum | − | 479 | 38 | 58 | 63 | − | 63 | − | − | − | − | |
| 2019 | Chen LH ( 13) | 83 | Colorectum | − | − | 66 | 17 | 37 | 20 | 60 | − | − | − | − | |
| 2019 | Dizdar L ( 14) | 15 | GEPNEC | − | − | − | − | − | 47 | − | − | − | − | − | |
| 2020 | Krishnamurthy K ( 15) | 2 | GEPNEC | − | 126 | 56 | 0 | − | − | − | 44 | − | − | − | |
| 2020 | Tanaka H ( 16) | 44 | Pancreas | 17 | − | − | 55 | 49 | − | − | − | − | − | − | |
| 2020 | Busico A ( 17) | 39 § | GEP | − | 50 | 59 | − | 3 | 10 | 8 | 5 | − | − | − | |
| 2020 | Puccini A ( 18) | 135 § | GEP | − | 592 | 51 | 11 | 29 | 5 | 27 | − | − | 7 | − | |
| 2021 | Koh J ( 19) | 13 | Stomach (MiNEN) | 12 | 170 | 69 | 0 | 0 | 8 | 31 | 8 | − | − | − | |
| 2021 | Koh J ( 19) | 8 | Stomach (NEC) | 6 | 170 | 88 | 13 | 0 | 0 | 0 | 13 | − | − | − | |
| 2021 | Ishida S (MiNEN) ( 20) | 6 | Stomach | 6 | WES | 67 | 0 | 0 | − | 33 | 17 | − | − | − | |
| 2021 | Ishida S (NEC) ( 20) | 7 | Stomach | 4 | WES | 62 | 14 | 14 | − | 14 | 0 | − | − | − | |
| 2021 | Liu F ( 21) | 15 | Gallbladder | 10 | WES | 73 | 27 | − | 0 | 0 | 27 | − | − | 0 | |
| 2021 | deBitter T ( 22) | 9 (6) | Gallbladder | 5 | 523 | 77 | 33 | 11 | − | 11 | 33 | 0 | 0 | 0 | |
| 2022 | Venizelos A ( 23) ‖ | 181 | GEP/Unknown | − | 360 | 64 | 14 | 22 | 20 | 28 | 6 | 3 | − | − | |
| 2021 | Lee SM ( 24) | 30 | Colorectum | 18 | 382 | 43 | 47 | 53 | 23 | 37 | 0 | 3 | 10 | 7 | |
| 2022 | Yachida ( 25) | 54 | GEP | − | − | 26 | − | − | − | − | − | − | |||
| 2022 | Wu ( 26) | 143 | GEP | WES | 89 | 25 | 8 | − | 18 | − | − | − | − | ||
Figure S4.
Summary of gene pathway analysis of GEPNEC vs. LNEC. (A) Oncoprints of main pathways with alteration frequency among GEPNEC and LNEC patients; (B) Bar plots of pathway alteration proportions of GEPNEC vs. LNEC. GEPNEC, gastroenteropancreatic neuroendocrine carcinoma; LNEC, lung NEC. P values were determined using Fisher’s exact test. *, P<0.05; ***, P<0.001.
Figure S5.
CNV analysis between GEPNEC and LNEC. (A) Graphics representing CNV data by sites of origins. The gain or loss of CNV regions in each clade is labeled with colored boxes. Red, gain; blue, loss; (B) Graphics demonstrating CNV data through pathology. GEPNEC, gastroenteropancreatic neuroendocrine carcinoma; LNEC, lung NEC; CNV, copy number variation.
Figure S6.
Distinctions of CNV gain/loss between GEPNEC and LNEC. (A,B) Venn plots for CNV gain (A) and CNV loss (B) of genes between GEPNEC and LNEC; (C,D) Bar plots showing quantity analysis of CNV in gene pathway CNV gain (C) and CNV loss (D). CNV, copy number variation; GEPNEC, gastroenteropancreatic neuroendocrine carcinoma; LNEC, lung NEC.
Table S3. Comparisons of significant gene alteration frequency differences of intra-groups of GEPNEC patients.
| Gene | % (n/N) | OR (95% CI) | P | |
| GEPNEC, gastroenteropancreatic neuroendocrine carcinoma; OR, odds ratio; 95% CI, 95% confidence interval; ENEC, esophagus NEC; LNEC, lung NEC; GNEC, gastric NEC; DNEC, duodenum NEC; CRNEC, colorectal NEC; PNEC, pancreas NEC; BTNEC, bile tract NEC; Inf and −Inf, infinitive and −infinitive. | ||||
| ENEC vs. LNEC | ||||
| TP53 (mutation) | 100 (7/7) | 56.1 (32/57) | 0 (0−0.99) | 0.036 |
| SETD2 (mutation) | 28.6 (2/7) | 0 (0/57) | 0 (0−0.60) | 0.010 |
| GNEC vs. LNEC | ||||
| TP53 (mutation) | 87.5 (28/32) | 56.1 (32/57) | 0.18 (0.04−0.61) | 0.002 |
| RB1 (mutation) | 28.1 (9/32) | 49.1 (28/57) | 2.55 (0.94−7.38) | 0.033 |
| NOTCH1 (mutation) | 0 (0/32) | 15.8 (9/57) | Inf (1.24−Inf) | 0.024 |
| TERT (amplification) | 28.1 (9/32) | 0 (0/57) | 0 (0−0.24) | <0.001 |
| IL7R (amplification) | 21.9 (7/32) | 0 (0/57) | 0 (0−0.35) | <0.001 |
| CCNE1 (amplification) | 25.0 (8/32) | 3.5 (2/57) | 0.12 (0.01−0.64) | 0.004 |
| DNEC vs. LNEC | ||||
| TP53 (mutation) | 100 (8/8) | 56.1 (32/57) | 0 (0−0.84) | 0.019 |
| KRAS (mutation) | 37.5 (3/8) | 3.5 (2/57) | 0.07 (0.01−0.71) | 0.011 |
| IL7R (amplification) | 25.0 (2/8) | 0 (0/57) | 0 (0−0.70) | 0.013 |
| TERT (amplification) | 25.0 (2/8) | 0 (0/57) | 0 (0−0.70) | 0.013 |
| CRNEC vs. LNEC | ||||
| APC (mutation) | 33.3 (6/18) | 5.3 (3/57) | 0.12 (0.02−0.63) | 0.005 |
| KRAS (mutation) | 44.4 (8/18) | 3.5 (2/57) | 0.05 (0−0.29) | 0.048 |
| TP53 (mutation) | 94.4 (17/18) | 56.1 (32/57) | 0.08 (0−0.56) | 0.004 |
| PNEC vs. LNEC | ||||
| RB1 (mutation) | 16.7 (2/12) | 49.1 (28/57) | 0.21 (0.02−1.12) | 0.039 |
| KRAS (mutation) | 25.0 (3/12) | 3.5 (2/57) | 9.02 (0.91−122.19) | 0.031 |
| BTNEC vs. LNEC | ||||
| ARID1A (mutation) | 50.0 (4/8) | 5.3 (3/57) | 0.08 (0.01−0.79) | 0.003 |
| CTNNB1 (mutation) | 37.5 (3/8) | 3.5 (2/57) | 0.05 (0−0.60) | 0.011 |
| TP53 (deletion) | 25.0 (2/8) | 0 (0/57) | 0 (0−0.60) | 0.013 |
| FBXW7 (mutation) | 37.5 (3/8) | 1.8 (1/57) | 0.03 (0−0.42) | 0.005 |
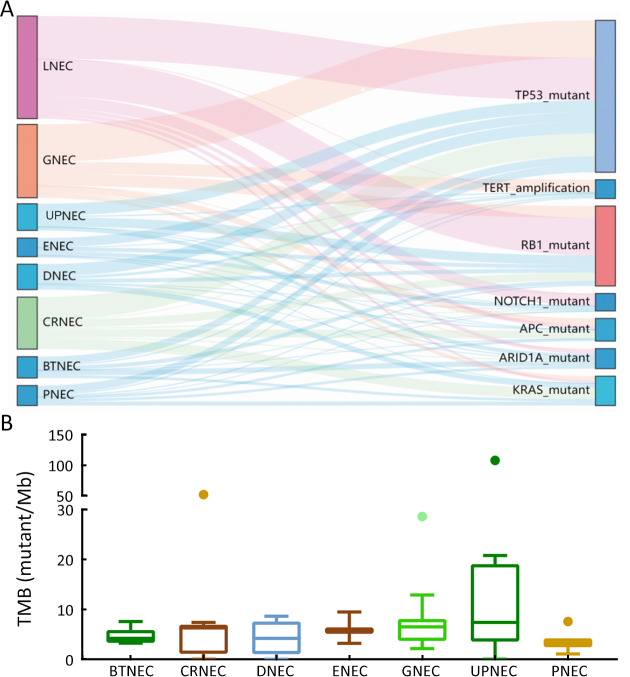
Figure S7.
Drivers genes and TMB distributions for GEPNEC of different primary sites. (A) Sankey plots of distinct driver genes of high frequency in GPENEC with different locations; (B) Box plots of TMB of various primary sites of GEPNEC. TMB, tumor mutation burden; GEPNEC, gastroenteropancreatic neuroendocrine carcinoma; LNEC, lung NEC; GNEC, gastric NEC; UPNEC, unknown primary NEC; ENEC, esophagus NEC; DNEC, duodenum NEC; CRNEC, colorectal NEC; BTNEC, bile tract NEC; PNEC, pancreas NEC.
Genomic comparison of different morphology
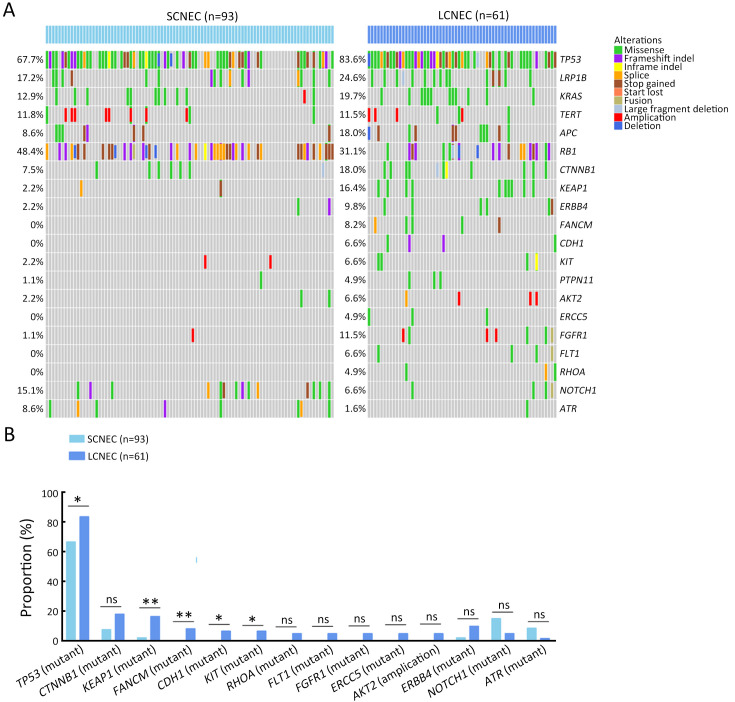
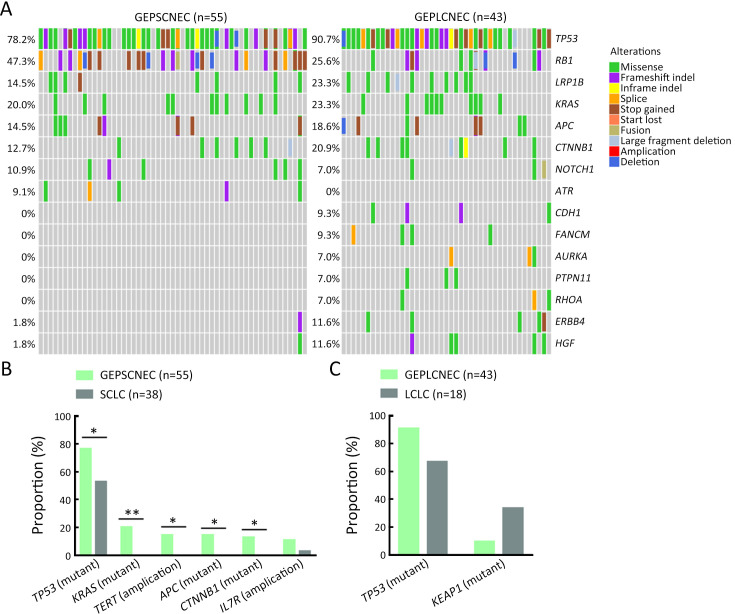
Molecular differences between SCNEC (n=93), including 55 GEPNEC and 38 LNEC, and LCNEC (n=61), including 43 GEPNEC and 18 LNEC, had less heterogeneity than the differences in the primary sites. KEAP1, FANCM, TP53, CDH1 and KIT mutations were more enriched in LCNEC compared with SCNEC ( Supplementary Figure S8 ). Furthermore, when compared to GEPSCNEC, GEPLCNEC only suggested higher mutation frequency of CDH1 and FANCM ( Supplementary Figure S9 , Supplementary Table S4 ). The CNV frequency of LCNEC was comparable to SCNEC ( Supplementary Figure S5 ). We also compared the differences between MiNEN (n=17) and pure NEC (n=82) to see if mixed component influenced the result. MiNEN appeared to have no significantly different genes than pure NEC in our cohort ( Supplementary Table S5 ).
Figure S8.
Summary of alteration frequency of SCNEC vs. LCNEC. (A) Oncoprints showing the top most frequent and significant gene alterations between SCNEC and LCNEC; (B) Bar plots of pathway alteration proportions of SCNEC and LCNEC. SCNEC, small-cell neuroendocrine carcinoma; LCNEC, large-cell neuroendocrine carcinoma. P values were determined using Fisher’s exact test. *, P<0.05; **, P<0.01; ns, no significance.
Figure S9.
Summary of alteration frequency of GEPSCNEC vs. GEPLCNEC. (A) Oncoprints showing the top most frequent and significant gene alterations between GEPSCNEC and GEPLCNEC; (B) Bar plots of pathway alteration proportions of GEPSCNEC and SCLC; (C) Bar plots of pathway alteration proportions of GEPLCNEC and LCLC. GEPSCNEC, gastroenteropancreatic small-cell neuroendocrine carcinoma; GEPLCNEC, gastroenteropancreatic large-cell neuroendocrine carcinoma; SCLC, small-cell lung cancer; LCLC, large-cell lung cancer. P values were determined using Fisher’s exact test. *, P<0.05; **, P<0.01.
Table S4. Alterations frequency differences between SCNEC and LCNEC.
| Gene | % (n/N) | OR (95% CI) | P | |
| SCNEC, small-cell neuroendocrine carcinoma; LCNEC, large-cell neuroendocrine carcinoma; GEPSCNEC, gastroenteropancreatic SCNEC; GEPLCNEC, gastroenteropancreatic LCNEC; OR, odds ratio; 95% CI, 95% confidence interval; Inf and −Inf, infinitive and −infinitive. | ||||
| SCNEC vs. LCNEC | ||||
| KEAP1 (mutation) | 2.2 (2/93) | 16.4 (10/61) | 9.20 (1.86−89.54) | 0.001 |
| FANCM (mutation) | 0 (0/93) | 8.2 (5/61) | Inf (1.52−Inf) | 0.008 |
| TP53 (mutation) | 66.7 (62/93) | 83.6 (51/61) | 2.83 (1.23−7.03) | 0.011 |
| CDH1 (mutation) | 0 (0/93) | 6.6 (4/61) | Inf (1.08−Inf) | 0.021 |
| KIT (mutation) | 0 (0/93) | 6.6 (4/61) | Inf (1.08−Inf) | 0.021 |
| RB1 (mutation) | 51.6 (48/93) | 31.1 (19/61) | 0.47 (0.23−0.96) | 0.025 |
| CTNNB1 (mutation) | 7.5 (7/93) | 18.0 (11/61) | 2.82 (0.93−9.13) | 0.071 |
| ERCC5 (mutation) | 0 (0/93) | 4.9 (3/61) | Inf (0.67−Inf) | 0.055 |
| FGFR1 (mutation) | 0 (0/93) | 4.9 (3/61) | Inf (0.67−Inf) | 0.055 |
| FLT1 (mutation) | 0 (0/93) | 4.9 (3/61) | Inf (0.67−Inf) | 0.055 |
| RHOA (mutation) | 0 (0/93) | 4.9 (3/61) | Inf (0.67−Inf) | 0.055 |
| ERBB4 (mutation) | 2.2 (2/93) | 9.8 (6/61) | 5.14 (0.88−53.75) | 0.058 |
| NOTCH1 (mutation) | 15.1 (14/93) | 4.9 (3/61) | 0.31 (0.05−1.18) | 0.065 |
| ATR (mutation) | 8.6 (8/93) | 1.6 (1/61) | 0.15 (0−1.08) | 0.088 |
| GEPSCNEC vs. GEPLCNEC | ||||
| CDH1 (mutation) | 0 (0/55) | 9.3 (4/43) | Inf (0.87−Inf) | 0.034 |
| FANCM (mutation) | 0 (0/55) | 9.3 (4/43) | Inf (0.87−Inf) | 0.034 |
| ATR (mutation) | 9.1 (5/55) | 0 (0/43) | 0 (0−1.35) | 0.065 |
| TP53 (mutation) | 76.4 (42/55) | 90.7 (39/43) | 0.84 (0.23−1.12) | 0.063 |
Table S5. Alterations frequency differences between pure NEC and MiNEN.
| Gene | Pure NEC [% (n/N)] | MiNEN [% (n/N)] | OR (95% CI) | P |
| NEC, neuroendocrine carcinoma; MiNEN, mixed neuroendocrine-non-neuroendocrine neoplasia; OR, odds ratio; 95% CI, 95% confidence interval. | ||||
| KRAS (mutation) | 20.7 (17/82) | 23.5 (4/17) | 1.13 (0.30−5.13) | 0.945 |
| APC (mutation) | 23.2 (19/82) | 29.4 (5/17) | 1.26 (0.20−2.97) | 0.813 |
| RB1 (mutation) | 41.5 (34/82) | 23.5 (4/17) | 0.63 (0.63−10.4) | 0.166 |
| TP53 (mutation) | 84.1 (69/82) | 82.4 (14/17) | 0.95 (0.18−4.96) | 0.858 |
Genomic comparison of GEPNEC to local adenocarcinoma
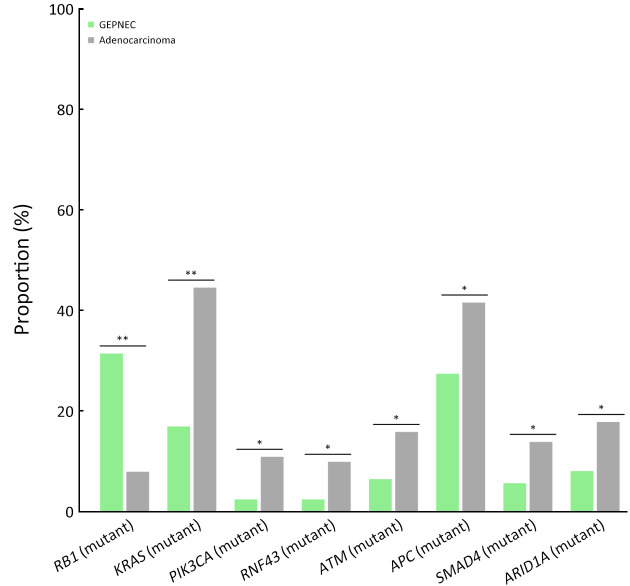
The differential gene alteration analysis of GEPNEC and local adenocarcinoma is shown in Figure 3 . When compared with digestive adenocarcinoma, GEPNEC had a higher frequency of RB1 mutation [31.3% (31/99) vs. 7.9% (8/101), P<0.001] and lower frequencies of APC mutation [16.2% (16/99) vs. 41.6% (42/101), P=0.011] and KRAS mutations [17.2% (17/99) vs. 44.6% (45/101), P<0.001] ( Table 3 ). When comparing GEPNEC and digestive adenocarcinoma by primary sites, we found that GNEC had higher TP53 and RB1 mutations than gastric adenocarcinoma (P<0.05). In contrast, ARID1A, PI3KCA, and LRP1B had significantly lower alteration frequencies (P<0.05). CRNEC had a remarkably higher RB1 mutation rate [38.9% (7/18) vs. 10.7% (6/56), P<0.001] than colorectal adenocarcinoma. In PNEC, KRAS mutation frequency [16.7% (2/12) vs. 75.0% (9/12), P=0.034] was significantly lower than pancreatic ductal adenocarcinoma ( Supplementary Table S6 ).
Figure 3.
Bar plots of comparisons of significant gene alteration frequency of GEPNEC and local adenocarcinoma patients. GEPNEC, gastroenteropancreatic neuroendocrine carcinoma. *, P<0.05; **, P<0.01.
Table 3. Comparisons of significant gene alteration frequency of GEPNEC and local adenocarcinoma patients.
| Gene | % (n/N) | OR (95% CI) | P | FDR | |
| GEPNEC vs. Adenocarcinoma | |||||
| GEPNEC, gastroenteropancreatic neuroendocrine carcinoma; OR, odds ratio; 95% CI, 95% confidence interval; FDR, false discovery rate. | |||||
| RB1 (mutation) | 31.3 (31/99) | 7.9 (8/101) | 6.12 (2.65−16.00) | <0.001 | <0.001 |
| KRAS (mutation) | 17.2 (17/99) | 44.6 (45/101) | 0.26 (0.13−0.49) | <0.001 | <0.001 |
| PIK3CA (mutation) | 2.0 (2/99) | 10.9 (11/101) | 0.20 (0.04−0.80) | 0.018 | 0.036 |
| RNF43 (mutation) | 2.0 (2/99) | 9.9 (10/101) | 0.23 (0.04−0.92) | 0.033 | 0.053 |
| ATM (mutation) | 6.1 (6/99) | 15.8 (16/101) | 0.37 (0.13−0.96) | 0.040 | 0.053 |
| APC (mutation) | 16.2 (16/99) | 41.6 (42/101) | 0.53 (0.29−0.96) | 0.011 | 0.029 |
| SMAD4 (mutation) | 7.1 (7/99) | 13.9 (14/101) | 0.37 (0.12−1.00) | 0.166 | 0.166 |
| ARID1A (mutation) | 8.1 (8/99) | 17.8 (18/101) | 0.41 (0.16−0.98) | 0.057 | 0.065 |
Table S6. Alterations frequency differences in GEPNEC and adenocarcinoma.
| Gene | % (n/N) | OR (95% CI) | P | |
| GEPNEC, gastroenteropancreatic neuroendocrine carcinoma; GNEC, gastric NEC; STAD, stomach adenocarcinoma; CRNEC, colorectal NEC; COREAD, colorectal adenocarcinoma; PNEC, pancreas NEC; PAC, pancreatic adenocarcinoma. | ||||
| GNEC vs. STAD | ||||
| ARID1A (mutation) | 0 (0/32) | 34.6 (9/26) | 0 (0−0.21) | <0.001 |
| TP53 (mutation) | 84.4 (27/32) | 57.7 (15/26) | 4.20 (1.23−15.44) | 0.014 |
| PI3KCA (mutation) | 0 (0/32) | 15.4 (4/26) | 0.01 (0−0.77) | 0.016 |
| LRP1B (mutation) | 12.5 (4/32) | 38.5 (10/26) | 0.23 (0.06−0.84) | 0.020 |
| RB1 (mutation) | 25.0 (8/32) | 3.8 (1/26) | 8.16 (1.08−369.00) | 0.033 |
| CRNEC vs. COREAD | ||||
| RB1 (mutation) | 38.9 (7/18) | 10.7 (6/56) | 0.19 (0.05−0.67) | <0.001 |
| PNEC vs. PAC | ||||
| KRAS (mutation) | 16.7 (2/12) | 75.0 (9/12) | 0.10 (0.01−0.84) | 0.034 |
Therapeutic investigation of GEPNEC
We explored the relations between responses of first-line regimens and TP53/ RB1 co-alteration patterns (deemed as SCLC-like GEPNEC) and other patterns (deemed as non-SCLC-like GEPNEC) in advanced GEPNEC from our cohort. We found that SCLC-like patients were prone to benefit from etoposide and platinum (EP) chemotherapy, but SCLC-like patients had less benefits from adenocarcinoma chemotherapy ( Table 4 ).
Table 4. Association of gene-base subtypes of GEPNEC* and first-line regimens.
| GEPNEC types | Regimens | % (n/N) | |
| ORR | DCR | ||
| GEPNEC, gastroenteropancreatic neuroendocrine carcinoma; ORR, overall response rate; DCR, disease control rate; SCLC, small-cell lung cancer; SCNEC, small-cell NEC; LCNEC, large-cell NEC; EP, etoposide and platinum; *, among stage IV, 76 patients had recorded first-line therapy. SCLC-like type, GEPNEC patients with TP53 and RB1 co-mutation (n=27); Non-SCLC-like, GEPNEC patients except for SCLC-like type (n=49); Other regimens mainly included irinotecan-based or oxaplatin-based therapy, which were commonly applied in gastrointestinal adenocarcinoma. | |||
| Genomic-based subtype | |||
| SCLC-like | EP | 50.0 (11/22) | 81.8 (18/22) |
| Other | 0 (0/5) | 40.0 (2/5) | |
| Non-SCLC-like | EP | 18.9 (7/37) | 73.0 (27/37) |
| Other | 33.3 (4/12) | 75.0 (9/12) | |
| Pathological-based subtype | |||
| SCNEC | EP | 30.8 (12/39) | 82.0 (32/39) |
| Other | 33.3 (2/6) | 50.0 (3/6) | |
| LCNEC | EP | 25.0 (3/12) | 58.3 (7/12) |
| Other | 21.1 (4/19) | 63.2 (12/19) | |
Targetable genes with FDA-approved drugs were specifically identified in 12 GEPNEC patients. Two patients had BRAF V600E mutations, and one had a KRAS G12C mutation. CDK4 and CDK6 mutations emerged as putative targets in one patient. ALK and MET amplifications were seen in two patients. Mutation frequency of targetable PIK3CA E545K mutation (1.0%, 1/99) of GEPNEC was significantly lower than that of LNEC. Approximately 3.0% (3/99) had germline alterations in the DNA damage repair (DDR) pathway, including BRCA2, ATM, and ATR mutations ( Table 5 ). Microsatellite instability (MSI) was also observed in 4.4% of GEPNEC, including two CRNEC (11.1%) patients, one GNEC, and one PNEC patient. The median TMB of GEPNEC was 5.3 mutations/Mb. GNEC had a median TMB of 6.5 mutations/Mb (Q1−Q3: 4.2−7.6), CRNEC had a median TMB of 6.3 mutations/Mb (Q1−Q3: 1.7−6.7), PNEC had a median TMB of 1.7 mutations/Mb (Q1−Q3: 0.9−2.1), and UPNEC had a median TMB of 7.4 mutations/Mb (Q1−Q3: 4.3−15.6) ( Supplementary Figure S7 ). When accounting for MSI-H and TMB-high into targetable patients, the total number came to 22.2% (22/99). We found that these patients receiving corresponding second-line target therapies had significantly longer PFS [12.5 months vs. 3.0 months, HR=0.40 (0.21−0.75), P=0.006] and OS [46.9 months vs. 13.4 months, HR=0.30 (0.11−0.73), P=0.020] than non-targetable patients ( Figure 4 ).
Table 5. Potential treatment targets through ClinVar in GEPNEC.
| Target genes | No. | Drugs |
| GEPNEC, gastroenteropancreatic neuroendocrine carcinoma; Genes associated with target therapy were listed binding to the applications of potential drugs. Drugs were approved by Food and Drug Administration (FDA) or used in phase III clinical trial. | ||
| BRAF V600E (mutation) | 2 | Vemurafenib, Dabrafenib, Encorafenib |
| MET (amplification)/ ALK (fusion) | 2 | Crizotinib, Lorlatinib, Ceritinib, Alectinib, Brigatinib |
| KRAS G12C (mutation) | 1 | Sotorasib, Adagrasib, JNJ-74699157, GDC-6036, LY3499446, JDQ443, D-1553 |
| RET (fusion) | 2 | Selpercatinib, Pralsetinib, Cabozantinib, Vandetanib, TPX-0046, RXDX-105, BOS172738 |
| PIK3CA E545K (mutation) | 1 | Everolimus, Temsirolimus, Alpelisib, Copanlisib, Taselisib, CYH33, TQ-B3525, BKM120, Inavolisib, SF1126, GDC-0084, Copanlisib hydrochloride |
| CDK4/ CDK6 (amplification) | 1 | Palbociclib, Ribociclib, Abemaciclib, SHR6390, PD 0332991, Trilaciclib, G1T38, LEE011 |
| CDH1 (mutation) | 1 | Crizotinib, Savolitinib, Capmatinib, Tepotinib, ARQ 197 |
| BRCA12, ATM and ATR (germline mutation) | 3 | Olaparib, Rucaparib, Niraparib, Talazoparib |
| MSI-H | 3 | Pembrolizumab, Nivolumab, Ipilimumab, Tislelizumab, Sintilimab, Toriplimab, Camrelizumab, Envafolomab |
| TMB-H | 16 | |
Figure 4.
Survival plots of targetable patients with target therapy and non-targetable patients with other therapies. (A) PFS of patients with/without target therapy (P=0.006); (B) OS of patients with/without target therapy (P=0.020). PFS, progression-free survival; OS, overall survival.
Discussion
Currently, management for GEPNEC follows the guidelines of SCLC, regardless of primary site and pathology. However, some patients still had rapid disease progression ( 26, 27). Current genomic studies mainly focus on NENs ( 7), whereas genetic studies on GEPNEC are relatively scarce ( 4, 28). This study explored the genomic features of GEPNEC compared with different primary sites and pathology.
In this study, GEPNEC differed from SCLC and had fewer driver gene patterns of SCLC, like TP53/ RB1 co-mutations. Besides the prevalence of TP53 mutations (32.9% −83.8%) ( 7, 29- 31), our results were consistent with what the various anatomic sites revealed from large-sample studies ( 12, 32). The low RB1 mutation rate might be associated with some race differences between the incidence of RB1 mutations in Asians and that in Caucasians ( 33). Besides, some previous results primarily relied on IHC data, where molecular events (like methylation and deletions) affecting RB1 protein expression may be attributed to discordance. Gene variations between GEPNEC and LNEC were CTNNB1, TERT, and IL7R. Notably, this study revealed that amplifications of TERT and IL7R were unique alterations in GNEC, yet the mechanisms of their co-amplification remain unknown ( 7). TERT promoter mutations were found in PNET/LNET as potential clinical implications. The PI3K/Akt, Ras/Raf, Wnt, and Notch signaling pathways were affected by mutations in GEPNEC and LNEC and appeared to play a paramount role in GEPNEC. These mutations were closely related to carcinogenesis and might play important roles in the development of cancer.
Specific genes of GEPNEC compared with LNEC can be analyzed by primary sites. A small-sample study focusing on GNEC confirmed that the gene alterations were similar to adenocarcinoma but had different spectrums of HER2 ( 12, 14, 32). The study found that 8.3% of GNEC patients presented with HER2 over-expression, and 16.7% presented with a loss of E-cadherin. Generally, GNEC may share similar molecular spectrums with stomach adenocarcinoma, as proposed by Ishida et al. ( 34). Koh et al. uncovered common genetic spectrums between two components of gastric MiNEN. CRNEC had KRAS (8.3% −60%), APC (4.2% −80%), and BRAF (4.2% −58.6%) mutations as the key differential genes from other GEPNECs ( 10, 15, 16, 20, 35). CpG island methylator phenotype (CIMP) and BRAF mutations also emerged as clinical biomarkers in colorectal cancers and are waiting for further validation in CRNEC ( 13, 36, 37). PNEC demonstrated different genetic profiles, with a relatively lower TP53/ RB1 mutation frequency. While higher ROS1, CDKN2A, and KRAS mutations (25%) were observed in PNEC when compared with gastrointestinal NEC (GINEC) ( 16, 38). These specific genomic patterns support the closer pathogenetic relationship between PNEC and non-neuroendocrine pancreatic carcinoma than G3 NET ( 39). PNEC can be divided into “Ductal-type” and “Acinar-type” by WES/WGS, characterized by KRAS/TP53/RB1 and CTNNB1/CDKN2A/TP53 mutations, which further clarifies the molecular classification of GEPNEC ( 6). ENEC exhibits a higher frequency of NOTCH1 mutation, which may serve as a distinguishing factor. The gene spectrum of DNEC emerged as the overlapping entity that bridged GNEC and CRNEC. Further mechanisms may be associated with the location of transition between the upper and lower gastrointestinal tracts. For BTNEC, we confirmed that ARID1A mutations were common, which is associated with immunotherapy in NEN ( 40).
Our findings suggest that the genetic differences from morphology (small-cell vs. large-cell) were relatively small, and stratification may not reflect the features well. The molecular subtypes of SCLC have been well established, and novel classifications of LCNEC may supplement more therapeutic utility. A previous study highlighted that SCLCs were genetically different from LCNEC in alterations and CNV spectra ( 41). We observed that 30%−40% of previous sequencing was comprised of non-neuroendocrine components, which could confound the findings related to genuine neuroendocrine malignancies ( 11, 15, 17, 34). Some studies have suggested that NEC variants may originate from autochthonous non-NECs of these sites ( 12, 18, 39). MiNEN had no marked gene differences compared with pure NEC, perhaps due to the relatively small number. It is important to distinguish between pure NEC and mixed tumors in future analysis.
Therapeutics may be guided in the light of the genome, regardless of comorbidity and pathology. The alteration frequencies of GEPNEC were not comparable to the average levels of pan-cancer (20.9% vs. 57.0%). Although some studies have reported that 94% of NECs had putative responsive biomarkers to targetable mutations or ICI, but the criteria were not as strict for the targetable genes ( 8). Current targetable drugs of GEPNEC markedly differed from those of LNEC. Further evidence on GEPNEN uncovered that 49% of advanced NENs harbored actionable genomic alterations. Vijayvergia et al. revealed a spectrum of targetable genes ranked by PIK3CA/PTEN (22%) and BRAF (13%) mutations ( 7), with BRAF mutations found in 20% of GEPNECs ( 5). Additionally, PI3KCA mutations (4.9%−12.5%) have a potential role in targeting the PI3K/AKT signaling pathway, while KRAS and BRAF mutations influenced the prognosis of GEPNEC ( 42). The BRAF inhibitors (widely used for adenocarcinoma) may also be used for CRNEC ( 35, 43). We observed that 2/18 of CRNECs had a BRAF V600E mutation in our study, which was relatively low compared to the range of incidence in CRNEC (4.1%−88.2%) ( 9, 11, 15, 30, 37). These mutations could be confirmed in prominent actionable mutations in the Wnt pathway, where the proportions of APC (14.3%−17.5%) and CTNNB1 (16.4%) mutations were appreciable ( 7). CDK4/CDK6 amplification was seen in five patients. Olaparib has shown promising efficacy with an overall response rate (ORR) of 41.7% in SCLC with similar alterations ( 44).
GEPNECs from different origins showed relatively low TMB levels, consistent with a previous report on extrapulmonary NECs ( 20, 45). TMB-H was unrelated to longer OS in GEPNEC, but we observed a correlation between TMB-H and longer PFS (over 16 months) upon using second-line anti-PD-1 therapy in our cohort. Lu et al. confirmed that TMB-H demonstrated good efficacy in extrapulmonary NEN ( 40). MSI and PD-L1 statuses were also associated with a better prognosis and response in GEPNEC ( 46- 48). A previous study reported the variable frequency range of MSI distribution in GEPNEC of 0−69.7%, which was also prevalent in GNEC and CRNEC ( 13, 49, 50). However, it remains undetermined whether these identified potential druggable genomic alterations could be translated into clinical practice ( 6). Here, we demonstrated that the driver genes of GEPNEC had putative roles in improving the clinical outcomes, and the relevance of these genes for target/immunotherapy warrants further study. Since targeted and immune therapies offer additional and effective treatment options for SCLC, basket trials can be employed to identify more individualized therapeutic options in GEPNEC ( 51).
We also explored the relations between the response of first-line EP regimens and “SCLC-like” GEPNEC and revealed the positive relevance. This intriguing result may be attributed to the genetic nature of the TP53/ RB1 co-mutation pattern reflecting the sensitivity to the regimens, similar to SCLC. Some LCNEC with a TP53/ RB1 co-mutation responded better to EP ( 41, 52). These findings emphasize the potential for targeted therapies based on the genomic profile of GEPNEC, highlighting specific genes and signaling pathways that could be therapeutically exploited.
However impactful these results are, there were some limitations. First, the sample size was relatively small, which may limit the generalizability of these findings. In addition, the ratio of the different pathological subtypes differed compared with the reported world ratios. Stratifications according to the molecular context should be the pursuit of precise medication to contribute to optimal therapeutic options; however, the small sample size may hinder comprehensive analyses in this regard. Moreover, the NGS panel we used only covered 233 genes, limiting the accuracy of the TMB evaluations ( 53). A broader gene panel could provide a more comprehensive assessment of genomic alterations and TMB levels.
Conclusions
The genetic features of GEPNEC are distinct from those of LNEC and local adenocarcinoma. Several key genetic alterations differentiate GEPNEC from LNEC and local adenocarcinoma, including RB1, KRAS, APC, TERT, ARID1A, and CTNNB1. In comparison with LNEC, GEPNEC shows differences in RB1 and KRAS mutations. GEPNEC and digestive adenocarcinoma had differences in RB1 and KRAS mutation as well. Specifically, the following GEPNEC subgroups had particular alterations: GNEC ( TERT amplification), CRNEC ( KRAS mutation), and BTNEC ( ARID1A mutation). Targetable genes were identified in approximately 22.2% of the GEPNEC patients and demonstrated promising PFS outcomes. We believe in promising future that genes may guide GEPNEC treatment, but further attempts in genetic analysis are needed to elucidate the underlying mechanisms, and large-sample prospective studies are warranted to validate these findings.
Acknowledgements
This study was supported by the Major Program of National Natural Science Foundation of China (No. 91959205); National Natural Science Foundation of China (No. 82141117); The Capital’s Funds for Health Improvement and Research (CFH) (No. 2022-2-1023); Beijing Xisike Clinical Oncology Research Foundation Y-pierrefabre (No. 202101-0099); Beijing Municipal Administration of Hospitals Incubating Program (No. PX2020045) and Science Foundation of Peking University Cancer Hospital (No. 2020-4).
Contributor Information
Minglei Zhuo, Email: minglei1978@163.com.
Ming Lu, Email: qiminglu_mail@126.com.
References
- 1.Nagtegaal ID, Odze RD, Klimstra D, et al The 2019 WHO classification of tumours of the digestive system. Histopathology. 2020;76:182–8. doi: 10.1111/his.13975. [DOI] [PMC free article] [PubMed] [Google Scholar]
- 2.Brennan SM, Gregory DL, Stillie A, et al Should extrapulmonary small cell cancer be managed like small cell lung cancer. Cancer. 2010;116:888–95. doi: 10.1002/cncr.24858. [DOI] [PubMed] [Google Scholar]
- 3.Girardi DM, Silva ACB, Rêgo JFM, et al Unraveling molecular pathways of poorly differentiated neuroendocrine carcinomas of the gastroenteropancreatic system: A systematic review. Cancer Treat Rev. 2017;56:28–35. doi: 10.1016/j.ctrv.2017.04.002. [DOI] [PubMed] [Google Scholar]
- 4.Puccini A, Poorman K, Salem ME, et al Comprehensive genomic profiling of gastroenteropancreatic neuroendocrine neoplasms (GEP-NENs) Clin Cancer Res. 2020;26:5943–51. doi: 10.1158/1078-0432.Ccr-20-1804. [DOI] [PMC free article] [PubMed] [Google Scholar]
- 5.Venizelos A, Elvebakken H, Perren A, et al The molecular characteristics of high-grade gastroenteropancreatic neuroendocrine neoplasms. Endocr Relat Cancer. 2021;29:1–14. doi: 10.1530/ERC-21-0152. [DOI] [PMC free article] [PubMed] [Google Scholar]
- 6.Yachida S, Totoki Y, Noë M, et al Comprehensive genomic profiling of neuroendocrine carcinomas of the gastrointestinal system. Cancer Discov. 2022;12:692–711. doi: 10.1158/2159-8290.CD-21-0669. [DOI] [PMC free article] [PubMed] [Google Scholar]
- 7.Vijayvergia N, Boland PM, Handorf E, et al Molecular profiling of neuroendocrine malignancies to identify prognostic and therapeutic markers: A Fox Chase Cancer Center Pilot Study. Br J Cancer. 2016;115:564–70. doi: 10.1038/bjc.2016.229. [DOI] [PMC free article] [PubMed] [Google Scholar]
- 8.van Riet J, van de Werken HJG, Cuppen E, et al The genomic landscape of 85 advanced neuroendocrine neoplasms reveals subtype-heterogeneity and potential therapeutic targets. Nat Commun. 2021;12:4612. doi: 10.1038/s41467-021-24812-3. [DOI] [PMC free article] [PubMed] [Google Scholar]
- 9.Olevian DC, Nikiforova MN, Chiosea S, et al Colorectal poorly differentiated neuroendocrine carcinomas frequently exhibit BRAF mutations and are associated with poor overall survival. Hum Pathol. 2016;49:124–34. doi: 10.1016/j.humpath.2015.11.004. [DOI] [PubMed] [Google Scholar]
- 10.Lee SM, Sung CO Comprehensive analysis of mutational and clinicopathologic characteristics of poorly differentiated colorectal neuroendocrine carcinomas. Sci Rep. 2021;11:6203. doi: 10.1038/s41598-021-85593-9. [DOI] [PMC free article] [PubMed] [Google Scholar]
- 11.Karkouche R, Bachet JB, Sandrini J, et al Colorectal neuroendocrine carcinomas and adenocarcinomas share oncogenic pathways. A clinico-pathologic study of 12 cases. Eur J Gastroenterol Hepatol. 2012;24:1430–7. doi: 10.1097/MEG.0b013e3283583c87. [DOI] [PubMed] [Google Scholar]
- 12.Scardoni M, Vittoria E, Volante M, et al Mixed adenoneuroendocrine carcinomas of the gastrointestinal tract: Targeted next-generation sequencing suggests a monoclonal origin of the two components. Neuroendocrinology. 2014;100:310–6. doi: 10.1159/000369071. [DOI] [PubMed] [Google Scholar]
- 13.Sahnane N, Furlan D, Monti M, et al Microsatellite unstable gastrointestinal neuroendocrine carcinomas: A new clinicopathologic entity. Endocr Relat Cancer. 2015;22:35–45. doi: 10.1530/ERC-14-0410. [DOI] [PubMed] [Google Scholar]
- 14.Makuuchi R, Terashima M, Kusuhara M, et al Comprehensive analysis of gene mutation and expression profiles in neuroendocrine carcinomas of the stomach. Biomed Res. 2017;38:19–27. doi: 10.2220/biomedres.38.19. [DOI] [PubMed] [Google Scholar]
- 15.Woischke C, Schaaf CW, Yang HM, et al In-depth mutational analyses of colorectal neuroendocrine carcinomas with adenoma or adenocarcinoma components. Mod Pathol. 2017;30:95–103. doi: 10.1038/modpathol.2016.150. [DOI] [PubMed] [Google Scholar]
- 16.Takizawa N, Ohishi Y, Hirahashi M, et al Molecular characteristics of colorectal neuroendocrine carcinoma; Similarities with adenocarcinoma rather than neuroendocrine tumor. Hum Pathol. 2015;46:1890–900. doi: 10.1016/j.humpath.2015.08.006. [DOI] [PubMed] [Google Scholar]
- 17.Jesinghaus M, Konukiewitz B, Keller G, et al Colorectal mixed adenoneuroendocrine carcinomas and neuroendocrine carcinomas are genetically closely related to colorectal adenocarcinomas. Mod Pathol. 2017;30:610–9. doi: 10.1038/modpathol.2016.220. [DOI] [PubMed] [Google Scholar]
- 18.Konukiewitz B, Jesinghaus M, Steiger K, et al Pancreatic neuroendocrine carcinomas reveal a closer relationship to ductal adenocarcinomas than to neuroendocrine tumors G3. Hum Pathol. 2018;77:70–9. doi: 10.1016/j.humpath.2018.03.018. [DOI] [PubMed] [Google Scholar]
- 19.Shamir E, Devine WP, Jones K, et al. Genomic profiling of colorectal neuroendocrine carcinoma (NEC) reveals multiple mechanisms of RB1 inactivation. Lab Invest 2018;98(supplement 1):301.
- 20.Chen L, Liu M, Zhang Y, et al Genetic characteristics of colorectal neuroendocrine carcinoma: more similar to colorectal adenocarcinoma. Clin Colorectal Cancer. 2021;20:177–85. doi: 10.1016/j.clcc.2020.09.001. [DOI] [PubMed] [Google Scholar]
- 21.Dizdar L, Werner TA, Drusenheimer JC, et al BRAF V600E mutation: A promising target in colorectal neuroendocrine carcinoma . Int J Cancer. 2019;144:1379–90. doi: 10.1002/ijc.31828. [DOI] [PubMed] [Google Scholar]
- 22.Tanaka H, Hijioka S, Hosoda W, et al Pancreatic neuroendocrine carcinoma G3 may be heterogeneous and could be classified into two distinct groups. Pancreatology. 2020;20:1421–7. doi: 10.1016/j.pan.2020.07.400. [DOI] [PubMed] [Google Scholar]
- 23.Li H, Durbin R Fast and accurate short read alignment with Burrows-Wheeler transform. Bioinformatics. 2009;25:1754–60. doi: 10.1093/bioinformatics/btp324. [DOI] [PMC free article] [PubMed] [Google Scholar]
- 24.Cibulskis K, Lawrence MS, Carter SL, et al Sensitive detection of somatic point mutations in impure and heterogeneous cancer samples. Nat Biotechnol. 2013;31:213–9. doi: 10.1038/nbt.2514. [DOI] [PMC free article] [PubMed] [Google Scholar]
- 25.Talevich E, Shain AH, Botton T, et al CNVkit: Genome-wide copy number detection and visualization from targeted DNA sequencing. PLoS Comput Biol. 2016;12:e1004873. doi: 10.1371/journal.pcbi.1004873. [DOI] [PMC free article] [PubMed] [Google Scholar]
- 26.Sorbye H, Grande E, Pavel M, et al European Neuroendocrine Tumor Society (ENETS) 2023 guidance paper for digestive neuroendocrine carcinoma. J Neuroendocrinol. 2023;35:e13249. doi: 10.1111/jne.13249. [DOI] [PubMed] [Google Scholar]
- 27.George J, Lim JS, Jang SJ, et al Comprehensive genomic profiles of small cell lung cancer. Nature. 2015;524:47–53. doi: 10.1038/nature14664. [DOI] [PMC free article] [PubMed] [Google Scholar]
- 28.Hong X, Qiao S, Li F, et al Whole-genome sequencing reveals distinct genetic bases for insulinomas and non-functional pancreatic neuroendocrine tumours: leading to a new classification system. Gut. 2020;69:877–87. doi: 10.1136/gutjnl-2018-317233. [DOI] [PMC free article] [PubMed] [Google Scholar]
- 29.AACR Project GENIE Consortium AACR Project GENIE: Powering Precision Medicine through an International Consortium. Cancer Discov. 2017;7:818–31. doi: 10.1158/2159-8290.Cd-17-0151. [DOI] [PMC free article] [PubMed] [Google Scholar]
- 30.Busico A, Maisonneuve P, Prinzi N, et al Gastroenteropancreatic high-grade neuroendocrine neoplasms: histology and molecular analysis, two sides of the same coin. Neuroendocrinology. 2020;110:616–29. doi: 10.1159/000503722. [DOI] [PubMed] [Google Scholar]
- 31.Uccella S and Rosa SL Looking into digestive mixed neuroendocrine - nonneuroendocrine neoplasms: subtypes, prognosis, and predictive factors. Histopathology. 2020;77:700–17. doi: 10.1111/his.14178. [DOI] [PubMed] [Google Scholar]
- 32.Koh J, Nam SK, Kwak Y, et al Comprehensive genetic features of gastric mixed adenoneuroendocrine carcinomas and pure neuroendocrine carcinomas. J Pathol. 2021;253:94–105. doi: 10.1002/path.5556. [DOI] [PubMed] [Google Scholar]
- 33.Liu J, Zhao Z, Wei S, et al Genomic features of Chinese small cell lung cancer. BMC Med Genomics. 2022;15:117. doi: 10.1186/s12920-022-01255-3. [DOI] [PMC free article] [PubMed] [Google Scholar]
- 34.Ishida S, Akita M, Fujikura K, et al Neuroendocrine carcinoma and mixed neuroendocrine-non-neuroendocrine neoplasm of the stomach: a clinicopathological and exome sequencing study. Hum Pathol. 2021;110:1–10. doi: 10.1016/j.humpath.2020.12.008. [DOI] [PubMed] [Google Scholar]
- 35.Capdevila J, Arqués O, Hernández Mora JR, et al Epigenetic EGFR gene repression confers sensitivity to therapeutic BRAFV600E blockade in colon neuroendocrine carcinomas. Clin Cancer Res. 2020;26:902–9. doi: 10.1158/1078-0432.CCR-19-1266. [DOI] [PubMed] [Google Scholar]
- 36.Furlan D, Sahnane N, Mazzoni M, et al Diagnostic utility of MS-MLPA in DNA methylation profiling of adenocarcinomas and neuroendocrine carcinomas of the colon-rectum. Virchows Archi. 2013;462:47–56. doi: 10.1007/s00428-012-1348-2. [DOI] [PubMed] [Google Scholar]
- 37.Woischke C, Jung P, Jung A, et al Mixed large cell neuroendocrine carcinoma and squamous cell carcinoma of the colon: detailed molecular characterisation of two cases indicates a distinct colorectal cancer entity. J Pathol Clin Res. 2021;7:75–85. doi: 10.1002/cjp2.183. [DOI] [PMC free article] [PubMed] [Google Scholar]
- 38.Chen D, Bao X, Zhang R, et al Depiction of the genomic and genetic landscape identifies CCL5 as a protective factor in colorectal neuroendocrine carcinoma. Br J Cancer. 2021;125:994–1002. doi: 10.1038/s41416-021-01501-y. [DOI] [PMC free article] [PubMed] [Google Scholar]
- 39.Kimura T, Miyamoto H, Fukuya A, et al Neuroendocrine carcinoma of the pancreas with similar genetic alterations to invasive ductal adenocarcinoma. Clin J Gastroenterol. 2016;9:261–5. doi: 10.1007/s12328-016-0655-6. [DOI] [PubMed] [Google Scholar]
- 40.Wang FH, Wei XL, Feng J, et al Efficacy, safety, and biomarkers of toripalimab in patients with recurrent or metastatic neuroendocrine neoplasms: a multiple-center phase Ib trial. J Clin Oncol. 2021;39:704–12. doi: 10.1158/1078-0432.CCR-19-4000. [DOI] [PubMed] [Google Scholar]
- 41.Rekhtman N, Pietanza MC, Hellmann MD, et al Next-generation sequencing of pulmonary large cell neuroendocrine carcinoma reveals small cell carcinoma-like and non-small cell carcinoma-like subsets. Clin Cancer Res. 2016;22:3618–29. doi: 10.1158/1078-0432.CCR-15-2946. [DOI] [PMC free article] [PubMed] [Google Scholar]
- 42.Elvebakken H, Hjortland GO, Garresori H, et al Impact of KRAS and BRAF mutations on treatment efficacy and survival in high-grade gastroenteropancreatic neuroendocrine neoplasms. J Neuroendocrinol. 2023;35:e13256. doi: 10.1111/jne.13256. [DOI] [PubMed] [Google Scholar]
- 43.Burkart J, Owen D, Shah MH, et al Targeting BRAF mutations in high-grade neuroendocrine carcinoma of the colon . J Natl Compr Canc Netw. 2018;16:1035–40. doi: 10.6004/jnccn.2018.7043. [DOI] [PubMed] [Google Scholar]
- 44.Farago AF, Yeap BY, Stanzione M, et al Combination olaparib and temozolomide in relapsed small-cell lung cancer. Cancer Discov. 2019;9:1372–87. doi: 10.1158/2159-8290.CD-19-0582. [DOI] [PMC free article] [PubMed] [Google Scholar]
- 45.Ohmoto A, Sato Y, Asaka R, et al Clinicopathological and genomic features in patients with head and neck neuroendocrine carcinoma. Mod Pathol. 2021;34:1979–89. doi: 10.1038/s41379-021-00869-9. [DOI] [PMC free article] [PubMed] [Google Scholar]
- 46.Ferrata M, Schad A, Zimmer S, et al. PD-L1 expression and immune cell infiltration in gastroenteropancreatic (GEP) and non-GEP neuroendocrine neoplasms with high proliferative activity. Front Oncol 2019;9:343.
- 47.Chetty R, Capo-Chichi JM, Serra S Colorectal large-cell neuroendocrine carcinoma with lymphoid stroma: further evidence confirming a unique subtype associated with MLH1/PMS2 loss, BRAF mutation, Epstein-Barr virus negativity, and the possibility of a better prognosis. Histopathology. 2019;75:247–53. doi: 10.1111/his.13875. [DOI] [PubMed] [Google Scholar]
- 48.Digiacomo N, Bolzacchini E, Veronesi G, et al Neuroendocrine differentiation, microsatellite instability, and tumor-infiltrating lymphocytes in advanced colorectal cancer with BRAF mutation. Clin Colorectal Cancer. 2019;18:e251–60. doi: 10.1016/j.clcc.2018.12.003. [DOI] [PubMed] [Google Scholar]
- 49.La Rosa S, Marando A, Furlan D, et al Colorectal poorly differentiated neuroendocrine carcinomas and mixed adenoneuroendocrine carcinomas: Insights into the diagnostic immunophenotype, assessment of methylation profile, and search for prognostic markers. Am J Surg Pathol. 2012;36:601–11. doi: 10.1097/PAS.0b013e318242e21c. [DOI] [PubMed] [Google Scholar]
- 50.Xing J, Ying H, Li J, et al Immune checkpoint markers in neuroendocrine carcinoma of the digestive system. Front Oncol. 2020;10:132. doi: 10.3389/fonc.2020.00132. [DOI] [PMC free article] [PubMed] [Google Scholar]
- 51.de Bitter TJJ, Kroeze LI, de Reuver PR, et al Unraveling neuroendocrine gallbladder cancer: comprehensive clinicopathologic and molecular characterization. JCO Precis Oncol. 2021;5:PO.20.00487. doi: 10.1200/po.20.00487. [DOI] [PMC free article] [PubMed] [Google Scholar]
- 52.Zhuo M, Guan Y, Yang X, et al The prognostic and therapeutic role of genomic subtyping by sequencing tumor or cell-free DNA in pulmonary large-cell neuroendocrine carcinoma. Clin Cancer Res. 2020;26:892–901. doi: 10.1158/1078-0432.Ccr-19-0556. [DOI] [PMC free article] [PubMed] [Google Scholar]
- 53.Mosele F, Remon J, Mateo J, et al Recommendations for the use of next-generation sequencing (NGS) for patients with metastatic cancers: a report from the ESMO Precision Medicine Working Group. Ann Oncol. 2020;31:1491–505. doi: 10.1016/j.annonc.2020.07.014. [DOI] [PubMed] [Google Scholar]


