Abstract
Fluorescent molecular probes that report nitroreductase activity have promise as imaging tools to elucidate the biology of hypoxic cells and report the past hypoxic history of biomedical tissue. This study describes the synthesis and validation of a “first-in-class” ratiometric, hydrophilic near-infrared fluorescent molecular probe for imaging hypoxia-induced nitroreductase activity in 2D cell culture monolayers and 3D multicellular tumor spheroids. The probe's molecular structure is charge-balanced and the change in ratiometric signal is based on Förster Resonance Energy Transfer (FRET) from a deep-red, pentamethine cyanine donor dye (Cy5, emits ∼660 nm) to a linked near-infrared, heptamethine cyanine acceptor dye (Cy7, emits ∼780 nm). Enzymatic reduction of a 4-nitrobenzyl group on the Cy7 component induces a large increase in Cy7/Cy5 fluorescence ratio. The deep penetration of near-infrared light enables 3D optical sectioning of intact tumor spheroids, and visualization of individual hypoxic cells (i.e., cells with raised Cy7/Cy5 ratio) as a new way to study tumor spheroids. Beyond preclinical imaging, the near-infrared fluorescent molecular probe has high potential for ratiometric imaging of hypoxic tissue in living subjects.
A ratiometric, near-infrared fluorescent molecular probe reports nitroreductase activity and enables three-dimensional optical sectioning of intact tumor spheroids with visualization of individual hypoxic cells.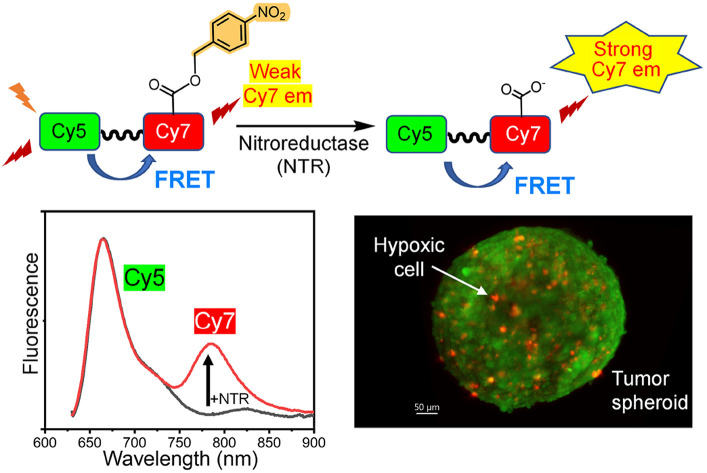
Introduction
Hypoxia is a hallmark of solid tumors and known to alter tumor physiology and impact clinical treatment.1–3 For several decades, researchers have actively pursued preclinical and clinical imaging methods to quantify the extent and distribution of tumor hypoxia. In addition and in contrast to direct (i.e., invasive) measurements of tissue oxygen levels, indirect methods have been developed to detect specific biomarkers that are overexpressed in hypoxic tissues.3,4 Many of these biomarkers are long-lived and thus they are a persistent record of a cell's past history under hypoxic conditions. Overexpressed enzymes are especially attractive as biomarkers because they can chemically “turn over” multiple copies of a suitably designed molecular substrate (i.e., bioresponsive molecular probe) and produce an amplified imaging signal.5,6 In recent years, a large amount of research on hypoxia imaging has focused on bioresponsive fluorescent molecular probes that report nitroreductase (NTR) activity.7–9 There are two related goals for this ongoing work; one is to develop new research tools to study the biology of hypoxic cells,1,2 and a more applied goal is to develop hypoxia imaging methods for clinical translation.10,11
The iterative process for developing high performance, fluorescent molecular probes for imaging NTR activity must ultimately produce chemical structures that simultaneously possess a favorable combination of reactivity, photophysical, and pharmaceutical properties. This current study describes a novel fluorescent NTR-responsive probe molecule with two highly desired features, (a) long-wavelength near-infrared absorption/emission wavelengths that can penetrate relatively deeply through opaque samples with reduced scattering of the light, and (b) capacity to produce a ratiometric response that enables self-calibrated measurements with a reduced number of experimental artifacts. The research literature contains many examples of NTR-responsive fluorescent probes with one of these two performance features, but there are very few examples that possess both attributes.12–19 Here we describe a molecular design that is based on Förster Resonance Energy Transfer (FRET) from a deep-red, pentamethine cyanine Cy5 donor dye (emits ∼660 nm) to a linked near-infrared, heptamethine cyanine Cy7 acceptor dye (emits ∼780 nm). There are surprisingly few reports of activatable fluorescent molecular probes that are based on a Cy5–Cy7 FRET pair,6,20 and in all these cases, a change in ratiometric imaging signal is produced when a linker is cleaved and the Cy5 donor separates from the Cy7 acceptor.21–24 To the best of our knowledge, there is no reported example of an NTR-responsive fluorescent molecule that is based on a Cy5–Cy7 FRET pair.25 Conceptually, the closest example is a nanoparticle design by Feng and coworkers who encapsulated two separate fluorophores within a self-assembly of hyaluronic acid.26 One of the encapsulated fluorophores was a near-infrared Cy7 dye that was “turned on” by NTR activity and the other encapsulated fluorophore was a non-responsive deep-red Cy5.26 A comparison of the fluorescent responses in normoxic and hypoxic cells revealed a ∼30% increase in the Cy7/Cy5 ratio.
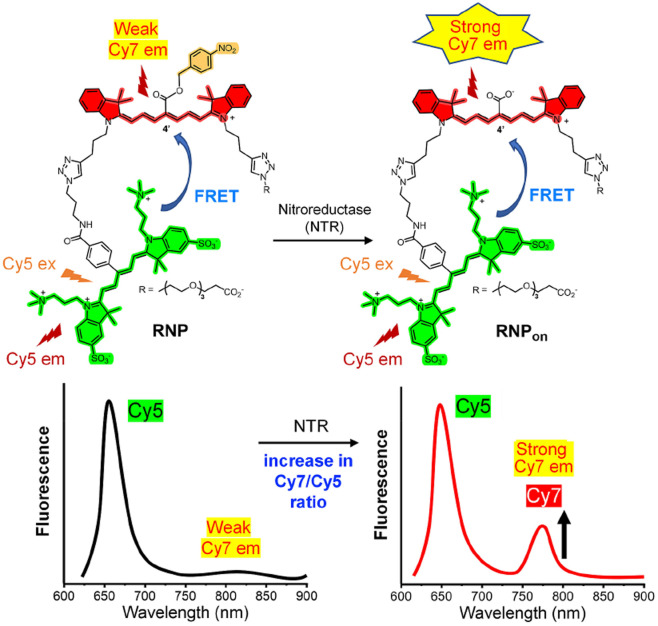
Although the synthetic simplicity of nanoparticle self-assembly is appealing, we reasoned that quantitative microscopic studies of cell hypoxia and eventual clinical utilization would likely be more feasible if the ratiometric near-infrared NTR-responsive probe was a discrete, structurally defined molecule. Therefore, we designed the molecule in Scheme 1 that we call Ratiometric Nitroreductase Probe (RNP). The molecule is composed of a Cy5 donor component linked to a Cy7 acceptor component. A unique structural feature of the Cy7 component is the 4-nitrobenzyl ester group at the 4′-position on the heptamethine chain. We have previously reported that NTR-catalyzed reduction of the nitro group triggers a spontaneous bond cleavage process that converts the 4′-ester group into a 4′-carboxyl group and induces a moderate blue shift in the Cy7 absorption maxima along with a very large increase in the Cy7 fluorescence quantum yield.27,28 With this knowledge in mind, we hypothesized that NTR-catalyzed conversion of RNP to RNPon would induce a large change in the ratio of Cy7/Cy5 emission peaks (ratiometric response). A second structural attribute is the wide distribution of alternating charge across the structures of RNP and RNPon which enhances water solubility and minimizes probe self-association or association with off-target hydrophobic biological structures, such as membranes, which can alter the FRET response and produce signal artifacts. In addition, the alternating charge across RNPon makes it very unlikely for the probe to diffuse out of a target hypoxic cell and produce “blurred” images. Here, we report the synthesis and validation of RNP performance as a “first-in-class” ratiometric, hydrophilic, near-infrared fluorescent, molecular probe for imaging cell hypoxia in 2D cell culture monolayers and 3D multicellular spheroids.
Scheme 1. Representation of FRET from the Cy5 component (colored green) within RNP and RNPon to the Cy7 component (colored red). NTR catalyzed reduction of the nitro group triggers a bond cleavage process that converts the 4′-ester group within RNP into the 4′-carboxyl group within RNPon which increases Cy7 emission, and the Cy7/Cy5 fluorescence ratio.
Results and discussion
The synthetic methods and compound characterization are provided in the ESI,† along with calculated molecular models of RNP and RNPon in low energy conformations (Fig. S1†). Absorption spectra in DMSO and water (Fig. S2 and S3†) indicate good solubility with no intra or intermolecular association of the chromophores. The fluorescence spectra in Fig. S4† demonstrate that RNP and RNPon both exhibit energy transfer from the respective Cy5 donor to the Cy7 acceptor, but the Cy7 component in RNPon is more emissive due to its 4′-carboxyl group. Preliminary test experiments used commercial supplies of pure nitroreductase (NTR) enzyme from Escherichia coli. LC-MS experiments proved that a solution of RNP in NADH-supplemented buffer was converted by the NTR enzyme to RNPon (Fig. S5†). Moreover, conversion of RNP to RNPon produced the expected diagnostic changes in absorption and emission spectra (Fig. 1).‡RNP binding by bovine serum albumin (BSA) was determined to be quite weak (Fig. S6a†) and not strong enough to inhibit NTR-mediated conversion of RNP to RNPon (Fig. S6b†). In addition, a fluorescence spectrum of RNP in 100% human serum showed no measurable conversion to RNPon (Fig. S6c†) after a one-hour incubation at 37 °C. Photostability was also observed to be satisfactory as summarized in ESI Section 7.1.† Together, these results support the feasibility of RNP as an NTR-responsive probe for eventual use in living humans or patient-derived samples.
Fig. 1. (a) Absorption spectra, (b) fluorescence spectra, ex: 620 nm, (c) fluorescence spectra, ex: 720 nm. In each panel, the two spectra correspond to a sample of RNP (5 μM) before and one hour after addition of NADH (500 μM) and NTR (10 μg mL−1) in 1X PBS buffer pH 7.4, slit width = 5 nm at 37 °C.
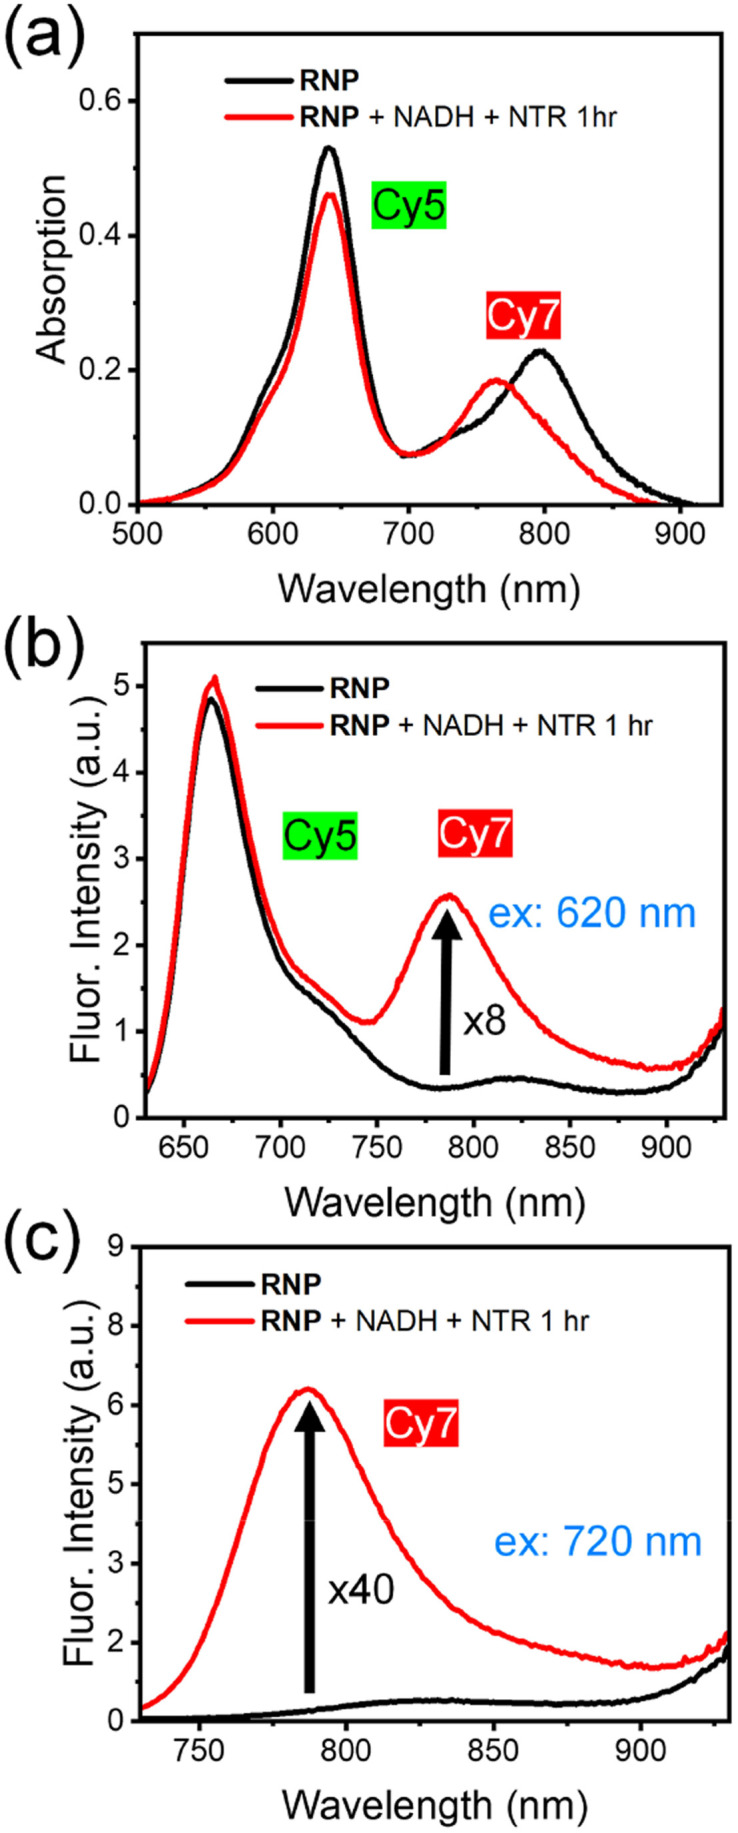
There are two ways to generate a ratiometric signal for NTR conversion of RNP to RNPon. Technically, the simplest procedure is method (a) which excites the probe's Cy5 component (ex: 620 nm) and measures emission intensity at the Cy5 and Cy7 wavelengths. Alternatively, method (b) is a two-step sequence that selectively excites (ex: 620 nm) and detects the Cy5 emission and then selectively excites (ex: 720 nm) and detects the Cy7 emission. The fluorescence spectra in Fig. 1b were acquired using method (a) and they show that NTR induced an 8-fold increase in Cy7 emission intensity with virtually no change in the Cy5 intensity. The spectra in Fig. 1c are part of the set acquired by method (b) and they show that direct excitation of the Cy7 component at 720 nm produced a 40-fold increase in Cy7 emission intensity, which translated to a larger NTR-induced change in the Cy7/Cy5 ratio. While the two-step ratiometric method (b) requires more instrument time to execute, it produces a larger change in ratiometric signal because direct excitation of the Cy7 component is more intense compared to Cy7 excitation by FRET from the Cy5 donor (the indirect Cy7 excitation process in method (a)). Thus, method (b) was employed in the following fluorescence imaging experiments.
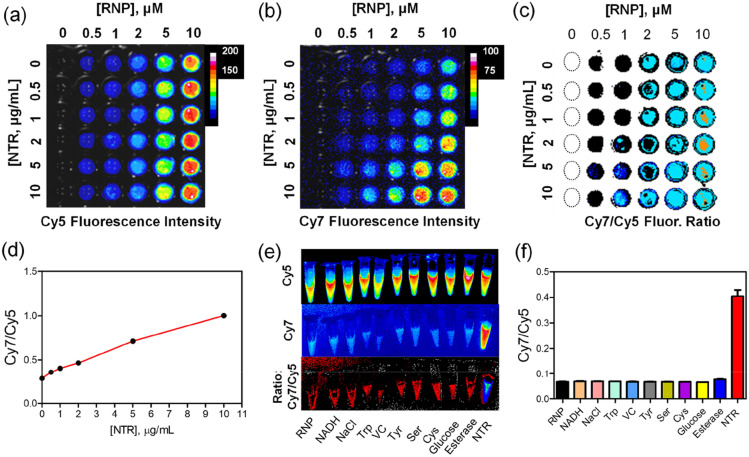
The suitability of RNP for near-infrared ratiometric fluorescence imaging of NTR enzyme activity was first confirmed by experiments that imaged a multiwell plate using a commercial in vivo imaging station (IVIS) that was equipped with Cy5 and Cy7 imaging channels. Separate wells containing different concentrations of RNP (0–10 μM) were simultaneously incubated for 30 minutes with a range of NTR concentrations (0–10 μg mL−1), then the multiwell plate was imaged. The images in Fig. 2a and b are false-colored pixel intensity maps of the plate acquired with Cy5 or Cy7 fluorescence settings, respectively, and in Fig. 2c is an image of Cy7/Cy5 ratios. Inspection of the images clearly shows that the Cy5 fluorescence intensity increases with RNP concentration, and that it is insensitive to NTR concentration. In contrast, the Cy7 fluorescence intensity (and thus the Cy7/Cy5 ratio) increases with NTR concentration, as reflected by the representative plot in Fig. 2d, which shows a near-linear correlation of Cy7/Cy5 ratio with NTR concentration. Selectivity studies were performed to confirm that the fluorescence response of RNP is insensitive to common biological analytes or other enzymes. The images in Fig. 2e and corresponding bar graph in Fig. 2f show that only NTR induced a large change in ratiometric imaging signal. It is worth noting that the ester bond within RNP is not cleaved by porcine liver esterase, which is consistent with the observed stability of RNP in human serum (Fig. S6c†). Combined, the data in Fig. 2 confirms the capacity of RNP to quantify NTR levels by near-infrared ratiometric imaging using an IVIS.
Fig. 2. (a and b) Pixel intensity maps of a multiwell plate containing increasing concentrations of RNP (left to right) and NTR (top to bottom) in 1X PBS buffer and NADH (500 μM) at pH 7.4 and room temperature. After a 30 minutes incubation, the images were acquired using an IVIS with Cy5 (ex: 605 ± 20 nm, em: 670 ± 20 nm) or Cy7 (ex: 745 ± 20 nm, em: 850 ± 20 nm) channels. (c) Images of Cy5/Cy7 ratio for the multi-well plate. (d) Plot of Cy7/Cy5 ratio for the wells that contained 5 μM of RNP and different NTR concentrations. (e) Pixel intensity maps of separate Eppendorf tubes containing RNP (5 μM) in 1X PBS buffer pH 7.4, with the following additives, (1) no additive, (2) 500 μM NADH, (3) 1 mM NaCl, (4) Tryptophan (Trp), (5) Vitamin C (VC), (6) Tyrosine (Tyr), (7) Serine (Ser), (8) Cysteine (Cys), (9) Glucose, (10) 50 μg mL−1 porcine liver esterase, (11) 500 μM NADH + 10 μg mL−1 NTR. Images acquired after 1 hour incubation at 37 °C. (f) Bar graph of Cy7/Cy5 ratio for the Eppendorf tube images in panel (e).
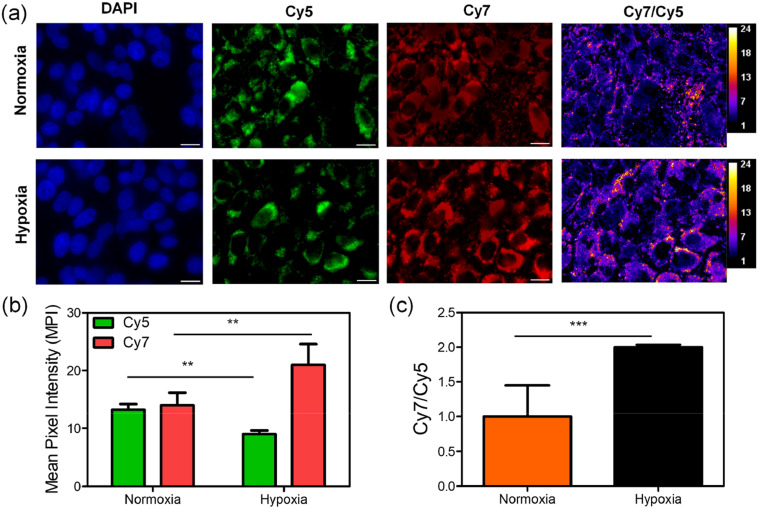
Standard MTT assays assessed the effect of RNP on the metabolic activity of A549 (Lung carcinoma), MDA-MB-231 (Breast cancer), HT-29 (Colorectal Adenocarcinoma) and CHOK1 (Chinese Hamster Ovary) cells as an indicator of cell viability and probe cytotoxicity. The cancer cell lines have been employed by others for hypoxia imaging based on nitroreductase activity and thus they were useful as benchmarks for comparison.27,29–31 In addition, they represent aggressive and difficult to treat cancers, and thus have significant translational relevance. With the three cancer cell-lines there was no change in metabolic activity when the cells were incubated with RNP at all concentrations tested (up to 30 μM) for 24 hours. There was a moderate decrease in metabolic activity of CHOK1 cells when the concentration of RNP was above 10 μM (Fig. S10†), but overall, the low or negligible cell toxicity of RNP supports its suitability for bioimaging. The capacity of RNP to report increased NTR activity in hypoxic A549 lung cancer cells was demonstrated by conducting fluorescence microscopy studies of two-dimensional cell culture monolayers that were grown under hypoxic (1% oxygen atmosphere) or normoxic (20% oxygen atmosphere) conditions for 24 hours. In each case, the cells were incubated with 10 μM of RNP for 1 hour, then fixed with paraformaldehyde and incubated with Hoechst nuclear stain. Subsequent microscopic multicolor imaging revealed the same Cy5 fluorescence intensity in the hypoxic or normoxic cells but higher Cy7 fluorescence in the hypoxic cells (Fig. 3a). A pixel intensity map of the ratiometric (Cy7/Cy5) signal indicated conversion of RNP to RNPon and quantification of this data showed that the mean ratiometric (Cy7/Cy5) signal was about two times more intense in the hypoxic cultures than the normoxic cultures (Fig. 3b). This is three times larger than the change in Cy7/Cy5 ratio observed by Feng and coworkers using their fluorophore nanoassembly system.26 Additional evidence that the increase in Cy7/Cy5 signal was due to NTR activity was gained by showing that the Cy7/Cy5 ratio decreased significantly when the hypoxic cells were pre-treated with the NTR inhibitor dicoumarol (Fig. S11†). Not all the enzymes that promote NTR activity in mammalian cells are known, but there is strong evidence implicating CYP450 enzymes.32
Fig. 3. (a) Representative multicolor fluorescent micrographs of A549 cells grown under normoxic (20% O2) or hypoxic (1% O2) conditions for 24 hours and then incubated with 10 μM of RNP for 1 hour, emission filter channels: DAPI (435–485 nm), Cy5 (663–737 nm), Cy7 (780–900 nm), length scale = 20 μm; ratiometric (Cy7/Cy5) image. (b) Quantification of average Mean Pixel Intensity (MPI) for multiple micrographs (N = 18 each condition). (c) Comparison of MPI ratio (Cy7/Cy5) for multiple micrographs of normoxic or hypoxic cells (N = 18 for each condition). **p ≤ 0.01, ***p ≤ 0.001.
Three-dimensional (3D) multicellular tumor spheroids mimic many of the organizational aspects of clinical solid tumors and they have strong attributes as informative preclinical models for cancer drug screening or studies of tumor cell adaptation and therapy resistance.33 In principle, the effective use of 3D tumor spheroids should reduce the number of animals required for preclinical studies while increasing the success rates of clinical trials. However, 3D tumor spheroids have several technical drawbacks that currently limit utility and broad impact, including: (a) batch-to-batch variation in 3D spheroid structure and intercellular packing which leads to uncertainties regarding mechanical and physiochemical parameters such as nutrient and waste concentration gradients, and (b) spatiotemporal variation in the metabolic state of the cells within a multicellular spheroid assembly.34 Convenient and reliable fluorescence imaging methods are needed to accurately characterize each spheroid within a collection and the individual cells within a single spheroid.35,36 One of the central metabolic features of a 3D tumor spheroid is cell hypoxia which is known to vary with experimental parameters such as cancer cell types and metabolic requirements, intercellular packing, spheroid age and size, and cell spatial location within the spheroid.37,38 Unlike 2D cell culture monolayers, 3D tumor spheroids exhibit the same gradients, heterogeneity, and oscillations in O2 levels as solid tumors. Current tumor spheroid imaging methods using relatively lipophilic molecular probes with “turn on” fluorescence are susceptible to imaging artifacts caused by various factors including rapid probe uptake by the peripheral cells, continued diffusion of the product dye between cells within the spheroid, and spheroid-promoted scattering, and attenuation of the visible microscopy light intensity.37–40 In this regard, RNP is especially well-suited as a molecular probe for fluorescence imaging of 3D tumor spheroids due to the low propensity of RNP/RNPon to transfer between cells, the near-infrared absorption/emission wavelengths which reduces background autofluorescence and scattering of the microscopy light, and the ratiometric fluorescence response that is insensitive to changes in probe concentration.
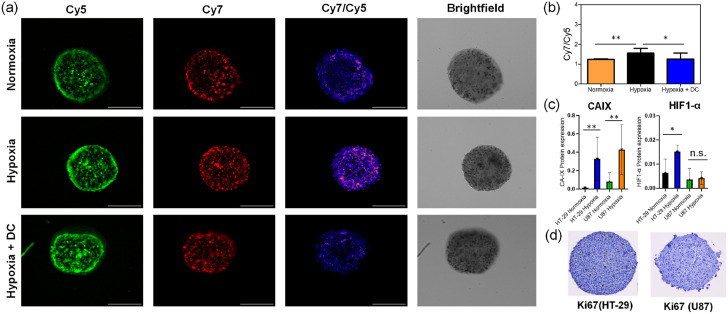
To test the spheroid imaging performance of RNP, we cultured U87 and HT-29 cells as relatively small 3D spheroids (diameter range 400–450 μm) for 48 hours at 37 °C using the hanging drop incubation method.41§ The spheroids were subsequently incubated under normoxic (20% O2) or hypoxic (1% O2) conditions for another 24 hours before being treated with 20 μM RNP for 1 hour. The representative images of HT-29 spheroids (Fig. 4a) and associated quantitative analysis (Fig. S12†) indicate relatively rapid distribution of the hydrophilic molecular probe throughout the tumor spheroid.¶ Moreover, the distribution of hypoxic cells (i.e., cells with high Cy7/Cy5 ratio) was roughly even and apparently random with no evidence of a hypoxic core as sometimes observed in large, closely packed, or older tumor spheroids.37,38,42,43 Optical sectioning of the intact spheroids was achieved by employing structured illumination fluorescence microscopy,44 and the 3D distribution of hypoxic cells throughout the spheroids was visualized as Z-stacks of Cy7-channel images representing central sections of the spheroids (100 μm thick). Movies of the Z-stacks (see ESI† for movie files and Fig. S14† for montage of images) confirm complete penetration of near-infrared light through the spheroid and reveal the spatial locations of the hypoxic cells. The average ratiometric signal (Cy7/Cy5 ratio) for each spheroid was higher under hypoxic conditions compared to normoxic conditions (Fig. 4b) but the increase in Cy7/Cy5 ratio was less than the change observed with 2D cell culture (Fig. 3c). Supporting evidence that the Cy7/Cy5 ratio was reporting NTR activity was gained by observing a lower Cy7/Cy5 ratio in hypoxic HT-29 spheroids that had been pre-treated with the NTR inhibitor dicoumarol before addition of the RNP (Fig. 4a and b). Repeated fluorescence imaging studies using U87 spheroids, which were more densely packed at the same three-day post-seeding timepoint, observed weaker probe fluorescence due to reduced RNP uptake into the cells after the 1 hour incubation; nonetheless, the ratiometric imaging indicated the same trend of hypoxia-induced increase in NTR activity (Fig. S13†). This result highlights an inherent attraction of this ratiometric imaging method to measure statistically meaningful changes in the NTR activity within different tumor spheroids that contain unequal probe concentrations.
Fig. 4. (a) Representative images of 3D tumor spheroids composed of HT-29 cells grown under normoxic (20% O2) condition for 48 hours and then maintained under normoxic or hypoxic (1% O2) condition for 24 hours (day 3) before being treated with RNP (20 μM) for 1 hour. NTR inhibition studies were performed by treating the hypoxic HT-29 spheroids with 200 μM dicoumarol (DC) for 1 hour before the addition of RNP. The spheroids were fixed in 4% paraformaldehyde and imaged with the emission filter channels, Cy5 (663–737 nm), Cy7 (780–900 nm), length scale 270 μm. (b) Quantification for Cy7/Cy5 fluorescence ratio for N = 12 HT-29 spheroids for each hypoxia or hypoxia condition, N = 5 spheroids for hypoxia + DC condition. (c) Quantification of the hypoxia biomarkers Carbonic Anhydrase IX (CA-IX) and Hypoxia Inducible Factor 1α (HIF-1α) in HT-29 or U87 spheroids (N = 6 or 7 images of sectioned spheroids per cell-line per condition) visualized in thin spheroid cryosections by immunohistochemical staining. (d) Representative images of thin sectioned HT-29 and U87 tumor spheroids with immunohistochemical staining of the nucleus (blue) and proliferation biomarker Ki67 (brown) showing no necrotic core. n.s. (not significant) p > 0.05, *p ≤ 0.05, **p ≤ 0.01.
The presence of hypoxic cells in the tumor spheroids was confirmed by spheroid cryosectioning and immunohistochemical detection of the hypoxia biomarkers Carbonic Anhydrase IX (CA-IX) and HIF-1α in the thin slices (6 μm) (Fig. 4c, S15 and S16†).45 Moreover, there were more hypoxic cells within the spheroids that were maintained under hypoxic conditions (1% O2) for the last 24 hours (day 3), and immunohistochemical staining of the proliferation biomarker Ki67 confirmed that the spheroids, after three-days post-seeding, had not developed a quiescent or necrotic core (Fig. 4d and S17†). A goal of future research is to use this new imaging method to delineate the different spheroid structural factors for their capacity to trigger formation of a hypoxic core.
Conclusions
The inability to image the individual cells within a multicellular tumor spheroid using visible light microscopy requires researchers to conduct time and resource intensive procedures like thin sectioning or optical clearing.46 Non-invasive near-infrared fluorescence imaging (optical sectioning) of intact spheroids with cellular or subcellular resolution has the potential to transform the way that tumor spheroids are studied.47 The results reported here demonstrate that RNP possesses all the performance attributes to be an effective ratiometric near-infrared fluorescent probe for 3D visualization of individual hypoxic cells within intact multicellular tumor spheroids. Moreover, there is high potential for further employment of RNP as a near-infrared fluorescent probe for ratiometric imaging of hypoxic tissue in living subjects.
Data availability
All experimental procedures and associated data are provided in the ESI.†
Author contributions
J. M. designed and conducted the biological experiments, Z. Z. synthesized and characterized the fluorescent probe, A. B. conducted immunohistochemistry staining and analysis, M. D. and B. S. supervised the project, and all co-authors wrote and edited the manuscript.
Conflicts of interest
There are no conflicts to declare.
Supplementary Material
Acknowledgments
We are grateful for funding by the NIH (R35GM136212, K22CA258410, and T32GM075762) and Harper Cancer Research Institute (IITP Fellowship), and we acknowledge expert technical assistance from Dr M. Lee (mass spectrometry), Dr S. S. R. Kommidi (molecular computations) and Dr S. Cole (optical microscopy core within the Notre Dame Integrated Imaging Facility).
Electronic supplementary information (ESI) available: Synthesis and compound characterization, enzyme kinetic profiles, imaging and immunohistochemistry data, mp4 movies showing rotating Z-stack images of tumor spheroid sections. See DOI: https://doi.org/10.1039/d3sc06058f
Footnotes
The fluorescence changes enabled the Michaelis–Menten parameters to be determined as Km = 6.6 μM, and Vmax = 2.4 μM s−1 (Fig. S7) which indicates RNP is an efficient NTR substrate.27 Limit of detection studies observed a linear relationship in the range of [NTR] 1–10 μg mL−1 and a detection limit of 0.3 μg mL−1 which compares favorably with other previously published NTR probes (Fig. S8). Dicoumarol is a known inhibitor of NTR enzymes and the IC50 value for inhibiting NTR conversion of RNP to RNPon was determined to be 208 μM (Fig. S9).
In our hands, A549 cells did not form robust spheroids and could not be imaged.
This contrasts with the behaviour of more lipophilic near-infrared dyes which immediately partition into a tumor spheroid's peripheral cells and then slowly diffuse towards the spheroid center over multiple hours.48
Notes and references
- Henze A. T. Mazzone M. J. Clin. Invest. 2016;126:3672–3679. doi: 10.1172/JCI84427. [DOI] [PMC free article] [PubMed] [Google Scholar]
- Abou Khouzam R. Brodaczewska K. Filipiak A. Zeinelabdin N. A. Buart S. Szczylik C. Kieda C. Chouaib S. Front. Immunol. 2021;11:1–16. doi: 10.3389/fimmu.2020.613114. [DOI] [PMC free article] [PubMed] [Google Scholar]
- Swartz H. M. Flood A. B. Schaner P. E. Halpern H. Williams B. B. Pogue B. W. Gallez B. Vaupel P. Physiol. Rep. 2020;8:1–20. doi: 10.14814/phy2.14541. [DOI] [PMC free article] [PubMed] [Google Scholar]
- Doctorman S. Wu F. Gilkes D. M. Cells. 2022;11:686. doi: 10.3390/cells11040686. [DOI] [PMC free article] [PubMed] [Google Scholar]
- Bruemmer K. J. Crossley S. W. M. Chang C. J. Angew. Chem., Int. Ed. 2020;59:13734–13762. doi: 10.1002/anie.201909690. [DOI] [PMC free article] [PubMed] [Google Scholar]
- Chen C. Tian R. Zeng Y. Chu C. Liu G. Bioconjugate Chem. 2020;31:276–292. doi: 10.1021/acs.bioconjchem.9b00734. [DOI] [PubMed] [Google Scholar]
- Qi Y. L. Guo L. Chen L. L. Li H. Yang Y. S. Jiang A. Q. Zhu H. L. Coord. Chem. Rev. 2020;421:213460. doi: 10.1016/j.ccr.2020.213460. [DOI] [Google Scholar]
- Janczy-Cempa E. Mazuryk O. Kania A. Brindell M. Cancers. 2022;14:2686. doi: 10.3390/cancers14112686. [DOI] [PMC free article] [PubMed] [Google Scholar]
- Das S. Indurthi H. K. Asati P. Sharma D. K. ChemistrySelect. 2022;7:e202102895. doi: 10.1002/slct.202102895. [DOI] [Google Scholar]
- Bonnitcha P. Grieve S. Figtree G. Free Radical Biol. Med. 2018;126:296–312. doi: 10.1016/j.freeradbiomed.2018.08.019. [DOI] [PubMed] [Google Scholar]
- Chen S. Yu S. Du Z. Huang X. He M. Long S. Liu J. Lan Y. Yang D. Wang H. Li S. Chen A. Hao Y. Su Y. Wang C. Luo S. J. Med. Chem. 2021;64:3381–3391. doi: 10.1021/acs.jmedchem.0c02250. [DOI] [PubMed] [Google Scholar]
- Zhang S. Chen H. Wang L. Qin X. Jiang B. P. Ji S. C. Shen X. C. Liang H. Angew. Chem., Int. Ed. 2022;61:e202107076. doi: 10.1002/anie.202107076. [DOI] [PubMed] [Google Scholar]
- Cui L. Zhong Y. Zhu W. Xu Y. Du Q. Org. Lett. 2011;13:928–931. doi: 10.1021/ol102975t. [DOI] [PubMed] [Google Scholar]
- Kim S. J. Yoon J. W. Yoon S. A. Lee M. H. Molecules. 2021;26:1088. doi: 10.3390/molecules26041088. [DOI] [PMC free article] [PubMed] [Google Scholar]
- Wen Y. Zhang S. Yuan W. Feng W. Li F. Anal. Chem. 2023;95:2478–2486. doi: 10.1021/acs.analchem.2c04764. [DOI] [PubMed] [Google Scholar]
- Liu Y. Teng L. Chen L. Ma H. Liu H. W. Zhang X. B. Chem. Sci. 2018;9:5347–5353. doi: 10.1039/C8SC01684D. [DOI] [PMC free article] [PubMed] [Google Scholar]
- Sarkar S. Lee H. Ryu H. G. Singha S. Lee Y. M. Reo Y. J. Jun Y. W. Kim K. H. Kim W. J. Ahn K. H. ACS Sens. 2021;6:148–155. doi: 10.1021/acssensors.0c01989. [DOI] [PubMed] [Google Scholar]
- Zhu D. Xue L. Li G. Jiang H. Sens. Actuators, B. 2016;222:419–424. doi: 10.1016/j.snb.2015.08.093. [DOI] [Google Scholar]
- Zhang Z. Feng Q. Yang M. Tang Y. Sens. Actuators, B. 2020;318:128257. doi: 10.1016/j.snb.2020.128257. [DOI] [Google Scholar]
- Wu L. Huang C. Emery B. P. Sedgwick A. C. Bull S. D. He X. P. Tian H. Yoon J. Sessler J. L. James T. D. Chem. Soc. Rev. 2020;49:5110–5139. doi: 10.1039/C9CS00318E. [DOI] [PMC free article] [PubMed] [Google Scholar]
- Savariar E. N. Felsen C. N. Nashi N. Jiang T. Ellies L. G. Steinbach P. Tsien R. Y. Nguyen Q. T. Cancer Res. 2013;73:855–864. doi: 10.1158/0008-5472.CAN-12-2969. [DOI] [PMC free article] [PubMed] [Google Scholar]
- Miampamba M. Liu J. Harootunian A. Gale A. J. Baird S. Chen S. L. Nguyen Q. T. Tsien R. Y. González J. E. Theranostics. 2017;7:3369–3386. doi: 10.7150/thno.20678. [DOI] [PMC free article] [PubMed] [Google Scholar]
- Zhang R. Yang J. Radford D. C. Fang Y. Kopeček J. Macromol. Biosci. 2017;17:1–8. doi: 10.1002/mabi.201600125. [DOI] [PubMed] [Google Scholar]
- Faucher F. F. Liu K. J. Cosco E. D. Widen J. C. Sorger J. Guerra M. Bogyo M. ACS Cent. Sci. 2023;9:1059–1069. doi: 10.1021/acscentsci.3c00261. [DOI] [PMC free article] [PubMed] [Google Scholar]
- Kiyose K. Hanaoka K. Oushiki D. Nakamura T. Kajimura M. Suematsu M. Nishimatsu H. Yamane T. Terai T. Hirata Y. Nagano T. J. Am. Chem. Soc. 2010;132:15846–15848. doi: 10.1021/ja105937q. [DOI] [PubMed] [Google Scholar]
- Feng X. Li Y. Zhang S. Li C. Tian J. J. Nanobiotechnol. 2022;20:1–15. doi: 10.1186/s12951-021-01184-w. [DOI] [PMC free article] [PubMed] [Google Scholar]
- Atkinson K. M. Morsby J. J. Kommidi S. S. R. Smith B. D. Org. Biomol. Chem. 2021;19:4100–4106. doi: 10.1039/D1OB00426C. [DOI] [PMC free article] [PubMed] [Google Scholar]
- Morsby J. J. Atkinson K. M. Kommidi S. S. R. Freel T. Janekova H. Stacko P. Smith B. D. Eur. J. Org Chem. 2022:e202200270. doi: 10.1002/ejoc.202200270. [DOI] [PMC free article] [PubMed] [Google Scholar]
- Hettie K. S. Klockow J. L. Moon E. J. Giaccia A. J. Chin F. T. Cancer Rep. 2021;4:e1384. doi: 10.1002/cnr2.1384. [DOI] [PMC free article] [PubMed] [Google Scholar]
- Kong F. Li Y. Yang C. Li X. Wu J. Liu X. Gao X. Xu K. Tang B. J. Mater. Chem. B. 2019;7:6822–6827. doi: 10.1039/C9TB01581G. [DOI] [PubMed] [Google Scholar]
- Nagelkerke A. Bussink J. Mujcic H. Wouters B. G. Lehmann S. Sweep F. C. G. J. Span P. N. Breast Cancer Res. 2013;15:R2. doi: 10.1186/bcr3373. [DOI] [PMC free article] [PubMed] [Google Scholar]
- O'Connor L. J. Mistry I. N. Collins S. L. Folkes L. K. Brown G. Conway S. J. Hammond E. M. ACS Cent. Sci. 2017;3:20–30. doi: 10.1021/acscentsci.6b00276. [DOI] [PMC free article] [PubMed] [Google Scholar]
- Nunes A. S. Barros A. S. Costa E. C. Moreira A. F. Correia I. J. Biotechnol. Bioeng. 2019;116:206–226. doi: 10.1002/bit.26845. [DOI] [PubMed] [Google Scholar]
- Zanoni M. Piccinini F. Arienti C. Zamagni A. Santi S. Polico R. Bevilacqua A. Tesei A. Sci. Rep. 2016;6:1–11. doi: 10.1038/s41598-016-0001-8. [DOI] [PMC free article] [PubMed] [Google Scholar]
- Lazzari G. Vinciguerra D. Balasso A. Nicolas V. Goudin N. Garfa-Traore M. Fehér A. Dinnyés A. Nicolas J. Couvreur P. Mura S. Eur. J. Pharm. Biopharm. 2019;142:195–203. doi: 10.1016/j.ejpb.2019.06.019. [DOI] [PubMed] [Google Scholar]
- Spoerri L. Gunasingh G. Haass N. K. Front. Digit. Heal. 2021;3:668390. doi: 10.3389/fdgth.2021.668390. [DOI] [PMC free article] [PubMed] [Google Scholar]
- Wallabregue A. L. D. Bolland H. Faulkner S. Hammond E. M. Conway S. J. J. Am. Chem. Soc. 2023;145:2572–2583. doi: 10.1021/jacs.2c12493. [DOI] [PMC free article] [PubMed] [Google Scholar]
- Close D. A. Johnston P. A. SLAS Discovery. 2022;27:39–54. doi: 10.1016/j.slasd.2021.10.008. [DOI] [PubMed] [Google Scholar]
- Tanaka Y. Nishikawa M. Mizukami Y. Kusamori K. Ogino Y. Nishimura S. Shimizu K. Konishi S. Takahashi Y. Takakura Y. J. Control. Release. 2018;270:177–183. doi: 10.1016/j.jconrel.2017.12.006. [DOI] [PubMed] [Google Scholar]
- Liu Y. Yan W. Li H. Peng H. Suo X. Li Z. Liu H. Zhang J. Wang S. Liu D. Anal. Methods. 2019;11:421–426. doi: 10.1039/C8AY02638F. [DOI] [Google Scholar]
- Ware M. J. Colbert K. Keshishian V. Ho J. Corr S. J. Curley S. A. Godin B. Tissue Eng., Part C. 2016;22:312–321. doi: 10.1089/ten.tec.2015.0280. [DOI] [PMC free article] [PubMed] [Google Scholar]
- Riffle S. Pandey R. N. Albert M. Hegde R. S. BMC Cancer. 2017;17:1–12. doi: 10.1186/s12885-017-3319-0. [DOI] [PMC free article] [PubMed] [Google Scholar]
- Shen Z. Prasai B. Nakamura Y. Kobayashi H. Jackson M. S. McCarley R. L. ACS Chem. Biol. 2017;12:1121–1132. doi: 10.1021/acschembio.6b01094. [DOI] [PMC free article] [PubMed] [Google Scholar]
- Manton J. D. Philos. Trans. R. Soc., A. 2022;380:20210109. doi: 10.1098/rsta.2021.0109. [DOI] [PMC free article] [PubMed] [Google Scholar]
- Yang J. Ledaki I. Turley H. Gatter K. C. Montero J. C. M. Li J. L. Harris A. L. Ann. N. Y. Acad. Sci. 2009;1177:185–197. doi: 10.1111/j.1749-6632.2009.05027.x. [DOI] [PubMed] [Google Scholar]
- Nürnberg E. Vitacolonna M. Klicks J. von Molitor E. Cesetti T. Keller F. Bruch R. Ertongur-Fauth T. Riedel K. Scholz P. Lau T. Schneider R. Meier J. Hafner M. Rudolf R. Front. Mol. Biosci. 2020;7:1–19. doi: 10.3389/fmolb.2020.00001. [DOI] [PMC free article] [PubMed] [Google Scholar]
- Van Zundert I. Maenhoudt N. De Vriendt S. Vankelecom H. Fortuni B. Rocha S. Bio-Protoc. 2022;12:1–21. doi: 10.21769/BioProtoc.4469. [DOI] [PMC free article] [PubMed] [Google Scholar]
- Egloff-Juras C. Yakavets I. Scherrer V. Francois A. Bezdetnaya L. Lassalle H. P. Dolivet G. Int. J. Mol. Sci. 2021;22:1–12. doi: 10.3390/ijms22041966. [DOI] [PMC free article] [PubMed] [Google Scholar]
Associated Data
This section collects any data citations, data availability statements, or supplementary materials included in this article.
Supplementary Materials
Data Availability Statement
All experimental procedures and associated data are provided in the ESI.†


