

Abstract
Purpose:
To evaluate multiparametric MRI features in predicting pathologic response after preoperative chemoradiation therapy (CRT) for locally advanced rectal cancer (LARC).
Experimental Design:
Forty-eight consecutive patients (January 2012–November 2014) receiving neoadjuvant CRT were enrolled. All underwent anatomical T1/T2, diffusion-weighted MRI (DWI) and dynamic contrast-enhanced (DCE) MRI before CRT. A total of 103 imaging features, analyzed using both volume-averaged and voxelized methods, were extracted for each patient. Univariate analyses were performed to evaluate the capability of each individual parameter in predicting pathologic complete response (pCR) or good response (GR) evaluated based on tumor regression grade. Artificial neural network with 4-fold validation technique was further utilized to select the best predictor sets to classify different response groups and the predictive performance was calculated using receiver operating characteristic (ROC) curves.
Results:
The conventional volume-averaged analysis could provide an area under ROC curve (AUC) ranging from 0.54 to 0.73 in predicting pCR. While if the models were replaced by voxelized heterogeneity analysis, the prediction accuracy measured by AUC could be improved to 0.71–0.79. Similar results were found for GR prediction. In addition, each subcategory images could generate moderate power in predicting the response, which if combining all information together, the AUC could be further improved to 0.84 for pCR and 0.89 for GR prediction, respectively.
Conclusions:
Through a systematic analysis of multiparametric MR imaging features, we are able to build models with improved predictive value over conventional imaging metrics. The results are encouraging, suggesting the wealth of imaging radiomics should be further explored to help tailoring the treatment into the era of personalized medicine.
Introduction
For locally advanced rectal cancer (LARC), the standard-of-care treatment is preoperative concurrent chemoradiation treatment (CRT) followed by total mesorectal excision (TME; refs. 1, 2). After CRT, approximately 15% to 27% of patients show a pathologic complete response (pCR; refs. 3, 4). In those who achieve a pCR, some investigators have questioned the use of TME surgery, because TME is associated with significant morbidity and functional complications, particularly for abdominoperineal resection. Habr-Gama and colleagues suggested a “wait-and-see” policy based on the results that the clinical complete responders had excellent long-term results regardless of surgical resection (5). Maas and colleagues confirmed the results in a small prospective study (6). Furthermore, Borschitz and colleagues recently reported that the local recurrence rate was 0% for pCR who had been treated with local excision (7). Accordingly, although still in debate, it is important to provide physicians with accurate information using noninvasive approaches to identify complete responders for an alternative surgical treatment such as sphincter-saving local excision.
Previous studies have highlighted several imaging modalities for their capability to distinguish good responders from others for LARC. Examples are FDG-PET (8), T2-weighted magnetic resonance imaging (T2w-MRI) (9), dynamic contrast-enhanced MR (DCE-MRI; ref. 10) and diffusion-weighted imaging (DWI; refs. 11, 12). However, all previous works focused on single imaging modality, which may have inherent limitations in prognostic prediction. It has been shown that T2w-MRI has limitations in the depiction of primary tumors and mesorectal fascia, or residual viable tumor from diffuse fibrotic change (13, 14). Also, FDG-PET suffers from limitations in interpreting fibrotic scar tissue and inflammation (15). Functional MRI such as DWI with the apparent diffusion coefficient (ADC) assesses the impedance of water molecules diffusion that is mostly dependent on the tissue cellularity (16–18). DCE-MRI, on the other hand, measures a volume transfer constant, which is dependent on the perfusion and the permeability of the tumor vasculature (19). Assessment of individual tumor biology is likely not a property of single imaging tool but instead needs information from a combination of multiple modalities. Moreover, all previous studies considered a tumor as a uniform entity by using a mean value to depict the whole volume. This may have the potential risk of overlooking tumor heterogeneity. In some cases, the tumor can be sequestered and disappear partly or completely. In other cases, the tumor may undergo necrosis or liquefaction and become avascular or cystic. For this reason, voxel-wise analysis is an important tool to interrogate the most viable portions of the tumor.
In this present work, we investigate the wealth of multiparametric MR image features in prediction of pathologic response for LARC. Our work integrates the anatomical MRI for tumor phonotype extraction, perfusion MRI for blood flow and permeability analysis, and diffusion MRI for tissue microcirculation and cellularity evaluation. All imaging parameters were analyzed using both volume-averaged and voxelized analysis.
Methods and Materials
Patients
Consecutive patients with MRI-staged T3 or T4 rectal cancer without distant metastasis treated at a single institute between January 2012 and November 2014 were enrolled. All patients received preoperative chemoradiation followed by TME surgery. The treatment protocol and timeline followed the National Comprehensive Cancer Network (NCCN) guideline. The radiation treatment included 50 Gy delivered for 25 fractions using IMRT technique. Concurrently, patients received capecitabine 825 mg/m2 orally, twice daily for 5 consecutive weeks and oxaliplatin 100 mg/m2 once every 3 weeks. One extra cycle of additional chemotherapy was administrated after CRT and before surgical resection. According to the recent meta-analysis of over 6,171 patients, oral capecitabine and 5-fluorouracil (5-FU) can be used interchangeably for patients with colorectal cancer (20). In the present study, our patients received FOLFOX-6 (5-fluorouracil plus oxaliplatin for 34 patients) or CapeOx (Capecitabine plus oxaliplatin for 14 patients) for the additional chemotherapy. Then, after a recovery interval of 2 weeks, TME was performed by either anterior resection or abdominoperineal resection. All patients received MR examinations 1 to 2 weeks before the chemoradiation and 1 week before surgery. The pathologic staging served as the reference standard and was determined according to the TNM classification system recommended by the American Joint Committee on Cancer (AJCC), 7th ed., 2012 (21). The resection specimens were evaluated by an experienced pathologist and further reviewed by a dedicated gastrointestinal pathologist, both blinded to the MRI data. Patients were separated into different response groups as pathologic complete responders (pCR, defined as the absence of viable adenocarcinoma cells, ypT0N0) versus non-pCR. The modified tumor regression grade (TRG) based on Ryan’s definition (22) was also used to separate the patients into good responders (GR) and non-GR group. The GR included those showing complete response with no viable cancer cells (TRG 0) and moderate response with only small cluster or isolated cancer cells remaining (TRG 1). The non-GR included TRG 2: minimal response with residual cancer remaining but with predominate fibrosis and TRG 3: poor response with minimal or no tumor kill and extensive residue cancer.
MRI protocols
All patients were scanned in a single institute with 3.0 Telsa MR (Signa HDxt, GE Medical Systems) using a phased-array body coil, 1 or 2 weeks before the start of chemoradiation with fixed image protocols. No special bowel preparation was performed. The MR machine underwent quality assurance check on a monthly basis by a hospital radiological physicist and further maintained on a bimonthly basis by the GE engineer to ensure the consistency of image quality. Axial T2-weighted (T2w fast spin echo sequence, TR/TE: 2,840/131 ms, image resolution 0.49 × 0.49 × 4 mm) and T1-weighted (T1w spin echo sequence, TR/TE: 460/7.4 ms) maps were acquired. Array spatial sensitivity encoding technique (ASSET) was used with acceleration factor of 2. Then multiphase T1w were obtained using a spoiled gradient echo sequence (LAVA). Scan parameters were TR/TE 4.4/1.9 ms; flip angle 12°; bandwidth 325.5 kHz; image resolution: 0.7 × 0.7 × 2 mm. All patients were injected with 0.1 mmol/kg body-weight Gd-DTPA at 2.5 mL/s. Contrast injection and data acquisition were trigged simultaneously. Four repetitions were acquired with one repetition before the injection of contrast agent, and three at 15 seconds, 60 seconds, and 120 seconds after the injection. Axial DWI images were obtained by using single-shot echo planar imaging sequence (SSEPI; TR/TE 5,900/69.6 ms; image resolution: 0.98 × 0.98 × 5 mm; 2 mm intersection gap) with two b-factors of 0 and 800 s/mm2.
Quantitative imaging characteristics
All images were reviewed on MIM-Maestro workstation (MIM-software) by a single experienced rectal MRI radiologist. Tumors were outlined as a region of interest (ROI), excluding the intestinal lumen, on the third-phase gadolinium-enhanced images (60 seconds after the injection of contrast agent) while using all other image sequences as references. The delineated tumor was then automatically transferred to other image maps. Quantitative imaging descriptors were extracted for each imaging category using both mean value–based and voxelized analysis techniques: (i) For anatomical MRI, 37 parameters were calculated. The preCRT volume information was recorded first. The local variations of the image gray levels within the tumor volume were analyzed using 18 Haralick’s Gray Level Co-occurrence Matrix (GLCM) texture features (autocorrelation, cluster prominence, cluster shade, contrast, correlation, dissimilarity, energy, entropy, homogeneity 1, homogeneity 2, maximum probability, sum average, sum variance, sum entropy, difference variance, difference entropy, information measure of correlation 1, information measure of correlation 2) for T1w and T2w-MRI, respectively (22). (ii) Regarding DCE-MRI, a total of 35 imaging features were collected. The time–intensity curves (TIC) were first obtained for each voxel. For each TIC, mean values of 5 shape descriptors were calculated: the maximum signal difference (MSD) as defined by Petrillo and colleagues (23), the wash-in slope of E1 (15 seconds after contrast), E2 (60 seconds after contrast), E3 (120 seconds after contrast) and the washout slope between E2 and E3. Local variations of the enhancement among each voxel were calculated using 18 GLCM texture features. Furthermore, for each parameter the population distribution curve was generated, 12 histogram-based features as 10%, 20%... 90% to 100% values, kurtosis and skewness were obtained. (iii) For diffusion MR images, the ADC maps were calculated according to the formula: . ADC, where and are the signal intensities in ROI, obtained with different gradient factors (b values of 0, and 800 s/mm2). Mean values to represent the whole tumor region and voxel-based 18 texture/12 histogram-based features were calculated. A total of 103 quantitative imaging features were obtained for each patient.
Statistical analysis
Individual variables were analyzed for significant differences using t test and the Wilcoxon—Mann–Whitney test for nonnormally distributed parameters. Group results were reported as mean ± standard deviations. Group difference comparison with a two-sided P < 0.05 was considered statistically significant. The univariate analysis was carried out to evaluate the ability of single descriptor to discriminate pCR from non-pCR and GR from non-GR. These analyses were performed using SPSS 16.0 (SPSS Inc.). Because many parameters were generated, and they were possibly highly correlated, a three-layer perceptron artificial neural network (ANN) was utilized to analyze the dataset. Two steps were involved, with the first step, feature selection, to identify an optimal feature and the second step, called feature classification, to train an optimal ANN architecture for response prediction. (i) For the first step, all parameters were included as the input nodes for ANN modeling, and the output node was one representing responder/nonresponder decision. The node in the hidden layer was set based on the formula of , where is the number of the hidden nodes, and is the number of nodes in the input layer, is the number of nodes in the output layer, and a is a constant from 1 to 10 (24). In this study, a was arbitrarily selected as 5 in the first step. The forward search strategy was used to search different combinations of predictors by adding predictors one by one to see if the model performance improved. The feature selection was performed within each set of anatomical MRI, DWI, DCE-MRI, respectively, and the combination of all. To control for overfitting, the rule of thumb is that the number of predictors should remain within 1/10–1/3 of the number in the dependent group. The potential feature was limited to no more than 3 for the pathologic response prediction (11 pCR) and 4 for the TRG good-response prediction (17 non-GR). (ii) After the optimal feature set was identified, an optimal ANN architecture was trained for the response prediction as the second step. For training of the model, the feed-forward back propagation (FFBP) learning process was implemented. In forward processing, the input layer was used to input the data, then hidden layer processed the data. Assume is the synaptic input to the neuron, is a vector of weights of a particular neuron at the th step of learning, logistic sigmoid function is used as the activation function between neurons as
| (1) |
The training started with small random numbers for the initial weightings, and calculated the error function from the output neuron with mean square error (MSE) equation as
| (2) |
where and represent the desired and obtained outputs of the neurons, respectively. The error from equation above was then back propagated by updating the weights, , using gradient descent method. The equation of weights adjustment of each neuron is
| (3) |
where is the learning rate. The number of hidden nodes (from 2 to 31, with step size 1), the learning rate (0.1–0.7) were varied for the ANN training. The learning rate η regulates the stride of gradient descent algorithm for minimization of the learning error with higher number for fast convergence but a possibility to jump over the global minimum. We adjusted the learning rate by a 5% increase if the current error was less than the previous one, indicating moving in the right direction. Otherwise, the system went back with a smaller steep by decreasing the learning rate 15%. The learning process continued until converged to a predefined value (<0.001) or until the maximum number of iterations, of 1,000, was reached. If several architectures reached similar accuracy, the less complex architecture was defined as the most optimal ANN model. All ANN simulations were performed in the Matlab Neural Network ToolBox, software eversion 7.12 (The Mathworks Inc.). The final predictive performance of the response was investigated using 4-fold cross-validation. The cohort was randomly separated into four partitions, with three partitions used as the training data sets and the remaining one as the testing set. ANN was optimized using the training data set, and the outcome of the testing data was then predicted by the optimized ANN model. The training and testing were run 4 times, and the average performance was reported as the cross-validated performance. The prediction results were further interpreted using the receiver operating characteristic (ROC) curve.
Results
Patient characteristics
A total of 48 patients (59.9 ± 8.9 years, from January 2012 to November 2014) were included in the study. Among which, 11 (23%) were classified as pCR and 37 (77%) were non-pCR, 31 were GR (TRG 0–1, 65%) and 17 were non-GR (TRG 2–3, 35%). The detailed clinical characteristics are listed in Table 1. There were no statistical differences between pCR versus non-pCR or GR versus non-GR groups in types of age, sex, and TNM stage. Figure 1 gives two patients’ example, both 60 years old with mid-rectum cancer at stage of cT3N+M0. But after treatment, one became pCR and the other did not achieve pCR. No significant differences were observed from qualitative visual inspection.
Table 1.
Patient and tumor characteristics
| pCR (n = 11) | Non-pCR (n = 37) | P | GR (n = 31) | Non-GR (n = 17) | P | |
|---|---|---|---|---|---|---|
| Patients (n = 48) | ||||||
| Male:female | 7:4 | 23:14 | ns | 20:11 | 10:7 | ns |
| Mean age (SD) | 59.7 (11.1) | 59.9 (8.3) | ns | 59.4 (9.1) | 60.8 (8.7) | ns |
| Tumor | ||||||
| Pre-CRT volume (in cc) | 19.6 ± 12.1 | 23.7 ± 13.4 | ns | 21.4 ± 18.6 | 27.1 ± 14.7 | 0.02 |
| Range | [5.4–66.7] | [9.9–45.4] | [5.4–66.7] | [9.9–45.4] | ||
| Pre-CRT clinical stage | ||||||
| cT3N0 | 0 | 4 (10.8%) | 0 | 4 (23.5%) | ||
| cT3N+ | 11 (100%) | 26 (70.3%) | 26 (83.9%) | 11 (64.7%) | ||
| cT4N0 | 0 | 0 | 0 | 0 | ||
| cT4N+ | 0 | 7 (18.9%) | 5 (16.1%) | 2 (11.8%) | ||
| Post-CRT clinical stage | ||||||
| pT0N0 | 11 (100%) | 0 | <0.001 | 11 (35.5%) | 0 | <0.001 |
| pT1N0 | 0 | 6 (16.2%) | 6 (19.4%) | 0 | ||
| pT2N0 | 0 | 6 (16.2%) | 6 (19.4%) | 0 | ||
| pT2N+ | 0 | 5 (13.6%) | 4 (12.9%) | 1 (5.9%) | ||
| pT3N0 | 0 | 10 (27%) | 3 (9.7%) | 7 (41.2%) | ||
| pT3N+ | 0 | 8 (21.6%) | 1 (3.1%) | 7 (41.2%) | ||
| pT4N0 | 0 | 2 (5.4%) | 0 | 2 (11.7%) | ||
| pT4N+ | 0 | 0 | 0 | 0 | ||
Abbreviations: ns, not statistically significant; SD, standard deviation.
Figure 1.
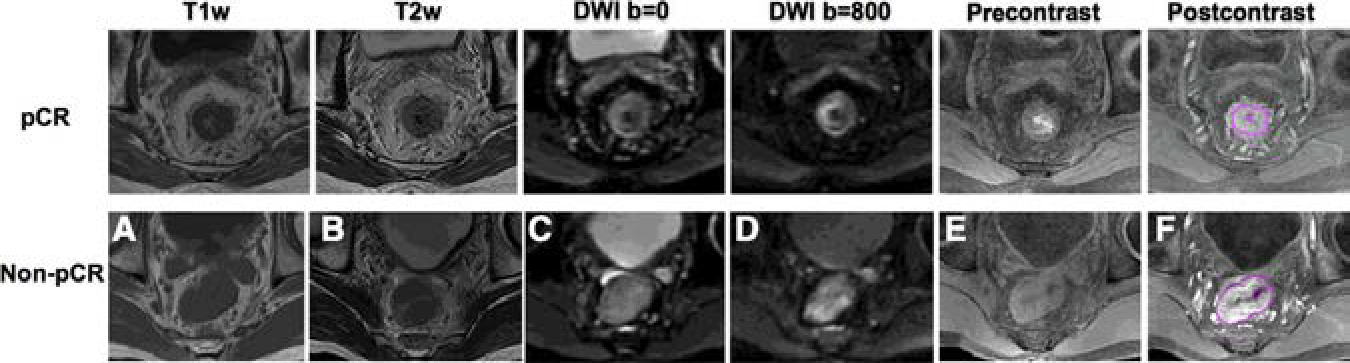
MR images of 2 male patients, both at 60 years old with mid-rectum cancer at stage of cT3N+M0, pretreatment (A) T1-weighted image, (B) T2-weighted image, (C) the diffusion-weighted image with b = 0, (D) the diffusion weighted image with b=800, (E) precontrast image, (F) 60 seconds after contrast injection image.
Group differences
The pCR and non-pCR groups were homogeneous with respect to pretreatment tumor volume. The pCR group has a mean volume of 19.6 ± 12.1 cc with a range of [5.4–66.7 cc], and non-pCR group has a mean volume of 23.7 ± 13.4 cc [9.9–45.4 cc]. The majority of the 18 GLCM texture features from anatomical T1w-MRI and T2w-MRI showed significant differences between two response groups with P < 0.05. For example, GLCM-Energy measures the uniformity of the gray-level scales of the image with higher value implying more homogeneous distribution. Its value from T2w-MRI was higher for the pCR group (0.987 ± 0.003, range from [0.980–0.992]) versus non-pCR group (0.982 ± 0.006 [0.971–0.991]) with P = 0.03. Regarding the DWI, the mean-ADC values were significantly lower for pCR (0.90 ± 0.11 [0.77–1.14]×10−3) versus non-pCR (0.97 ± 0.09 [0.81–1.37] × 103) with P = 0.005. In addition, the higher portions of the histogram percentiles (50%–80%) were lower in the pCR groups than in non-pCR with P ≤ 0.02. Only a few texture features (GLCM-Homogeneity and GLCM-Difference Entropy) from the ADC maps showed marginal significant difference between groups with P < 0.05. With respect to the DCE-MRI, neither the MSD over the whole tumor volume nor the histogram-based parameters showed differences between groups. However, most of the texture features had significant differences in separating response groups with all P ≤ 0.03. For example, GLCM-Autocorrelation, a measure of the fineness of texture with higher value indicating more gray-level scales, thus more heterogeneous distribution, was lower in the pCR group (1.13 ± 0.08 [1.00–1.25]) compared with that in the non-pCR group (1.21 ± 0.08 [1.02–1.41]) with P = 0.008. GLCM-Entropy, a measure of the local intensity variation with higher value correlating with larger image variation and more heterogeneous distribution, was also lower in the pCR group (0.018 ± 0.010 [0.002–0.030]) than in the non-pCR group with an average value of 0.026 ± 0.008 [0.006–0.044] with P = 0.007. For illustration purposes, only a selected number of features are shown in Fig. 2, between pCR and non-pCR groups. If separating the patients based on the TRG, the GR group showed relatively smaller volume than the non-GR group, with P = 0.02. Other than that, none of the quantitative measures from anatomical T1, T2 images showed statistically significant differences. The GR group had lower mean-ADC (0.91 ± 0.11 [0.77–1.14]×10−3) than those showing non-favorable responses (0.97 ± 0.09 [0.81–1.37]×10−3) with P = 0.03. In addition, almost all the texture measures from DCE-MRI showed statistically significant differences between GR and non-GR groups. The detailed information about all obtained 103 image features separated in different response groups, pCR versus non-pCR and GR versus non-GR is included in the Supplementary Appendix.
Figure 2.
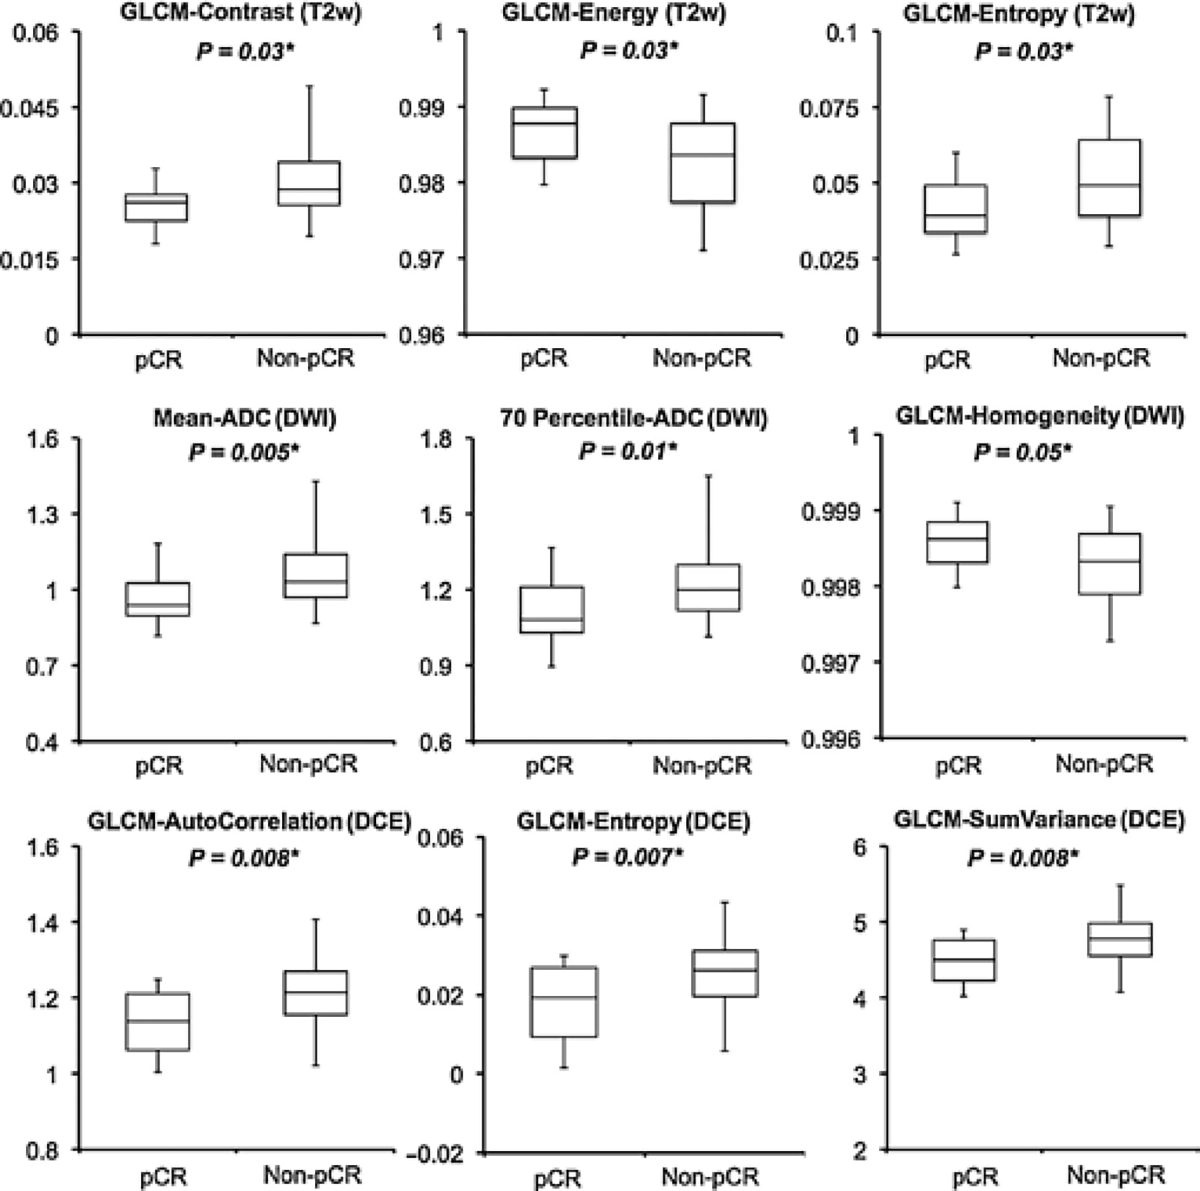
Boxplots showing group differences between the pCR versus non-pCR groups. Only a few selected parameters from each category of imaging modality are shown. *, statistically significant.
Prediction of individual parameters and combined feature sets
The ROC curves comparing the ability of each subcategory parameters and the combined feature sets in discriminating different response groups are displayed in Fig. 3. For pCR prediction, the volume average–based analysis, as volume from anatomical MRI, mean-MSD from DCE-MRI, mean-ADC from DWI, could yield an AUC of 0.67, 0.54, and 0.73. Using voxel-based analysis, the AUC could be improved to 0.71, 0.76, and 0.79, respectively. After combining all categories of image features together, with the best selected predictors as mean-ADC from DWI and GLCM_AutoCorrelation from DCE-MRI, the AUC could be further improved to 0.84. Of note, although the texture information from anatomical T1w and T2w images showed moderate predictive value, they were highly correlated with the textures extracted from DCE-MRI. As such, after combining all the features into ANN training, none of anatomical MRI parameters was selected. For the GR prediction based on the TRG evaluation, similar findings were that the voxelized heterogeneity analyses gave better AUCs than volume-averaged analysis. For example, in the subcategory of DCE-MRI, with the selected features as GLCM_Cluster Prominence and GLCM_Sum Variance, the ANN model could yield an AUC of 0.85. Using the volume-averaged analysis, the AUC was only 0.51, which was not predictive. Further, combining all categories of image information together, with the best feature set as Volume from anatomical MRI, GLCM_Cluster Prominence and GLCM_Information Measure of Correlation 2 from DCE_MRI, and mean-ADC from DWI, the final AUC could be improved to 0.89.
Figure 3.
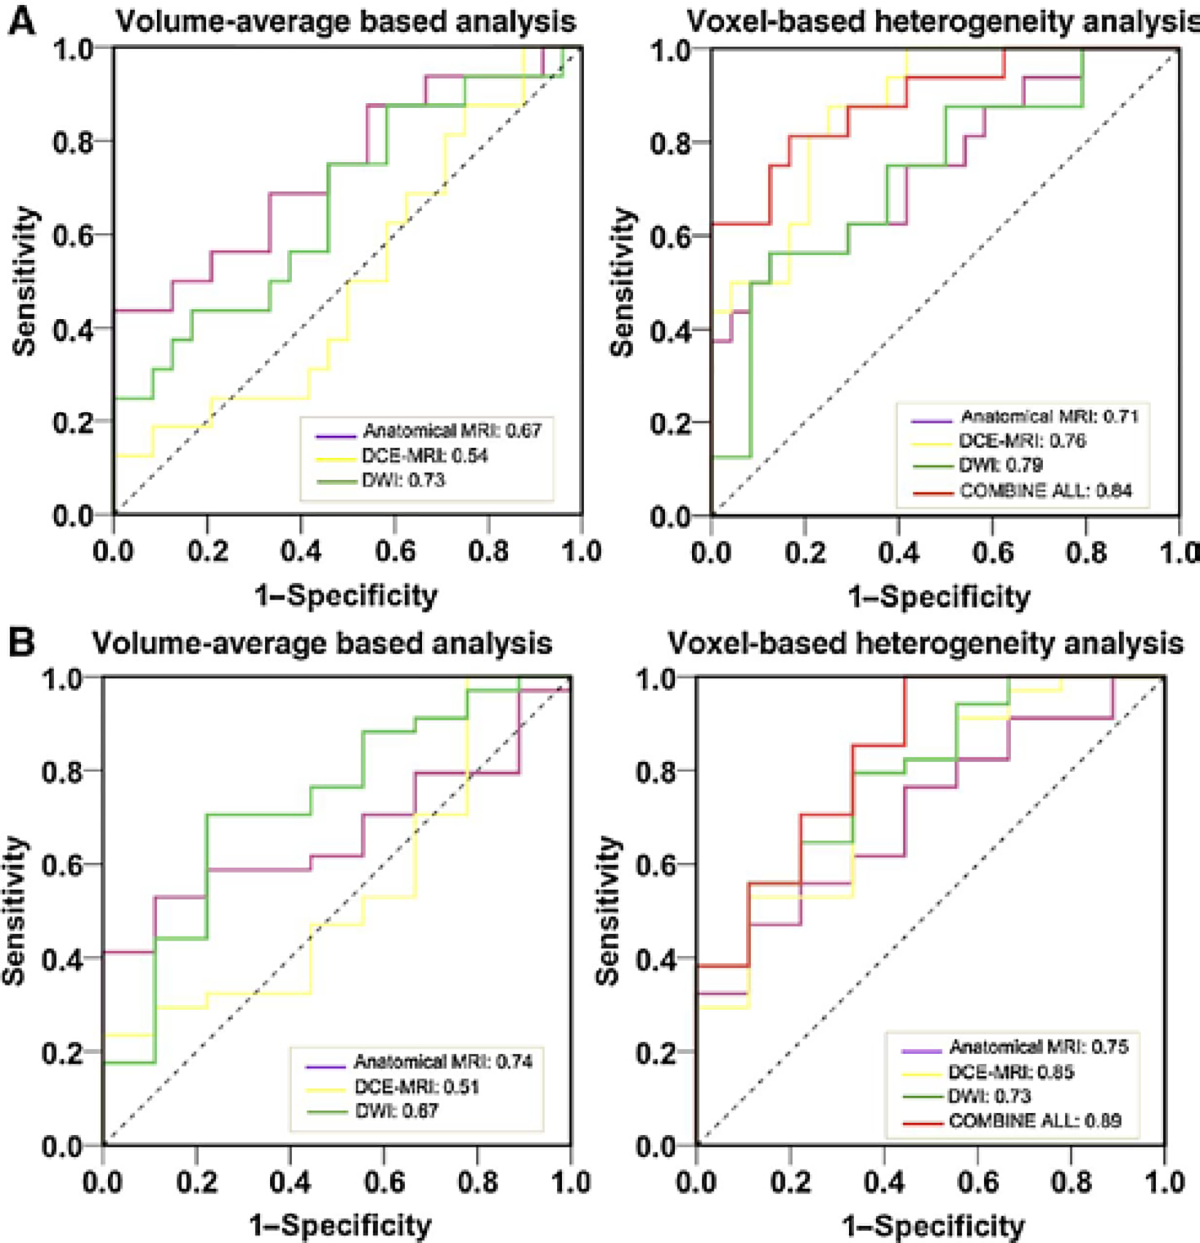
The ROC curves of selected individual parameters and combined feature sets in predicting pCR vs. non-pCR (A) and GR vs. non-GR (B). The AUC was reported.
Discussion
Previously, there have been a few studies evaluating the prognostic value of MRI in assessing the CRT outcome for LARC. Currently, all published studies including very recent work were conducted with comparable or less patient sample size, focusing mostly on single category of MRI with volume-averaged analysis. To the best of our knowledge, this is the first study to integrate anatomical, perfusion, and diffusion MRI using both volume-averaged and voxel-based quantitative analysis to predict pCR. The results showed that the voxelized heterogeneity analysis could provide additional information compared with conventional volume-averaged analysis in assessing the treatment outcome. In addition, although no imaging or serum test could precisely correlate with treatment outcome, these modalities, when used in combination, gave improved prognostication.
Currently, pathologic evaluation of the surgical specimen is the only reliable surrogate marker that correlates with long-term oncological outcome. However, such data are available only after completion of all preoperative treatment and surgery, which cannot be used as guidance for adjusting the therapeutic approach. Accordingly, development of noninvasive biomarkers with the potential to provide early prediction is essential. Such biomarkers would aid in identifying those patients who are less likely to benefit from the current therapies for alternative treatment or intensive follow-up regimens and those who are likely to achieve pCR for tailored surgery strategies.
Recently, additional DWI has merged with anatomical MRI as a preoperative staging tool for rectal cancer. Few studies have been conducted that seek its prognostic role in predicting the treatment outcome, yet the reported results remain controversial. Some studies revealed the significant correlation of the pretreatment mean-ADC with the response, as by Sun and colleagues on 37 patients (25), Lambrecht and colleagues on 20 patients (26), and most recently by Jacobs and colleagues on 22 patients (27), while Cai and colleagues (28) or Kim and colleagues (29) could not confirm this relationship. Interestingly, DeVries and colleagues reported that although pretreatment mean-ADC did not reliably predict good responders (defined as ypT0–2), differences could be observed for the high fraction of ADC values from the histogram (30). This has been confirmed by our study that the higher portion of the histogram percentile values (50%–80%) was lower in the pCR groups. A possible explanation is that tumors with high ADC values are likely to be more necrotic or edematous than solid or viable tumors (31). Because necrotic/edematous areas are resistant to radiation, it may be hypothesized that those tumors, and thus high pretreatment ADC values, would have less favorable treatment response. We did not find that the heterogeneity distribution of the ADC map showed differences between different response groups. This might be due to the relatively coarse image resolution of the diffusion-weighted images that washed out the effect.
Regarding the DCE-MRI, the experience for response prediction in rectal cancer is even more limited and the prognostic value is still unclear. Tong and colleagues reported that pretreatment DCE parameter (Ktrans from Toft’s model) was significantly higher in the pCR group (32) but Intven and colleagues could not achieve the same promising result (12, 33). In addition, they claimed that no additional value was found including DCE-MRI next to T2w imaging and DWI in an MRI protocol used for response assessment in LARC. What we found was that the volume-averaged feature (mean-MSD) did not add any value in the final prediction after ANN training, but the heterogeneous enhancement as analyzed by texture features showed promising prognostic power. When replacing the mean-MSD with voxel-based texture analysis into the final model, the AUC in predicting pCR could increase from 0.74 to 0.84. Tumor is not a uniform unity. The diffusion and perfusion heterogeneity varies with histologic tumor type and thus the response to treatment. For example, the development of hypoxia, which results in lower blood supply, may reduce the effectiveness of radiation and drug transportation (34, 35). Hypoxic regions usually have lower enhancement than those of solid tumors, but this does not necessarily guarantee a lower mean value. The internal heterogeneous distribution measurement should be able to provide information one-step further in evaluating the tumor characteristics during the treatment. Thus, the histogram and voxel-wise analyses are theoretical alternatives for evaluating tumor heterogeneity. For this reason again, voxel-wise analysis is an important tool to be used to interrogate the most viable portions of tumor.
We understand that the contrasting results reported by the previous literature might find an explanation in the wide heterogeneity among previous studies, in patient selection, pretreatment staging, definition of response, dose of radiation, chemotherapy administered, and interval before surgery. The results, nonetheless, all support the interpretation that higher pretreatment vascularity and permeability allow for better treatment response. Future studies with larger study populations are required to validate the role of those imaging characteristics. However, how to utilize the full wealth of imaging radiomics warrants more investigation. Our result suggests the potential limitation of using summary mean value in some instances to evaluate treatment response as done by previous studies and highlights the potential of voxelized heterogeneity analysis.
The present study has some limitations. First, the sample size is still limited compared with the relatively large number of predictors. As such, ANN was utilized instead of the conventional logistic regression analysis due to its capacity to model complex relationships between independent and predictor variables, allowing the inclusion of a large number of variables. The training and testing were performed on the same set of patient data. In order to minimize the bias, 4-fold cross-validation was used (36, 37). We randomly separated our patient data into four cohorts, with three of them used for training, while the remaining one cohort was used for testing purpose. All the tests were run 4 times with the average value reported as the cross-validated performance. A larger study is required to determine the prognostic power of all these parameters and a cutoff point by ROC with narrow confidence intervals. Furthermore, to control for model overfitting, the number of predictors should remain within 1/10–1/3 of the number in the dependent group. In the current study, the potential feature set was limited to no more than 3 for pCR prediction (11 pCR) and 4 for the TRG GR prediction (17 non-GR). Nevertheless, large data samples are needed to allow for a full panel selection of image features, and better investigation of the true benefit using nonlinear statistical models as ANN over conventional linear-based statistical analysis on large dimensional data, similar to what we have previously reported on breast cancer management (38). Also, we have limited time points for the DCE-MRI sequence. This prevents quantitative analysis using the pharmacokinetic models, such as the generalized Toft’s model. However, measurement variability of 20% has still been quoted for Ktrans measurement in pelvic cancer despite Toft’s suggestion for the use of standardized terms (39, 40). As such, we chose to use time–intensity curve (TIC) shape descriptors as suggested by Petrillo and colleagues (23). The analyses used the fitting, adding the TIC normalization with the aim of eliminating the dependence on proton density, relativity, and other equipment parameters, and may be more reliable in the current data sample. Third, no precautions were taken to avoid bowel movements, nor was the administration of butylscopolamine, dicyclomine, glucagon, or similar drugs carried out. We have carefully reviewed each case to avoid significant image misalignments. However, in the future, image registration may be needed to improve the accuracy of quantitative analysis.
Nevertheless, our study focuses on the specific relationship between pre-CRT MR imaging values and pathologic response using both volume-averaged and voxelized analysis. Through a systematic analysis of multiparametric MR imaging features, we are able to build models with improved predictive value over conventional imaging metrics. This is encouraging, suggesting the wealth of imaging radiomics should be further explored to help tailoring the treatment into the era of personalized medicine. Combined quantitative imaging features may lead to better prognostic value by allowing earlier treatment alternation and more accurate noninvasive surveillance.
Supplementary Material
Translational Relevance.
The recent trend toward patient-tailored treatment for locally advanced rectal cancer has highlighted the need for reliable methods in the early assessment of treatment response. Imaging markers such as anatomical and functional MRI may provide additional guidance, and the full wealth of imaging radiomics warrants more investigation. In this study, we integrate the information from anatomical, perfusion, and diffusion MRI using both volume-averaged and voxelized quantitative analysis to predict pathologic response after neoadjuvant chemoradiation therapy. Our results suggest the potential limitation of using summary mean value in some instances to evaluate treatment response as done by previous studies and highlight the potential of voxelized heterogeneity analysis. In addition, although no imaging test could precisely correlate with treatment outcome, these modalities, when used in combination, provide improved prognostication.
Grant Support
This work is supported by Zhejiang Provincial Natural Science Foundation of China (Grant No. LR16F010001, LY14H160016), the National High-tech R&D Program for Young Scientists by the Ministry of Science and Technology of China (Grant No. 2015AA020917), Natural Science Foundation of China (NSFC Grant No. 81201091, 81441086) and Major Science and Technology Program of Zhejiang Province (grant 2013C03044–6).
The costs of publication of this article were defrayed in part by the payment of page charges. This article must therefore be hereby marked advertisement in accordance with 18 U.S.C. Section 1734 solely to indicate this fact.
Footnotes
Disclosure of Potential Conflicts of Interest
S. Jabbour reports receiving commercial research grants from Merck. No potential conflicts of interest were disclosed by the other authors.
Supplementary data for this article are available at Clinical Cancer Research Online (http://clincancerres.aacrjournals.org/).
References
- 1.van de Velde CJ, Boelens PG, Borras JM, Coebergh JW, Cervantes A, Blomqvist L, et al. EURECCA colorectal: multidisciplinary management: European consensus conference colon and rectum. Eur J Cancer 2014;50:1.e1–1.e34. [DOI] [PubMed] [Google Scholar]
- 2.Kapiteijn E, Marijnen CA, Nagtegaal ID, Putter H, Steup WH, Wiggers T, et al. Preoperative radiotherapy combined with total mesorectal excision for resectable rectal cancer. N Engl J Med 2001;345:638–46. [DOI] [PubMed] [Google Scholar]
- 3.Maas M, Nelemans PJ, Valentini V, Das P, Rödel C, Kuo LJ, et al. Long-term outcome in patients with a pathological complete response after chemoradiation for rectal cancer: a pooled analysis of individual patient data. Lancet Oncol 2010;11:835–44. [DOI] [PubMed] [Google Scholar]
- 4.Sanghera P, Wong DW, McConkey CC, Geh JI, Hartley A. Chemoradiotherapy for rectal cancer: an updated analysis of factors affecting pathological response. Clin Oncol (R Coll Radiol) 2008;20:176–83. [DOI] [PubMed] [Google Scholar]
- 5.Habr-Gama A, Perez RO, Proscurshim I, Campos FG, Nadalin W, Kiss D, et al. Patterns of failure and survival for nonoperative treatment of stage c0 distal rectal cancer following neoadjuvant chemoradiation therapy. J Gastrointest Surg 2006;10:1319–28. [DOI] [PubMed] [Google Scholar]
- 6.Maas M, Beets-Tan RG, Lambregts DM, Lammering G, Nelemans PJ, Engelen SM, et al. Wait-and-see policy for clinical complete responders after chemoradiation for rectal cancer. J Clin Oncol 2011;29:4633–40. [DOI] [PubMed] [Google Scholar]
- 7.Borschitz T, Wachtlin D, Mohler M, Schmidberger H, Junginger T. Neoadjuvant chemoradiation and local excision for T2–3 rectal cancer. Ann Surg Oncol 2008;15:712–20. [DOI] [PubMed] [Google Scholar]
- 8.Janssen MH, Ollers MC, Riedl RG, van den Bogaard J, Buijsen J, van Stiphout RG, et al. Accurate prediction of pathological rectal tumor response after two weeks of preoperative radiochemotherapy using (18) F-fluorodeoxyglucose-positron emission tomography-computed tomography imaging. Int J Radiat Oncol Biol Phys 2010;77:392–9. [DOI] [PubMed] [Google Scholar]
- 9.Engelen SM, Beets-Tan RG, Lahaye MJ, Lammering G, Jansen RL, van Dam RM, et al. MRI after chemoradiotherapy of rectal cancer: a useful tool to select patients for local excision. Dis Colon Rectum 2010;53:979–86. [DOI] [PubMed] [Google Scholar]
- 10.Intven M, Reerink O, Philippens ME. Dynamic contrast enhanced MR imaging for rectal cancer response assessment after neo-adjuvant chemoradiation. J Magn Reson Imaging 2015;41:1646–53. [DOI] [PubMed] [Google Scholar]
- 11.Lambregts DM, Vandecaveye V, Barbaro B, Bakers FC, Lambrecht M, Maas M, et al. Diffusion weighted MRI for selection of complete responders after chemoradiation for locally advanced rectal cancer: a multicenter study. Ann Surg Oncol 2011;18:2224–31. [DOI] [PMC free article] [PubMed] [Google Scholar]
- 12.Intven M, Reerink O, Philippens ME. Diffusion-weighted MRI in locally advanced rectal cancer: pathological response prediction after neoadjuvant radiochemotherapy. Strahlenther Onkol 2012;189:117–22. [DOI] [PubMed] [Google Scholar]
- 13.Oberholzer K, Junginger T, Heintz ARectal cancer : MR imaging of the mesorectal fascia and effect of chemoradiation on assessment of tumor involvement. J Magn Reson Imaging 2012;36:658–63. [DOI] [PubMed] [Google Scholar]
- 14.Allen SD, Padhani AR, Dzik-Jurasz AS, Glynne-Jones RRectal carcinoma: MRI with histologic correlation before and after chemoradiation therapy. AJR AM J Roentgenol 2007;188:442–51. [DOI] [PubMed] [Google Scholar]
- 15.Aiba T, Uehara K, Nihashi T, Tsuzuki T, Yatsuya H, Yoshioka Y, et al. MRI and FDG-PET for assessment of response to neoadjuvant chemotherapy in locally advanced rectal cancer. Ann Surg Oncol 2014;21:1801–8. [DOI] [PubMed] [Google Scholar]
- 16.Kim SH, Lee JM, Hong SH, Kim GH, Lee JY, Han JK, et al. Locally advanced rectal cancer: added value of diffusion-weighted MR imaging in the evaluation of tumor response to neoadjuvant chemo- and radiation therapy. Radiol 2009;253: 116–25. [DOI] [PubMed] [Google Scholar]
- 17.Lambregts D, Beets G, Maas M, Curvo-Semedo L, Kessels AG, Thywissen T, et al. Tumour ADC measurements in rectal cancer: effect of ROI methods on ADC values and interobserver variability. Eur Radiol 2011;21:2567–74. [DOI] [PMC free article] [PubMed] [Google Scholar]
- 18.Rao SX, Zeng MS, Chen CZ, Li RC, Zhang SJ, Xu JM, et al. The value of diffusion-weighted imaging in combination with T2-weighted imaging for rectal cancer detection. Eur J Radiol 2008;65:299–303. [DOI] [PubMed] [Google Scholar]
- 19.Lim JS, Kim D, Baek SE, Myoung S, Choi J, Shin SJet al., Perfusion MRI for the prediction of treatment response after preoperative chemotherapy in locally advanced rectal cancer. Eur Radiol 2012;22:1693–700. [DOI] [PubMed] [Google Scholar]
- 20.Edge SB, Byrd DR, Compton CC, Fritz AG, Greene FL, Carducci MA, et al. (eds.). American Joint Committee on Cancer (AJCC) cancer staging manual, 7th ed. New York: Springer; 2009. [Google Scholar]
- 21.Cassidy J, Saltz L, Twelves C, Van Cutsem E, Hoff P, Kang Y, et al. et al., Efficacy of capecitabine versus 5-fluorouracil in colorectal and gastric cancers: a meta-analysis of individual data from 6171 patients. Ann Oncol 2011;22:2604–9. [DOI] [PubMed] [Google Scholar]
- 22.Haralick RM. Statistical and structural approaches to texture. Proc IEEE 1979;67:786–804. [Google Scholar]
- 23.Petrillo A, Fusco R, Petrillo M, Granata V, Sansone M, Avallone A, et al. Standardized Index of Shape (SIS): a quantitative DCE-MRI parameter to discriminate responders by non-responders after neoadjuvant therapy in LARC. Eur Radiol 2015;25:1935–45. [DOI] [PubMed] [Google Scholar]
- 24.Lin B, Lin G, Liu X, Ma J, Wang X, Lin F, et al. et al., Application of back-propagation artificial neural network and curve estimation in pharmaco-kinetics of losartan in rabbit. Int J Clin Exp Med 2015;8:22353–58. [PMC free article] [PubMed] [Google Scholar]
- 25.Sun YS, Zhang XP, Tang L, Ji JF, Gu J, Cai Y, et al. Locally advanced rectal carcinoma treated with preoperative chemotherapy and radiation therapy: preliminary analysis of diffusion-weighted MR imaging for early detection of tumor histopathologic downstaging. Radiology 2010;254:170–8. [DOI] [PubMed] [Google Scholar]
- 26.Lambrecht M, Vandecaveye V, De Keyzer F, Roels S, Penninckx F, Van Cutsem E, et al. Value of diffusion-weighted magnetic resonance imaging for prediction and early assessment of response to neoadjuvant radiochemotherapy in rectal cancer: preliminary results. Int J Radiat Oncol Biol Phys 2012;82:863–70. [DOI] [PubMed] [Google Scholar]
- 27.Jacobs L, Intven M, van Lelyveld N, Philippens M, Burbach M, Seldenrijk K, et al. Diffusion-weighted MRI for early prediction of treatment response on preoperative chemoradiotherapy for patients with locally advanced rectal cancer: a feasibility study. Ann Surg 2015. [Epub ahead of print] [DOI] [PubMed] [Google Scholar]
- 28.Cai G, Xu Y, Zhu J, Gu WL, Zhang S, Ma XJ, et al. Diffusion-weighted magnetic resonance imaging for predicting the response of rectal cancer to neoadjuvant concurrent chemoradiation. World J Gastroenterol 2013;19:5520–7. [DOI] [PMC free article] [PubMed] [Google Scholar]
- 29.Kim SH, Lee JY, Lee JM, Han JK, Choi BI. Apparent diffusion coefficient for evaluating tumour response to neoadjuvant chemoradiation therapy for locally advanced rectal cancer. Eur Radiol 2011;21:987–95. [DOI] [PubMed] [Google Scholar]
- 30.DeVries AF, Kremser C, Hein PA, Griebel J, Krezcy A, Ofner D, et al. Tumor microcirculation and diffusion predict therapy outcome for primary rectal carcinoma. Int J Radiat Oncol Biol Phys 2003;56:958–965. [DOI] [PubMed] [Google Scholar]
- 31.Uhl M, Saueressig U, van Buiren M, Kontny U, Niemeyer C, Kohler G, et al. Osteosarcoma: preliminary results of in vivo assessment of tumor necrosis after chemotherapy with diffusion- and perfusion-weighted magnetic resonance imaging. Invest Radiol 2006;41:618–23. [DOI] [PubMed] [Google Scholar]
- 32.Tong T, Sun Y, Gollub MJ, Peng W, Cai S, Zhang Z, et al. Dynamic contrast-enhanced MRI: Use in predicting pathological complete response to neoadjuvant chemoradiation in locally advanced rectal cancer. J Magn Reson Imaging 2015;42:673–80. [DOI] [PubMed] [Google Scholar]
- 33.Intven M, Monninkhof EM, Reerink O, Philippens ME. Combined T2w volumetry, DW-MRI and DCE-MRI for response assessment after neo-adjuvant chemoradiation in locally advanced rectal cancer. Acta Oncol 2015;27:1–8. [DOI] [PubMed] [Google Scholar]
- 34.Endrich B, Vaupel P. The role of microcirculation in the treatment of malignant tumours: facts and fiction. In: Molls M, Vaupel P, editors. Blood perfusion and microenvironment of human tumors. Berlin: Springer; 1998. p19–39. [Google Scholar]
- 35.Höckel M, Knoop C, Schlenger K, Vorndran B, Baussmann E, Mitze M, et al. Intratumoral pO2 predicts survival in advanced cancer of the uterine cervix. Radiother Oncol 1993;26:45–50. [DOI] [PubMed] [Google Scholar]
- 36.Kohavi R A study of cross-validation and bootstrap for accuracy estimation and model selection. The Fourteenth International Joint Conference on Artificial Intelligence Morgan Kaufmann, San Mateo 1995:1137–43. [Google Scholar]
- 37.Breiman L, Spector P. Submodel selection and evaluation in regression. The X-Random Case. Int Stat Rev 1992;60-:291–319. [Google Scholar]
- 38.McLaren CE, Chen WP, Nie K, Su MY. Prediction of malignant breast lesions from MRI features: a comparison of artificial neural network and logistic regression techniques. Acad Radiol 2009;16:842–51. [DOI] [PMC free article] [PubMed] [Google Scholar]
- 39.Tofts PS, Brix G, Buckley DL, Evelhoch JL, Henderson E, Knopp MV, et al. Estimating kinetic parameters from dynamic contrast-enhanced T(1)-weighted MRI of a diffusible tracer: standardized quantities and symbols. J Magn Reson Imaging 1999;10:223–32. [DOI] [PubMed] [Google Scholar]
- 40.Lankester KJ, Taylor JN, Stirling JJ, Boxall J, d’Arcy JA, Collins DJ, et al. Dynamic MRI for imaging tumor microvasculature: comparison of susceptibility and relaxivity techniques in pelvic tumors. J Mag Reson Imaging 2007;25:796–805. [DOI] [PubMed] [Google Scholar]
Associated Data
This section collects any data citations, data availability statements, or supplementary materials included in this article.