

Abstract
CD62L+ central memory CD8+ T (TCM) cells are derived from antigen-experienced cells and provide long-term protection against the same pathogen. In spite of the therapeutic importance, approaches to enhance TCM production remain limited. Here we show genetic ablation of Tle3, a transcriptional cofactor, promotes TCM cell formation in response to acute viral infection, at the expense of CD62L− effector memory CD8+ T (TEM) cells. Lineage-tracing studies demonstrate that Tle3-deficient TEM and terminally differentiated cytotoxic effector T cells both effectively give rise to TCM cells, and the converted TCM cells retain robust recall capacity. Mechanistically, Tle3 is dynamically redistributed in the T cell genome during effector and memory CD8+ T cell differentiation, integrating regulatory activities from distinct sets of partner transcriptional factors expressed at different stages. Consistent with its known corepressor function, Tle3 coopts Runx3 and Tcf1 to limit chromatin accessibility at TCM-characteristic sites and restrain expression of TCM signature genes. Unexpectedly, Tle3 acts as a coactivator for Tbet to directly increases chromatin opening at TEM-characteristic sites and activates TEM signature gene transcription. The dual regulatory functions indicate that Tle3 is a gatekeeper for TEM lineage fidelity, and further suggest that manipulating the Tle3 pathway can reprogram the fate decision of antigen-experienced CD8+ T cells to favor TCM production.
CD8+ T lymphocytes are essential players in mounting protective cellular immune responses against pathogens and malignantly transformed cells. A productive CD8+ T cell response clears pathogens causing acute infections and forms memory CD8+ T cells, which have heightened protective capacity and constitute the underlying basis for vaccines1. Memory CD8+ T cells consist of heterogeneous subsets, with distinct distribution patterns and functionality2, 3. Compared with CD62L− effector memory CD8+ T (TEM) cells that are largely detected in circulation, CD62L+ central memory CD8+ T (TCM) cells are more enriched in the secondary lymphoid organs, persist for longer duration and respond more robustly to rechallenge by the same pathogen3, 4. In term of developmental origin, TCM cells are derived from multiple sources, including TEM cells as an in vivo maturation process over time5, and various effector subsets expressing higher levels of IL-7Rα, CD62L and/or Tcf1 within a time range from initial few divisions after CD8+ T cell activation to the phase of fully differentiated cytotoxic effectors6, 7, 8, 9, 10. However, it remains an unaddressed question whether TEM and effector subsets can be reprogrammed to expedite and/or enhance the production of TCM cells so as to apply their superior functionality for translational use.
Differentiation of effector and memory CD8+ T cells are instructed by a plethora of transcription factors (TFs)11, 12. The access to regulatory elements by sequence-specific TFs is controlled by their dynamic expression, for example, Tbet and Blimp1 are induced in effector and partly retained in memory CD8+ T cells, while Tcf1 and Myb are downregulated in effector but partly restored in memory CD8+ T cells7, 13, 14, 15. TFs do not act alone and require cofactors to achieve regulatory specificity, stability, and transcriptional output, and this is particularly important for TFs such as Runx3 which are stably expressed throughout CD8+ T cell differentiation process16, 17. One of such cofactors, Transducin-Like Enhancer of split (Tle) protein, stands out because its interaction with many immune function-related transcription factors including Tcf1/Lef1, Runx1/Runx3, Myc and Blimp118, 19, 20, 21. Tle proteins are the mammalian homologues of Drosophila Groucho transcriptional repressor. There are four mammalian Tle genes, Tle1–4, that encode full-length Tle proteins, and these Tle proteins have both unique and redundant functions in development of multiple organs, including hematopoiesis22, 23, 24, 25. In T lineage cells, Tle3 is most abundantly expressed, followed by Tle4 and Tle1, with Tle2 at a barely detectable level 26. Tle1, Tle3, and Tle4 are critically required for CD8+ T cell lineage choice during thymic development, in a gene-dose dependent manner26. In this study, we demonstrate that Tle3 is dynamically redistributed in the T-cell genome during effector and memory CD8+ T cell differentiation and that genetic ablation of Tle3 endows TCM-forming capacity to fully differentiated effector cells and promotes maturation of TEM to TCM cells in anti-pathogen and anti-tumor responses.
Results
Loss of Tle3 enhances TCM cell formation on population and single cell levels.
Because of known functional redundancy among Tle proteins during thymic development26, we crossed Gzmb-Cre with Tle1-, Tle3-, and Tle4-floxed alleles26, 27, 28 to ablate these genes only after CD8+ activation, without perturbing thymic maturation. We obtained Gzmb-Cre+Rosa26GFP Tle1FL/FLTle3FL/FLTle4FL/FL mice and Gzmb-Cre– littermate controls (called Tle134−/− and WT, respectively), where Rosa26GFP allele expresses GFP after Cre activation and hence marks Tle1,3,4-deleted cells. WT and Tle134−/− mice were infected with lymphocytic choriomeningitis virus (LCMV) Armstrong strain (LCMV-Arm) to elicit acute viral infection. On 8th day post-infection (dpi) when the activated CD8+ T cells reached peak response, Tle134−/− mice showed greatly diminished frequency and numbers of effector CD8+ T (TEFF) cells, detected as CD11ahiCD8lo poly-clonal antigen-experienced cells or LCMV GP33 epitope-specific cells measured with GP33-tetramer or GP33 peptide-stimulated IFN-γ production (Fig. 1a). This catastrophic impact on TEFF cells by Tle1,3,4 deficiency was more profound than that by ablating Runx3, Tbet or Blimp1 alone7, 13, 17, 29, consistent with the ability of Tle cofactors to interact with and integrate actions of multiple sequence-specific TFs.
Figure 1. Targeting Tle3 favors generation of TCM cells.

a. Detection of antigen-specific CD8+ T cells in WT and Tle134−/− mice on 8 dpi with LCMV-Arm, using surrogate markers (top), GP33-tetramer (middle) and GP33 peptide-stimulated IFN-γ production (bottom). Shown in bar graphs are cumulative data on frequency of antigen-experienced CD8+ T cells or numbers of GP33-specific CD8+ T cells (right).
b. Detection of Tle3 in TN and TEFF (8 dpi) with immunoblotting. Data are representative from two independent experiments.
c. Experimental design. Naive P14 CD8+ T cells were adoptive transferred into CD45-disparate recipients at 2×10⁴ cells/recipient, followed by i.p. infection with LCMV-Arm and characterization of CD8+ T cells at the effector and memory stages.
d. Numbers of WT and Tle3−/− P14 CD8+ T cells in recipient spleens at the effector (8 dpi) and memory (≥30 dpi) stages.
e. Detection of WT and Tle3−/− TEFF and TMP subsets on 8 dpi, with cumulative data on TMP frequency in bar graph (right).
f. Detecting cell viability of antigen-specific CD8+ T cells during the contraction phase on 14 dpi, with cumulative data on frequency of AnnexinV+ cells in bar graphs (right).
g. Detection of WT and Tle3−/− TCM and TEM subsets at ≥30 dpi, with cumulative data on TCM frequency and numbers in bar graphs (right).
h. Detection of GP33-induced cytokine production in TCM and TEM cells at ≥30 dpi. Cumulative data on the right show the frequency of IFN-γ-producing cells in CD45.2+ TCM and TEM cells (top), and that of TNF-α- and IL-2-producing cells in IFN-γ+ TCM and TEM cells (middle and bottom).
i. Detection of granzyme B expression in TCM and TEM cells at ≥30 dpi. In each experiment, the average of geometric mean fluorescence intensity (gMFI) of granzyme B in WT TCM cells was set as 1, and the gMFI granzyme B in all cell types was normalized accordingly to obtain its relative expression, with cumulative data shown in bar graphs (bottom). Contour plots in a, e–h and half-stacked histograms in i are representative from 2–3 independent experiments, and all cumulative data are means ± s.d., with individual data points shown. *, p<0.05; **, p<0.01; ***, p<0.001; ns, not statistically significant by Student’s t-test.
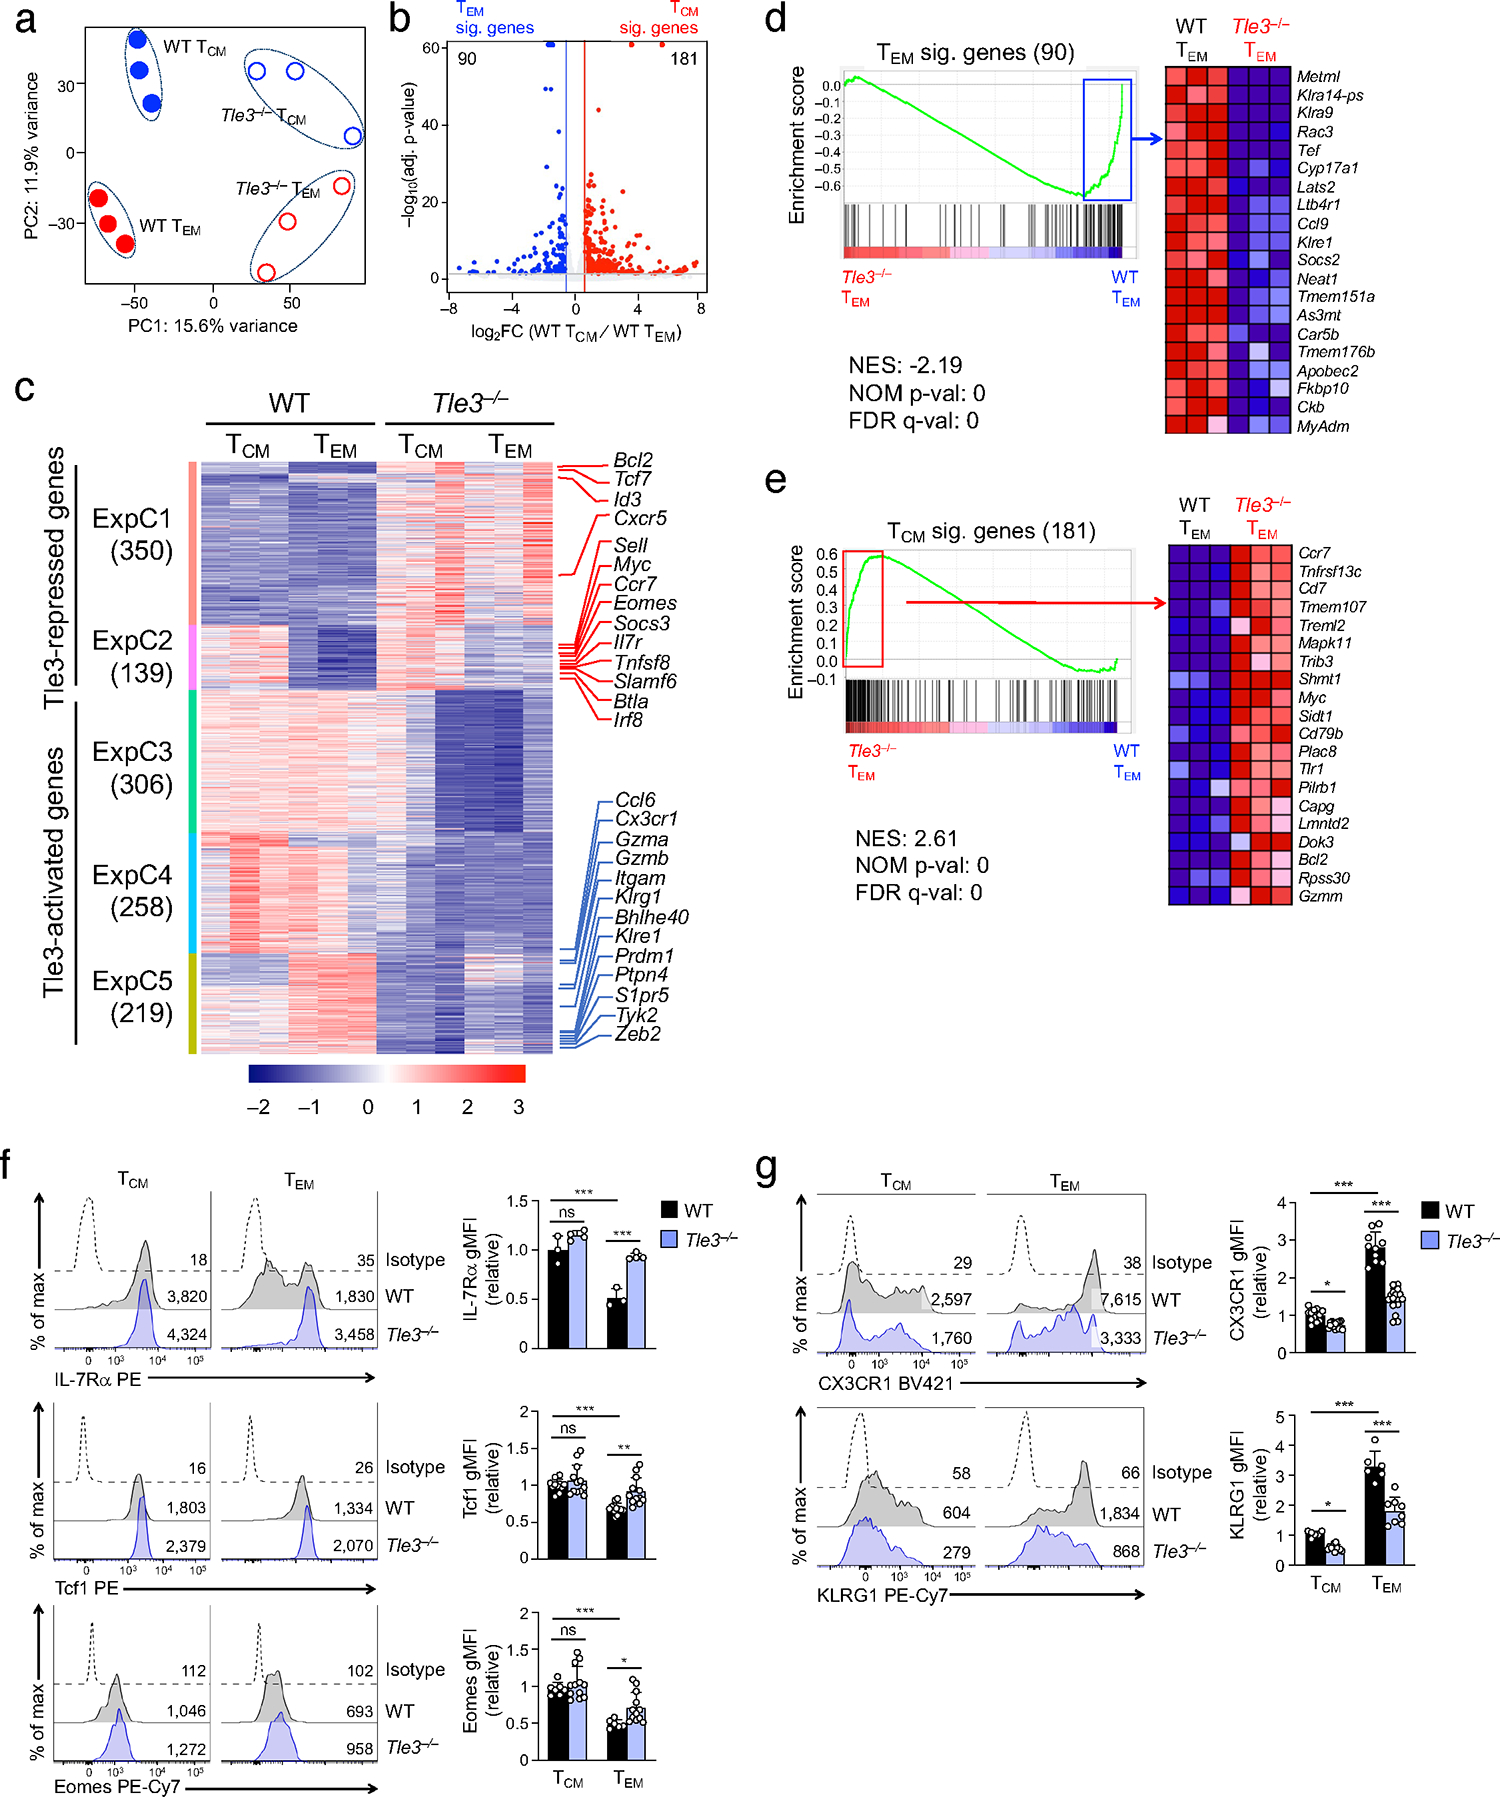
In spite of the strong redundancy among Tle proteins in accumulation of TEFF cells, we hypothesized that an individual Tle protein could finetune select functional aspects of CD8+ T cell responses that cannot be fully compensated by its coexpressed homologues, similar to a more dominant effect of Tcf1 among the Tcf/Lef family TFs in T lineage cells20, 30. We focused on Tle3 because of its abundant expression in both naive CD8+ (TN) and TEFF cells (Fig. 1b), and generated P14+Gzmb-Cre+Rosa26GFP Tle3FL/FL (Tle3−/−) and Tle3+/+ control (WT) mice, where the transgenic P14 TCR is specific for the GP33 epitope in LCMV. CD45.2+WT or Tle3−/− P14 TN cells were adoptively transferred, followed by LCMV-Arm infection (Fig. 1c). On 8 dpi, loss of Tle3 reduced the expansion of P14 CD8+ T cells by ~3.5-fold (Fig. 1d), modestly reduced IFN-γ production, but showed little effect on TNF production and granzyme B expression (Extended data Fig. 1a–c). Additionally, the composition of KLRG1hiIL-7Rα− fully differentiated TEFF and KLRG1loIL-7Rα+ memory precursor (TMP) cells was similar between Tle3−/− and WT P14 cells (Fig. 1e). At ≥30 dpi, similar numbers of WT and Tle3−/− memory CD8+ T (TM) cells were detected (Fig. 1d), which might be partly ascribed to a modest reduction of Annexin-V+ Tle3−/− compared to WT cells during the contraction phase (e.g., 14 dpi, Fig. 1f). Interestingly, the CD62L+ TCM cell frequency and numbers were substantially elevated in the absence of Tle3 (Fig. 1g), while Tle3−/− TCM and TEM cells showed similar capacity of multi-cytokine production, but modestly reduced granzyme B expression compared with their WT counterparts (Fig. 1h,i). In this experimental setting, wild-type B6 mice were used as recipients, and the endogenous immune response should be sufficient to clear LCMV. To ascertain that the phenotypic changes in Tle3−/− TM cells were not due to persistence of viral antigens, sera were collected from recipient mice at various time points. As determined with quantitative RT-PCR and plaque assays, LCMV was detected at similar levels in recipients of WT and Tle3−/− P14 cells on 4 dpi, but was below detection limits on 8, 14, and 30 dpi (Extended data Fig. 1d–f). We next performed co-transfer of CD45.2+ Tle3−/− and CD45.1+CD45.2+ WT P14 cells into the same CD45.1+ recipients followed by LCMV-Arm infection so that they would be exposed to the same in vivo environment. At ≥30 dpi, Tle3−/− TM cells exhibited elevated TCM frequency compared to WT cells (Extended data Fig. 1g), suggesting that Tle3-deficient cells had intrinsic propensity of favoring TCM formation. These functional analyses collectively demonstrate that Tle3 supports TEM fate and targeting Tle3 instead promotes TCM formation. It is of note that targeting known Tle partner TFs shows distinct effects, e.g., ablating Runx3 diminishes TMP frequency at the effector phase, while ablating Tcf1 impairs TCM formation at the memory phase15, 31. Therefore, the impact of Tle3 deficiency is not a phenocopy of ablating a single partner TF. We posit that Tle3 has unique regulatory functions in memory CD8+ T cell differentiation by engaging different TF complexes, and its distinct impact is ascribed to integrative effect of TF complexes that are uniquely sensitive to loss of Tle3 and cannot be compensated by Tle1 and Tle4.
To substantiate the unique function of Tle3 in promoting TEM cell fate without depending on a single CD62L marker, we performed single-cell RNA sequencing (scRNA-seq) on WT and Tle3−/− P14 TM cells sort-purified at ≥30 dpi. Focused analysis of WT TM cells identified three major populations besides a minor population of few cells showing elevated expression of Dock2, which is reportedly associated with pool size of “virtual memory” T cells32 (Fig. 2a,b). Further analysis of population signature genes revealed that one population was highly enriched with TCM-characteristic genes including Sell (encoding CD62L), Ccr7, Il7r and Tcf7 (encoding Tcf1) (Fig. 2c top row), and hence termed TCM population (Fig. 2a). The other two populations expressed higher levels of TEM characteristic genes including Klrg1, Cx3cr1, Zeb2 and Bhlhe40, and termed TEM1 and TEM2 populations, with the later expressing a distinctively higher level of Klre1 (Fig. 2b, and 2c bottom row). Pseudotime trajectory analysis with Monocle33 suggested maturation of TEM2 to TEM1 and TCM cells (Fig. 2d), consistent with existing knowledge5. When combined together, WT and Tle3−/− TM single cells were resolved into 7 clusters, with Cluster 7 being equivalent to Dock2-hi population described above (Fig. 2e). Among the other 6 major clusters, WT and Tle3−/− TM cells were distributed in almost exclusive clusters (Fig. 2f), suggesting a strong transcriptomic diversification due to Tle3 deficiency. Clusters 1–3 were mostly WT TM cells (Fig. 2g), with cluster 3 being equivalent to WT TCM cells based on characteristic gene expression (Fig. 2h). On the other hand, Clusters 4–6 were predominantly Tle3−/− TM cells, where cluster 4 expressed higher levels of TEM-characteristic genes, while clusters 5 and 6 strongly expressed TCM-characteristic genes (Fig. 2g,h). Based on comparison between TCM and TEM1/2 clusters in WT cells, we defined single cell-based TCM and TEM signature genes (Extended Data Fig. 2a, Table S1). By assessing collective behavior of the signature gene sets, the WT-predominant Cluster 3 and Tle3−/−-predominant Clusters 5 and 6 were enriched in TCM scores but depleted of TEM scores (Extended Data Fig. 2b,c). These single cell-based analyses indicate that targeting Tle3 facilitates acquisition of TCM cell features on the single cell level, beyond a sole surface marker.
Figure 2. Targeting Tle3 promote TCM formation on the single cell level.

a. UMAP plot of scRNA-seq data from WT memory P14 CD8+ T cells sorted on 30 dpi, with each dot representing a single cell. A total of four clusters were identified with Seurat and color-coded.
b. Heatmap showing expression of 10 selected characteristic genes in TCM, TEM1/2 and Dock2-hi clusters as defined in a, with each column corresponding to a single cell. Color scale represents z-score transformed transcript levels.
c. Single-cell transcript levels of TCM (top) and TEM (bottom) signature genes as displayed in the UMAP plot. The range of transcript levels is marked with individual color scale for each gene.
d. Pseudotime analysis of WT memory P14 CD8+ T cells using Monocle v3, with the green line showing the trajectory of convergency of TEM1/2 to TCM cells.
e–f. UMAP plots of scRNA-seq data from WT and Tle3−/− memory P14 CD8+ T cells (30 dpi). Displayed in e are seven clusters identified with Seurat, and displayed in f are cells of different genotypes.
g. Distribution of WT and Tle3−/− cells in each cluster defined in e.
h. Violin plots showing transcript levels of TCM and TEM signature genes in each cluster defined in e.
Tle3 promotes TEM but suppresses TCM molecular features
Consistent with previous studies3, 34, 35, our scRNA-seq analysis of TM cells showed that Klrg1 and Cx3cr1 transcripts were preferentially detected in WT TEM over WT TCM cells (Fig. 2b,c). While these features were retained in Tle3−/− TM cells, their transcript levels appeared to be lower in Tle3−/− TEM cells compared with their WT counterparts (compared cluster 4 with clusters 1 and 2 in Fig. 2h). These transcript changes were validated on protein levels (Extended data Fig. 3a), suggesting that Tle3 may be directly involved in regulating the expression of these genes (also see below, Fig. 4f in particular). Thus, the varied changes in marker protein expression due to Tle3 deficiency may not accurately reflect composition changes in TM cell pool. Based on these considerations, we chose to use CD62L-based, classical definition of TEM and TCM cells (sorting strategy in Extended data Fig. 3b) for multiomics-based mechanistic studies, so as to avoid potentially confounding effect caused by differential dependence of selected cell surface markers on Tle3. We first performed bulk RNA-seq analysis of WT and Tle3−/− TCM and TEM cells sort-purified at ≥30 dpi to increase transcript sequencing depth. Each cell type was in distinct clusters on principal component analysis (PCA) (Fig. 3a). Comparison between WT TCM and WT TEM cells identified 181 TCM signature genes, including Id3, Eomes, Irf8 and Vcam1 (which were not captured by scRNA-seq), in additional to Sell, Ccr7, Il7r and Tcf7, and 90 TEM signature genes such as Cx3cr1 and Klrg1 (Fig. 3b, Table S2). Combined with differentially expressed genes (DEGs) between WT vs. Tle3−/− TCM and those between WT vs. Tle3−/− TEM cells (Extended data Fig. 3c,d), the 1,272 DEGs were resolved into 5 expression clusters (ExpC1–5, Fig. 3c) by unsupervised K-means clustering analysis. Consistent with the known corepressor function of Tle3, ExpC1 and ExpC2 genes showed concordant increase in Tle3−/− TCM and TEM cells (defined as “Tle3-repressed genes”), with ExpC2 genes being more enriched in TCM signature genes and showing more evident induction in Tle3−/− TEM cells (Fig. 3c). On the other hand, loss of Tle3 caused downregulation of a large number of genes as distributed in ExpC3–5 (defined as “Tle3-actived genes”), with ExpC5 genes being more enriched with TEM signature genes (Fig. 3c). Gene set enrichment analysis (GSEA) further demonstrated that Tle3−/− TEM cells were depleted of TEM signature genes but were strongly enriched in TCM signature genes (Fig. 3d,e). As validated on protein levels, IL-7Rα, Tcf1 and Eomes were expressed at higher levels in WT TCM than WT TEM cells, and showed more pronounced induction in Tle3−/− TEM cells (Fig. 3f). The TEM-characteristic KLRG1 and CX3CR1 proteins showed reduced expression in Tle3−/− cells, especially TEM cells (Fig. 3g), suggesting a positive regulatory role by Tle3. The transcriptomic analyses thus suggest that Tle3 exerts dual functions, i.e., promoting TEM but suppressing TCM transcriptional program.
Figure 4. Tle3 promotes TEM-characteristic open chromatin profile by acquiring novel binding sites.

a. Principal component analysis (PCA) of ATAC-seq libraries from WT and Tle3−/− TCM and TEM cells (≥30 dpi).
b. Volcano plot showing differential ChrAcc sites between WT TCM and WT TEM cells by the criteria of ≥2-fold expression changes and FDR<0.05. Values in the plot denote numbers of TCM and TEM signature ChrAcc sites.
c. Heatmap showing the impact of Tle3 deficiency on TCM and TEM ChrAcc landscape. Differential ChrAcc sites were identified in comparisons between WT and Tle3−/− TCM and between WT and Tle3−/− TEM cells, and distributed into 8 major ChrAcc clusters (ChrAccC) with K-means clustering analysis. Values in parentheses denote site numbers in each cluster, and also marked are the overlapping rates of each cluster with TCM and TEM signature ChrAcc sites (defined in b), as indicated with red and blue lines, respectively.
d. Heatmaps showing three major Tle3 binding clusters and associated sub-clusters. Tle3 binding peaks were identified in TN, TEFF, TEM and TCM cells with CUT&RUN, and those with dynamic changes (≥ 3-fold change, FDR<0.05 in comparisons of TEFF, TEM and TCM with TN cells) were clustered based on Tle3 binding strength. Values in parentheses denote Tle3 peak numbers, and each row represents a Tle3 peak strength across different CD8+ T cell response stages after Z-score normalization, with all replicates shown.
e. Correlation between ChrAcc and dynamic Tle3 binding changes. Diff. ChrAcc clusters (defined in c) were stratified against dynamic Tle3 binding clusters (defined in d), and the numbers of overlapping sites were indicated in each element.
f. Sequencing tracks of Tle3 binding (upper panels) and ChrAcc states (lower panels) at TEM-characteristic genes as displayed on IGV. Open bars denote “TEFF-acquired” Tle3 binding peaks and Tle3-opened ChrAcc sites, with Tle3 binding subcluster information marked on the top.
Figure 3. Targeting Tle3 promotes TCM but diminishes TEM signature gene expression.
a. Principal component analysis (PCA) of RNA-seq libraries from WT and Tle3−/− TCM and TEM cells (≥30 dpi).
b. Volcano plot showing DEGs between WT TCM and WT TEM cells based on bulk RNA-seq data by the criteria of ≥1.5-fold expression changes, FDR<0.05, and FPKM≥0.5 in the higher expression condition. Values in the plot denote numbers of TCM and TEM signature genes.
c. Heatmap showing the impact of Tle3 deficiency on TCM and TEM transcriptomes. DEGs were identified in comparison between WT and Tle3−/− TCM and between WT and Tle3−/− TEM cells, and were distributed into 5 major expression clusters (ExpC) with K-means clustering analysis. Values in parentheses denote gene numbers in each cluster, and select TCM and TEM signature genes are marked, as indicated with red and blue lines, respectively.
d–e. Enrichment plots of TEM (d) and TCM (e) signature gene sets (defined in b) in comparison of Tle3−/− vs. WT TEM cell transcriptomes with GSEA. NES, normalized enrichment score; NOM P val, nominal P values. In d, 48 of 90 TEM signature genes are in the leading edge showing enrichment in WT TEM cells. In e, 104 of 181 TCM signature genes are in the leading edge showing enrichment in Tle3−/− TEM cells.
f–g. Detection of TCM (f) and TEM (g) characteristic proteins with flow cytometry in WT and Tle3−/− TCM and TEM cells at ≥30 dpi. Half-stacked histograms are representative data from at least 2 independent experiments with values denoting geometric mean fluorescence intensity (gMFI), and cumulative data for each protein are means ± s.d., with individual data points shown. Statistical significance for these multiple group comparisons was first determined with one-way ANOVA, and Tukey’s test was used as post-hoc correction for indicated pair-wise comparison. *, p<0.05; **, p<0.01; ***, p<0.001; ns, not statistically significant.
We next used ATAC-seq to examine the chromatin accessibility (ChrAcc) profiles in WT and Tle3−/− TCM and TEM cells. WT TCM and WT TEM cells were in distinct clusters based on PCA, and a direct comparison identified 1,881 TCM and 2,643 TEM signature ChrAcc sites (Fig. 4a,b). Tle3−/− TCM and TEM cells tended to cluster together and close to WT TCM cells on the PCA, and showed strong diversification from their WT counterparts (Fig. 4a). A total of 5,553 differential ChrAcc sites between WT and Tle3−/− cells were resolved into 8 clusters with K-means (Fig. 4c, Extended data Fig. 3e). ChrAcc sites in clusters 1–5 showed concordant increase in Tle3−/− TCM and TEM cells (defined as “Tle3-closed sites”), and those in clusters 4 and 5 exhibited high frequency overlap with TCM signature sites (Fig. 4c); on the other hand, clusters 6–8 sites showed decreased ChrAcc in Tle3−/− TCM and TEM cells (defined as “Tle3-opened sites”), and the decrease was most pronounced in cluster 6, with high-frequency overlap with TEM signature sites (Fig. 4c). These analyses together demonstrate that Tle3 promotes TEM but suppresses TCM ChrAcc landscape, in line with its dual impact on TEM/TCM transcriptomes.
Tle3 is dynamically redistributed during CD8+ T cell responses
To discern if Tle3 executes its dual functions in direct or indirect manner, we used CUT&RUN36 to map genome-wide Tle3 binding sites in sort-purified TN, TEFF (8 dpi), TEM and TCM cells (at ≥30 dpi). PCA showed that Tle3 binding in these cell types reproducibly formed distinct clusters (Extended data Fig. 4a). A total of 34,292 Tle3 binding sites were identified in all 4 cell types using MACS237. By applying stringent criteria (≥3 fold difference in binding strength and FDR<0.05) in DEseq238, 3,627 Tle3 binding sites exhibited significant gain or loss in binding strength in TEFF, TEM and TCM compared with TN cells, and were distributed into 3 major clusters (Fig. 4d, Extended data Fig. 4b). Cluster1 showed little Tle3 binding in TN, but acquired strong binding in TEFF, and inherited into TEM cells as well TCM cells to a lesser extent (as in TleC1a-d subclusters, Fig. 4d). The Cluster1 Tle3 binding sites, defined as “TEFF-acquired sites”, were linked to genes in “immune system processes” as determined with GREAT analysis39 (Extended data Fig. 4c); specifically, these sites were associated with genes in the cytotoxic program, as observed at upstream of Tbx21 and Ifng genes (encoding Tbet TF and IFN-γ, Extended data Fig. 4d). Cluster2 Tle3 binding sites were similar as Cluster1 but showed stronger binding in TEM and/or TCM cells (defined as “TM-preferred sites”), as exemplified in Tbx21 introns (Extended data Fig. 4d). In contrast, Cluster3 Tle3 binding sites were strong in TN but reduced in TEFF, and hence defined as “TEFF-attenuated sites” (as in TleC3a-e subclusters, Fig. 4d). The Cluster3 sites mostly remained weak in TEM, but those in C3b,c,d subclusters partly restored Tle3 binding strength in TCM cells (i.e., stronger than TEFF, remaining weaker than TN cells) (Fig. 4d). The Cluster3 sites were linked to genes in “immune system processes” (Extended data Fig. 4e), especially memory-characteristic genes, such as Ccr7 and Zeb1 (Extended data Fig. 4f)40. We then examined Tle3 binding events within the +/–100kb regions flanking transcription start sites (TSSs) of DEGs between WT and Tle3−/− TM cells. Approximately 40% of Tle3-repressed genes in ExpC1–3 harbored these dynamic Tle3 binding sites, and significantly, over 60% of Tle3-activated genes in ExpC5 (enriched in TEM signature genes) were associated with dynamic Tle3 binding (Extended data Fig. 4g). The DEG-associated, dynamic Tle3 binding sites were mostly distributed in distal regulatory regions (Extended data Fig. 4h). These data suggest that Tle3 is actively redeployed in the T cell genome to meet functional needs during CD8+ T cell differentiation.
We then stratified the dynamic Tle3 binding clusters (Fig. 4d) with differential ChrAcc clusters (Fig. 4c). Strikingly, Tle3-opened chromatin sites in ChrAccC6–7 were highly enriched with “TEFF-acquired” Tle3 binding sites (TleC1a-d), and to a lesser extent with “TM-preferred” sites (TleC2a-b) (Fig. 4e, red rectangle). As observed at the TEM signature genes, such as Klrg1, Cx3cr1, Prdm1, and Bhlhe40, Tle3 acquired de novo binding sites in TEFF and TEM cells, which showed much more potent signals than TCM cells at the same genomic locations (Fig. 4f, upper panels); and importantly, intact expression of Tle3 was necessary for keeping these Tle3 binding sites in open chromatin state in TEM as well as TCM cells (Fig. 4f, lower panels). Additionally, TCM and TEM cells had ~20,000 Tle3 binding sites that showed <3-fold differences in binding strength compared with TN cells. These “less dynamic” Tle3 binding sites overlapped more frequently with Tle3-opened ChrAccC6–8 sites than with Tle3-closed ChrAccC1–5 sites (Extended data Fig. 5a). These observations suggest that Tle3 directly contributes to establishing and/or maintaining chromatin open state, especially at genes associated with the TEM program.
Tle3 engages distinct TF partners during CD8+ T cell responses
We next investigated how Tle3 achieved positive control of ChrAcc. De novo motif analysis with HOMER41 showed that the “TEFF-acquired” Tle3-bound, Tle3-opened ChrAcc sites (in red rectangle in Fig. 4e) were enriched in Ets, Runx and Tbet motifs (Fig. 5a) and that the “less dynamic” Tle3-bound, ChrAccC6–8 sites also had Ets, Runx and Tbet as top motifs (Extended data Fig. 5b), suggesting that Tle3 engaged both stably expressed Runx3 and TEFF-induced Tbet to sustain chromatin open state during TEM differentiation. It is well-documented that Tle cofactors interact with Runx family TFs42, 43, but it is unknown if Tle3 engages Tbet. By immunoprecipitation with an anti-FLAG antibody, the FLAG-tagged Tbet was coimmunoprecipitated with HA-tagged Tle3 in 293T cells and endogenous Tle3 protein in primary TEFF cells (8 dpi) (Fig. 5b,c), indicating physical interaction between Tle3 and Tbet. To further determine the cooperativity of Tle3 with Tbet and Runx3 TFs, we compared their binding patterns in TEFF cells, because the “TEFF-acquired" Tle3 binding sites largely sustained the binding strength in TEM cells (Fig. 4d). By CUT&RUN analysis in TEFF cells isolated on 8 dpi, we identified 15,498 Runx3 binding sites and 21,354 Tbet binding sites. Tle3 bound to 17,875 genomic locations in TEFF cells, with 65% co-occupied by Runx3 and 81% co-occupied by Tbet, and significantly, Tle3 colocalized with both Runx3 and Tbet at 54% of its binding locations, suggesting formation of multipartite complexes (Fig. 5d). When focusing on “TEFF-acquired" Tle3 binding sites (TleC1a-d) that gained binding strength in TEFF and TEM cells, Tle3 showed more prevalent colocalization with Tbet and Runx3, with ~88% sites exhibiting Tle3 and Tbet colocalization (Fig. 5e). These observations suggest that Tle3 functions as a cofactor Runx3 and TEFF-induced Tbet for target gene regulation.
Figure 5. Tle3 functions as a coactivator of Tbet to positively regulate TEM-characteristic molecular features.

a. De novo motif analysis of ChrAcc clusters 6–8 that overlapped with “TEFF-acquired” Tle3 binding sites (within red rectangle in Fig. 4e).
b. Coimmunoprecipitation of FLAG-tagged Tbet and HA-tagged Tle3 after co-transfection into 293T cells. IP, immunoprecipitation; IB, immunoblotting.
c. Coimmunoprecipitation of FLAG-tagged Tbet with endogenous Tle3 in primary TEFF cells (6 dpi) expressing retrovirally delivered FLAG-Tbet. Data in b and c are representative from two independent experiments.
d. Venn diagram showing overlap of Tle3 binding sites with Runx3 and Tbet binding sites in effector CD8+ T cells as determined with CUT&RUN.
e. Pie chart showing overlapping rates of “TEFF-acquired” Tle3 binding sites (TleC1a-d in Fig. 4d) with Tbet and Runx3 in effector CD8+ T cells.
f. Volcano plot (left) showing differential Tle3 binding sites between WT and TRKO early TEFF cells isolated on 4 dpi, with values denoting site numbers. Tle3 binding strength of the Tbet/Runx3-dependent Tle3 binding sites in WT and TRKO cells is shown in heatmap (right).
g. Sequencing tracks of Tle3 binding in WT and TRKO TEFF, Tbet and Runx3 binding in WT TEFF cells at TEM-characteristic genes as displayed on IGV. IgG CUT&RUN (C’nR) in WT, Tbet C’nR in Tbet-deficient, Runx C’nR in Runx3-deficient TEFF cells were performed as negative controls with similar sequencing output (the latter two tracks not shown for clarity). Open bars mark Tbet/Runx3-dependent Tle3 binding sites, where bars with solid lines denote overlap with “TEFF-acquired” Tle3 binding peaks, with Tle3 binding subcluster information marked on the top.
h. Venn diagram showing overlap of Tle3, Tbet and Runx3 binding sites at Tle3-opened TEM signature ChrAcc sites (from ChrAccC6–8 with blue bars in Fig. 4c).
i. Association of dynamic Tle3-bound, Tle3-opened and -closed ChrAcc sites (defined in Fig. 4e) with Tle3-activated and -repressed genes (defined in Fig. 3c).
j. Scatterplot showing the connection of dynamic Tle3-bound, Diff. ChrAcc sites with DEGs between WT and Tle3−/− TEM cells, with select genes marked. Genes such as Ccr7, Zeb2 and Il2ra are associated with multiple qualified ChrAcc sites, which are connected with red dotted lines.
k. Heatmap showing the impact of deficiency in Tbet and/or Runx3 on the expression of Tle3-activated TEM signature genes. WT, Tbx21−/−, Runx3−/− and TRKO P14 cells were adoptively transferred, and the recipients were infected with LCMV-Arm. On 4 dpi, early TEFF cells were analyzed with RNA-seq, and the expression of select Tle3-dependent TEM signature genes was displayed.
To further substantiate this point, we generated P14+hCD2-Cre+Rosa26GFP Tbx21FL/FLRunx3FL/FL mice (called TRKO herein)44, used WT and TRKO P14 cells in adoptive transfer and LCMV-Arm infection (as in Fig. 1c), and then performed Tle3 CUT&RUN on early TEFF cells isolated on 4 dpi. WT and TRKO TEFF cells showed distinct Tle3 binding profiles (Extended data Fig. 5c), with over 3,000 Tle3 binding sites exhibiting diminished binding strength in TRKO compared to WT TEFF cells (Fig. 5f). The Tbet/Runx3-dependent Tle3 binding sites were frequently observed at TEM-characteristic genes, such as Ifng, Gzmb, Klrg1 and Prdm1 (Fig. 5g), with extensive overlap with Tbet and Runx3 binding sites, corroborating cooperativity of Tle3 with both Tbet and Runx3 TFs. To specifically assess Tbet for its contribution to Tle3 binding events, we also generated P14+hCD2-Cre+Rosa26GFP Tbx21FL/FL mice (called TbetKO herein) and performed Tle3 CUT&RUN on WT or TbetKO early TEFF cells as above. While 22,467 Tle3 binding sites were identified in WT TEFF cells, only 13,393 Tle3 sites were found in TbetKO TEFF cells (Extended data Fig. 5d), suggesting that Tle3 binding was substantially weakened in the absence of Tbet. In fact, the 9,926 Tle3 sites that were only identified in WT cells showed pronounced reduction in binding strength in TbetKO TEFF cells, whereas the 731 Tle3 sites uniquely identified in TbetKO TEFF cells had stronger binding strength than WT cells (Extended data Fig. 5e). The 3,380 Tbet/Runx3-dependent Tle3 binding sites defined above exhibited collectively attenuated binding strength in TbetKO TEFF cells (Extended data Fig. 5f). Specifically, Tle3 binding at the Ifng, Gzmb, and Prdm1 gene loci showed consistently reduced binding strength in TbetKO TEFF cells (Extended data Fig. 5g), albeit at a modest level compared with that in TRKO TEFF cells. Additionally, diminished Tle3 binding in TbetKO TEFF cells was observed at other TEFF-associated genes such as Gzma, Cx3cr1 and Irf4 (Extended data Fig. 5g). In aggregates, these data demonstrate that Tbet and Runx3 are both critical for Tle3 recruitment and its stabilized binding, and further suggest that Tle3 functions as an integrator of Tbet and Runx3 TFs to promote activation of TEFF transcriptional program, and their cooperativity is inherited into TEM cells to safeguard their lineage fidelity.
We next investigated the direct connection between Tle3-TF complexes and TEM molecular features. Among the Tle3-opened ChrAccC6–8 sites, 1,211 sites were TEM signature ChrAcc sites (Fig. 4c). Two hundreds and four of the TEM signature sites overlapped with “TEFF-acquired” Tle3 binding sites, with 54% co-occupied by Tbet and 41% by both Tbet and Runx3 (Fig. 5h), demonstrating that Tle3 functions as a critical cofactor for Tbet to establish/maintain the open state of TEM signature sites. By examining +/–100kb regions flanking the TSS of DEGs, “TEFF-acquired” Tle3-bound, Tle3-opened ChrAcc sites were predominantly associated with Tle3-activated genes (Fig. 5i, top). Focusing on DEGs between WT and Tle3−/− TEM cells specifically, Tle3 deficiency resulted in concordant reduction in ChrAcc and gene expression (quadrant iii in Fig. 5j), as observed at the TEM signature genes, such as Klrg1, Cx3cr1, Prdm1, and Bhlhe40 (Fig. 4f). Significantly, several Tle3-activated TEM signature genes required intact expression of Tbet and Runx3 for normal expression from the early TEFF stage, with Klrg1, Esm1, and S1pr5 showing clear dependence on Tbet (Fig. 5k), further corroborating that Tle3 engages both Tbet and Runx3 for establishing TEM transcriptional program. Collectively, Tle3 acquired de novo binding sites in TEFF and TEM cells, and intact expression of Tle3 was necessary for keeping the Tle3 binding sites at open chromatin state and maintaining the expression of these TEM signature genes.
On the flip side, Tle3-closed chromatin sites in ChrAccC1–5 showed much higher overlap frequency with “TEFF-attenuated” Tle3 binding sites in Cluster3 than that with “TEFF-acquired” sites in Cluster1 (Fig. 4e, blue square), and these sites were enriched in Runx and Tcf/Lef motifs beside the Ets motifs (Extended data Fig. 6a). By focusing on the 692 TCM signature ChrAcc sites that became more open in Tle3−/− TM cells (in Tle3-closed ChrAccC1–5, Fig. 4c), 127 sites overlapped with “TEFF-attenuated” Tle3 binding sites, with 95% being preoccupied by Tcf1 in TN cells based on our previously published Tcf1 ChIPseq data45, 46, while 28% being co-occupied by Runx3 in TEFF cells (Extended data Fig. 6b). Based on these observations, we posited that Tle3-closed TCM signature ChrAcc sites might involve at least two non-exclusive mechanisms. The first required direct repression by Tle3-Runx3 complex, as observed at downstream regions of Ccr7 and an intronic region of Itgae (encoding CD103, a marker for resident memory CD8+ T cells) (Extended data Fig. 6c), where Tle3 binding was weakened in TEM compared to TN cells, but was nonetheless necessary to restrain ChrAcc. The second mechanism was likely secondary to elevated Tcf1 expression in Tle3−/− TEM and TCM cells (Fig. 3f). Tcf1 is highly expressed in TN cells, but profoundly downregulated in TEFF cells47. The attenuation of Tle3 binding in TEFF cells can be partly ascribed to downregulation of its partner TF, Tcf1. The prevalent pre-occupancy by Tcf1 at the TCM signature ChrAcc sites in TN cells suggests that these sites were intrinsically accessible by Tcf1 and became more open when Tcf1 became more available in Tle3−/− TEM and TCM cells. This was observed at the TSS and upstream regions of Ccr7, where multiple TCM signature ChrAcc sites were co-occupied by the Tle3-Tcf1 complex in WT TN cells. These mechanisms were evidently in play at the TCM-characteristic genes, such as Tcf7, Sell and Id3 (Extended data Fig. 6d), where the associated TCM signature ChrAcc sites were increased in the absence of Tle3, but did not meet the stringent ≥3-fold change requirements. Collectively, these data support the notion that Tle3 restrained the expression of TCM-characteristic genes in TEM cells via direct and indirect mechanisms. Additionally, we also noted that the Tle3-closed ChrAcc sites overlapping with “TEFF-attenuated” Tle3 binding sites showed similar rate of association with Tle3-repressed and Tle3-activated genes (Fig. 5i, quadrant i and iv in Fig. 5j, respectively), suggesting that Tle3-repressed elements could function as enhancers or silencers depending on the gene context. In the Il2ra gene for example, the increased ChrAcc sites in Tle3−/− TEM cells might be potential silencers, leading to diminished CD25 expression (Extended data Fig. 6e). These analyses demonstrate that the combinatorial use of Tle3-mediated activating and repressive functions favors TEM but restrains TCM formation process.
Targeting Tle3 reprograms memory CD8+ T cell fate.
Given the Tle3 binding dynamics and its profound impact on ChrAcc and transcription states, we performed lineage tracing studies to determine its regulatory roles in fate decision and plasticity of memory CD8+ T cells. Firstly, TEM cells are known to convert to TCM cells over time5, 10. On 14 dpi during CD8+ T cell response to LCMV-Arm, the contraction of TEFF cells largely concludes, with TEM and TCM cells starting to emerge. We sorted the ‘emerging’ WT or Tle3−/− TCM and TEM cells and transferred the same numbers of cells into infection-matched CD45.1+ recipients. Twenty days later, both WT and Tle3−/− TCM cells persisted as CD62Lhi cells, consistent with known TCM lineage stability (Fig. 6a). In line with previous reports, ~1/4 of WT TEM cells became CD62Lhi, while about half of Tle3−/− TEM cells adopted CD62Lhi phenotype (Fig. 6a), suggesting that conversion/maturation of TEM to TCM cells was accelerated in the absence of Tle3. To further substantiate this point, we also sorted and transferred the ‘established’ WT or Tle3−/− TEM cells at ≥30 dpi as above, and observed that Tle3−/− TEM cells consistently gave rise to higher frequency of CD62Lhi cells than WT TEM cells after 20 days (Fig. 6b).
Figure 6. Lineage tracing reveals Tle3 deficiency promotes TCM cell formation at all response stages.

a–b. Tle3-deficient TEM cells are actively converted to TCM cells. In Gzmb-Cre-mediated Tle3 ablation (Fig. 1), TCM and TEM cells were sort-purified on 14 dpi (a) or ≥30 dpi (b) (left columns) and adoptively transferred into infection-matched CD45-disparate recipients (3×10⁵ TCM or 5×10⁵ TEM cells/recipient), followed by detection of CD62L+ TCM cells after 20 days (right columns).
c. Tle3-deficient TEFF cells give rise to TCM cells. In Gzmb-Cre-mediated Tle3 ablation (Fig. 1), TEFF and TMP cells were sort-purified on 8 dpi (left columns) and adoptively transferred into infection-matched CD45-disparate recipients (1.5×10⁶ TEFF and 3×10⁵ TMP cells/recipients), followed by detection of CD62L+ TCM cells after 15 days (right two columns).
d. Experimental design for assessing the impact of induced Tle3 ablation, where CreER+Tle3+/+ and CreER+Tle3FL/FL P14 cells were used as donor cells (5×10⁴ cells/recipient). The recipients were treated with Tamoxifen on 6 and 7 dpi to achieve Tle3 ablation at the effector phase, and treated again on 21 dpi to sustain Tle3 deletion.
e. Detection of TCM cells in recipient spleens at ≥28 days after induced Tle3 deletion at the effector phase. All contour plots are representative data from ≥2 experiments, and cumulative data on TCM cell frequency and numbers are means ± s.d. **, p<0.01; ***, p<0.001 by Student’s t-test.
Tle3 deficiency did not affect the TEFF and TMP composition on 8 dpi (Fig. 1e). To determine if loss of Tle3 caused intrinsic bias for TEM vs. TCM fate at this early stage, TEFF and TMP cells were sorted based on their characteristic KLRG1 and IL-7Rα expression patterns, and transferred into infection-matched recipients (Fig. 6c). Consistent with existing knowledge, WT TMP cells gave rise to CD62Lhi cells after fifteen days, whereas WT TEFF cells contributed little (Fig. 6c). Significantly, Tle3−/− TMP and TEFF cells both yielded CD62Lhi cells, with Tle3−/− TMP cells showing higher efficiency (Fig. 6c). These data suggested that targeting Tle3 endows TCM-producing capacity to the ‘trerminally differentiated’ TEFF cells, in addition to accelerating TMP to TCM transition.
Because Gzmb-Cre-mediated target gene ablation occurs right after CD8+ T cell activation even before the first division48, the early deletion of Tle3 may have predetermined the TMP vs. TEFF fate decisions8. To investigate if Tle3 had continued roles in directing TMP vs. TEFF differentiation, we generated P14+CreER+Tle3FL/FL and corresponding Tle3+/+ littermate controls, and performed adoptive transfer of P14 CD8+ T cells coupled with LCMV-Arm infection (Fig. 6d). The recipients were treated on 6 and 7 dpi after TMP vs. TEFF fate decision was made and again on 21 dpi to ensure Tle3 ablation. Two weeks later, analysis of TM composition showed elevated TCM frequency and numbers in P14+CreER+Tle3FL/FL-derived TM (called Tle3ΔCreER herein) cells (Fig. 6e). In addition, induced deletion of Tle3 increased the expression of TCM-characteristic Tcf1 and Eomes but reduced that of TEM-characteristic CX3CR1 and KLRG1 in TEM cells, without affecting their capacity of IFN-γ and TNF production (Extended data Fig. 7a–c). These data support a continuous requirement for Tle3 to restrain TCM cell formation.
To investigate the impact of acute Tle3 deletion on ‘established’ TM cells, CreER+ Tle3FL/FL or Tle3+/+ P14 cells were adoptively transferred, recipients infected with LCMV-Arm as above. At ≥30 dpi, TEM cells were sorted from the immune mice and cultured ex vivo with 4-hydroxy-tamoxifen (4-OHT) for 48 hrs, and the resulting Tle3ΔCreER and WT TEM cells were subjected to RNA-seq and ATAC-seq analyses (Extended data Fig. 8a, top path). A total of 171 DEGs was identified, with Tle3ΔCreER TEM cells showing reduced expression of TEM signature genes such as Klrg1, Gzma, Klra9 and Ckb, but increased expression of TCM signature genes including Sell, Ccr7, Eomes and Mapk11 (Fig. 7a). By GSEA without a preset cut-off, TEM signature gene set was depleted, while TCM signature gene set was enriched in Tle3ΔCreER compared to WT TEM cells (Fig. 7b,c). Because of the short-duration of induced Tle3 deficiency, the criteria of ≥1.5-fold changes and FDR<0.05 were adopted for ChrAcc profile comparison, 1,458 ChrAcc sites were more ‘open’, while 455 sites were more ‘closed’ in Tle3ΔCreER compared to WT TEM cells (Fig. 7d). Approximately 12% of these differential ChrAcc sites overlapped with TM signature sites (as defined in Fig. 4b), and among these TM signature-overlapping sites, the more ‘closed’ ChrAcc sites in Tle3ΔCreER TEM cells were enriched with TEM signature sites, and the more ‘open’ ChrAcc sites in Tle3ΔCreER TEM cells were enriched with TCM signature sites (Fig. 7e). Specifically, the more ‘closed’ ChrAcc sites in Tle3ΔCreER TEM cells were found at TEM signature genes such as Ckb and Klra9, and effector function-associated genes including Ifng and Bhlhe40 (Fig. 7f, top); on the other hand, the more ‘open’ ChrAcc sites in Tle3ΔCreER TEM cells were observed at TCM signature genes including Ccr7, Sell and Socs1 (Fig. 7f, bottom). These observations demonstrate that acute deletion of Tle3 had immediate impact on diminishing TEM but promoting TCM molecular features in TEM cells, suggesting an early onset of TEM to TCM cell fate reprogramming upon loss of Tle3.
Figure 7. Induced Tle3 deletion in ‘established’ TEM cells promotes TCM formation while sustaining its functionality.

a. Volcano plot showing DEGs between WT and Tle3ΔCreER TEM cells after ex vivo treatment with 4-OHT for 48 hrs, by the criteria of ≥1.5-fold expression changes and FDR<0.05. Values denote DEG numbers, and selected differentially expressed TCM and TEM signature genes are marked in red and blue, respectively.
b–c. Enrichment plots of TEM (b) and TCM (c) signature gene sets (defined in Fig. 3b) in comparison of Tle3ΔCreER vs. WT TEM cell transcriptomes with GSEA. In b, 37 of 90 TEM signature genes are in the leading-edge showing enrichment in WT TEM cells. In c, 82 of 181 TCM signature genes are in the leading edge showing enrichment in Tle3ΔCreER TEM cells. Top 20 enriched genes are shown in heatmaps for each gene set, with those in red denoting overlap with corresponding top 20 enriched genes in Fig. 3d and 3e, respectively.
d. Volcano plot showing differential ChrAcc sites between WT and Tle3ΔCreER TEM cells after ex vivo treatment with 4-OHT for 48 hrs, by the criteria of ≥1.5-fold ChrAcc changes and FDR<0.05, with values denoting site numbers.
e. Distribution of TCM and TEM signature ChrAcc sites in overlapping differential ChrAcc sites in Tle3ΔCreER vs. WT TEM cell comparison, with values in the plot denoting site numbers.
f. ChrAcc tracks at the TEM- (top) and TCM-characteristic genes (bottom) in WT and Tle3ΔCreER TEM cells. Blue open bars denote more ‘closed’ sites, and red bars denote more ‘open’ sites in Tle3ΔCreER compared to WT TEM cells.
g. Acute deletion of Tle3 in ‘established’ TEM cells promotes generation of TCM cells. WT and Tle3ΔCreER TEM cells were sort-purified from immune mice at 48 hrs after initial tamoxifen treatment and transferred into new hosts (5×10⁵ TEM cells/recipient), followed by detection of CD62L+ TCM cells after 14 days.
h–k. Recall capacity is sustained in Tle3-deficient TCM cells. WT and Tle3ΔCreER TCM cells were sort-purified from immune mice at 14 days after initial tamoxifen treatment and transferred into Rag1−/− recipients (2×10⁴ TCM cells/recipient), followed by LM-GP33 infection. Three days after infection, the recipient spleens were harvested for analyses of TCM-derived secondary (2°) effectors, including cell numbers (h), IFN-γ-producing fraction (i), and granzyme B expression (j). Also analyzed were recipient livers for colony-forming units (CFUs, k). Data are representative from one of two independent experiments.
To validate such impact in vivo, the immune mice were treated with tamoxifen for two consecutive days, and on the third day (48 hrs after the initial tamoxifen treatment), TEM cells were sorted and transferred into infection-matched recipients (Extended data Fig. 8a, middle path). After two weeks, Tle3ΔCreER TEM cells gave rise to higher frequency and numbers of CD62L+ cells than WT TEM cells (Fig. 7g). To determine the functionality of Tle3-deficient TCM cells, the immune mice were treated with tamoxifen but given two weeks to facilitate in situ “TEM-to-TCM reprogramming”. The resulting TCM cells were then sort-purified and transferred into Rag1−/− mice followed by infection with Listeria monocytogenes expressing the GP33 epitope (LM-GP33) (Extended data Fig. 8a, bottom path). In response to the recall stimulation, both WT and Tle3ΔCreER TCM cells underwent expansion and generated similar numbers of secondary effector CD8+ T cells (Fig. 7h), which showed similar capacity of IFN-γ production and granzyme B expression (Fig. 7i,j). While Listeria expanded rapidly in Rag1−/− mice due to lack of endogenous immune responses, the transfer of WT or Tle3ΔCreER TCM cells curbed bacterial expansion with similar efficacy (Fig. 7k), suggesting that TCM functions were not detectably affected by loss of Tle3. To further corroborate this point, we tested the pathogen-experienced TM cells in tumor control, with direct comparison with TN cells. We utilized Tle3ΔCreER TM cells where Tle3 was inducibly deleted at the effector phase (Fig. 6d), and transferred the same number of sort-purified P14+ TN, TCM and TEM cells into CD45-disparate recipients, followed by subcutaneous inoculation of B16 melanoma cells expressing the LCMV GP33 epitope (B16-GP33)49, 50. While all recipients of WT TN cells succumbed by 21 days after inoculation due to uncontrolled tumor growth, the recipients of WT TEM and WT TCM cells showed improved survival and impeded tumor growth, with WT TCM cells exhibiting stronger anti-tumor effect (Extended data Fig. 8b), consistent with previous reports51, 52. When Tle3-deficient TM cells were transferred, the recipients of WT and Tle3ΔCreER TEM cells had similar kinetics of tumor growth, and those of Tle3ΔCreER TCM cells showed significantly slowed tumor growth than those of WT TCM cells, albeit with similar survival curves (Extended data Fig. 8b,c). At the endpoint of the study (i.e., day 33 after tumor inoculation) when only TCM recipient mice survived, the recipients of Tle3ΔCreER TCM cells showed trends of reduced tumor sizes and increased numbers of tumor-infiltrating CD8+ lymphocytes (TILs) compared to those of WT TCM cells (Extended data Fig. 8d,e), whereas WT and Tle3ΔCreER TCM-derived TILs exhibited similar PD-1, Tim-3, and granzyme B expression (Extended data Fig. 8f,g). These data suggest that Tle3 ablation improved TCM production without compromising their recall responses to pathogens or tumor antigens.
Discussion
It has been generally accepted that the terminally differentiated effector CD8+ T cells have little contribution to TCM formation, and TEM cells undergo time-dependent, slow conversion to TCM cells. Here we show that Tle3 functions a major gatekeeping factor that limits the plasticity of effector and TEM cells. Ablating Tle3 endowed the TCM-forming capacity to the terminally differentiated effector CD8+ T cells, and greatly accelerated the conversion of TEM to TCM cells. Although the activated CD8+ T cells may have intrinsic bias for effector vs. memory fate decision within the initial cell divisions11, 53, our data demonstrate that such fate bias does not necessarily stay in fixation, but can be reprogrammed to favor TCM production. Importantly, the converted TCM cells mostly sustained their superior recall capacity in response to tumor antigen compared with naive CD8+ T cells and even TEM cells. These observations suggest that manipulating Tle3 expression and/or activity could be a useful strategy to improve anti-pathogen and anti-tumor immunity.
Sequence-specific TFs have been at the center of attention in regulating T cell development, differentiation and functions. Transcriptional coregulators, in spite of their unique capacity of interacting with multiple TFs, are largely left in neglect. The functional redundancy among the multiple Tle/Groucho cofactors has posed a unique challenge to dissecting their regulatory roles in T cell biology. Targeting all highly expressed Tle genes completely crippled accumulation of antigen-specific effector CD8+ T cells, a phenotype that was much more severe than targeting a single TF such as Runx3 or Tbet7, 17, 31. Such profound impact highlights the integrative functions of Tle cofactors from all TF complexes that utilize Tle proteins as a key component. On the other hand, selective targeting of Tle3 in this work demonstrated its unique requirement for sustaining TEM cell pool while restraining TCM formation. To our knowledge, this is a distinct function that has not been described for other TFs or epigenetic regulators. The biological impact of ablating Tle3 is likely a collective effect of perturbation of multiple TF complexes that are sensitive to reduction of Tle3 protein, which cannot be adequately compensated by the presence of co-expressed Tle1 and Tle4. In this sense, we propose that transcription coregulators including Tle/Groucho proteins should be considered in its own league, as integrators of TF complexes that are responsive to various external input.
Because of their ability to interact with multiple TFs, genomic distribution of Tle/Groucho proteins is expected to be dynamic, rather than static. Longitudinal tracking of Tle3 binding indeed revealed the dynamic redistribution of Tle3 in the CD8+ T cell genome during effector differentiation and memory formation processes. The active gain of Tle3 binding in antigen-experienced TEFF, TEM and TCM cells was concordant with induced Tbet expression in these cells. This study further identified Tbet as a new partner TF for Tle3, manifested in forms of physical protein-protein interaction and extensive colocalization in the TEFF genome. The Tbet-Tle3 cooperativity frequently involves Runx3, a known partner of Tle/Groucho proteins, to form multipartite complexes, which might be achieved through recruitment of Tbet-Tle3 complex to Runx3 binding sites and/or Runx3-Tle3 complex to Tbet binding sites. In fact, intact expression of Tbet and Runx3 is critical for effective Tle3 recruitment and its stable engagement in the regulatory complexes. On the other end of the spectrum, Tle3 binding is attenuated in TEFF and TEM cells in another set of genomic locations, some of which partly restored Tle3 binding in TCM cells. This Tle3 binding dynamics coincided with the expression pattern of Tcf1 and Lef1, classical TF partners for Tle cofactors, during CD8+ T cell responses, and their colocalization was supported by enriched Tcf/Lef motifs and presence of Tcf1 ChIPseq peaks at these genomic locations. It is noteworthy that gain and attenuation of Tle3 binding both occurred at Runx3-bound genomic locations, indicating that Runx3 by itself is not a sole determinant for Tle3 recruitment. Additionally, the less restrictive “GGAA” Ets motif was highly enriched in “TEFF-acquired” and “TEFF-attenuated” Tle3 binding sites. Ets family TFs include more than 30 members and at least 10 of these were abundantly expressed in T lineage cells54, 55. Further investigations are required to dissect composition of TF-cofactor complexes during CD8+ T cell responses, so as to fully understand Tle/Groucho dynamics. Nonetheless, our findings constitute an important step forward and highlight that Tle3 functions as an integrator of multiple transcriptional partners to regulate the plasticity of antigen-experienced CD8+ T cells.
While Groucho and Tle proteins are historically known as transcriptional repressors22, 24, their involvement in activating transcription has been observed in adipocytes56, 57. Our systematic molecular analyses revealed that Tle3 is responsible for ‘open’ chromatin state at its direct binding sites and is necessary for positive regulation of genes associated with such sites. In this capacity, the Tle3-Tbet complex appears to have a dominant role in activation of TEM-characteristic gene expression and chromatin accessibility landscape. In parallel, Tle3-dependent ‘closed’ chromatin state and gene repression contribute to restraining activation of TCM program, where both Tle3-Runx3 and Tle3-Tcf1 complexes could act through direct and indirect mechanisms. The direct effect does not need to be prevalent in terms of the quantity of complex-occupied genomic locations, and a deregulation of a key downstream TF, such as Tcf1, could have profound impact. For example, genetic ablation of Runx3 in TEFF cells caused aberrant activation of genes associated with follicular helper T (TFH) cell program, giving rise to Tcf1+CXCR5+ cells with B-cell help function17. In this context, compound deletion of Tcf1 together with Runx3 did prevent the TFH lineage divergence17. These findings reconcile nicely with the new observations in this work, which collectively indicate that Tle/Groucho-Runx3 complex, where all Tle proteins are likely involved, is responsible for complete repression of Tcf1 in TEFF cells. Specific ablation of Tle3 and hence disruption of the Tle3-Runx3 complex resulted in more nuanced regulation of Tcf1, allowing modest activation of the TCM program while avoiding the crippling effect of ablating Runx3 or all Tle proteins altogether on TEFF and TM cells17, 31. In sum, the combinatorial use of dual functions in gene regulation afforded Tle3 a unique capacity of guarding TEM lineage fidelity, and releasing the Tle3 brake thus facilitates and accelerates formation of TCM cells with better durability and more robust recall capacity.
METHODS
Mice.
C57BL/6J (B6), B6.SJL, Rosa26GFP, hCD2-Cre transgenic, Tbx21FL/FL and Runx3FL/FL mice were from the Jackson Laboratory. Tle3fl/fl, Gzmb-Cre transgenic, and Cre-ER knock-in mice were previously described26, 58, 59. All compound mouse strains used in this work were from in-house breeding at the animal care facilities of Hackensack University Medical Center. The mice were housed at 18–23°C with 40–60% humidity, with 12-hr light/12-hr dark cycles. All mice were 6–12 weeks of age, and both sexes were used without randomization or blinding. All mouse experiments were performed under protocols approved by the Institutional Animal Use and Care Committees of Center for Discovery and Innovation, Hackensack University Medical Center.
Flow cytometry.
Single-cell suspensions from the spleen and lymph nodes (LNs) were generated after mashing tissue through 70 μm cell strainer, and the cells were surface-, intracellularly or intranuclearly stained following standard protocols50. The fluorochrome-conjugated antibodies were as follows: anti-CD8 (53–6.7), anti-CD45.2 (104), anti-CD62L (MEL-14), anti-KLRG1 (2F1), anti-IL-7Rα (A7R34), anti-granzyme B (GB12), anti-IFN-γ (XMG1.2), anti-TNF (MP6-XT22), anti-IL-2 (JES6–5H4), and anti-Eomes (Dan11mag) were from Thermo Fisher Scientific. Anti-Tcf1 (C63D9) from Cell Signaling Technology; anti-CX3CR1 (SA011F11) from BioLegend. For detection of Eomes and Tcf1 proteins, surface-stained cells were fixed and permeabilized with the Foxp3/Transcription Factor Staining Buffer Set (eBiosciences/Thermo Fisher Scientific), followed by incubation with corresponding fluorochrome-conjugated antibodies. For cytokine staining, the cells were stimulated with GP33 (200 nM) in the presence of the protein transport inhibitor Brefeldin A for 5 hrs at 37°C, followed by standard intracellular staining. For detection of cell survival status, the PE Annexin V Apoptosis Detection Kit (BD Biosciences) was used following the manufacturer’s instruction. Cell sorting was performed on FACSAria (BD Biosciences). Data were collected on FACSCelesta flow cytometers (BD Biosciences) and were analyzed with FlowJo software v10.7.1 (TreeStar).
Adoptive transfer and acute infection.
Naïve P14 CD8+ T cells were isolated from the lymph nodes of WT, Gzmb-Cre+Rosa26GFPTle3FL/FL (Tle3−/−), CreER+Tle3FL/FL, hCD2-Cre+Rosa26GFPTbx21FL/FL (TbetKO), or hCD2-Cre+Rosa26GFPTbx21FL/FLRunx3FL/FL (TRKO) P14 TCR transgenic mice, and adoptively transferred into CD45.1+ B6.SJL recipients (2×10⁴ cells/recipient). On the following day, the recipients were intraperitoneally (i.p) infected with 2×10⁵ PFU of LCMV-Arm. Phenotypic, functional and molecular analyses were performed on 4 or 6 day post-infection (dpi) for early TEFF phase, 8 dpi as TEFF phase, and at 30–45 dpi as TM phase. In lineage tracking studies, WT or Tle3−/− P14 CD8+ T cells were first enriched from recipient spleens by depleting CD45.1+ cells using EasySep Biotin Positive Selection Kit II (StemCell Technology). The enriched cells were then sorted for TEFF and TMP cells on 8 dpi, and for CD62L+ and CD62L− cells on 14 or ≥30 dpi, and transferred into infection-matched CD45.1+ B6.SJL recipients (1.5×10⁶ TEFF, 3×10⁵ TMP, 3×10⁵ CD62L+ or 5×10⁵ CD62L− cells/recipient), which were analyzed after 14–20 days.
LCMV quantification.
Serum samples were collected from LCMV-Arm-infected mice at various timepoints, and the viral load was quantified with two complementary approaches. The first approach was quantitative PCR-based assay following a previously published protocol with minor adjustments60. In brief, total RNA was exacted from sera using TRIzol RNA isolation reagents, and reverse-transcribed with the Reverse Transcription Kit (Qiagen, RT31–100). The resulting cDNA was used as templates for quantitative PCR using the Universal SYBR Green Supermix (BioRad, Cat. No.1725271) and the following primers: 5’-CATTCACCTGGACTTTGTCAGACTC and 5’-GCAACTGCTGTGTTCCCGAAAC. The plasmid pHCMV-LCMV-Arm53b (Addgene, Cat. No. 15796) that expresses LCMV envelop glycoprotein61 was used to establish a standard curve through 10-fold serial dilutions, and virus copy numbers were then calculated accordingly. The second approach was a function-based standard plaque formation assay62. In brief, VERO cells were incubated with serially diluted serum samples at 37°C with 5% CO2 for 90 mins, and the cell monolayer was overlaid with 0.5% agarose dissolved in DMEM containing 5% FBS. Two days later, a layer of 0.02% neutral red was applied for overnight staining, and plaques were then counted.
TEM characterization ex vivo and TCM recall responses in vivo.
P14 Cre-ER+Tle3+/+ or Cre-ER+Tle3FL/FL cells were adoptively transferred, and recipients were infected as above to establish immune mice. TEM cells were sort-purified from the immune mice, cultured in the presence of 4-hydroxy-tamoxifen (4-OHT, 1 μM/ml), IL-7 and IL-15 (each at 10 ng/m) for 48 hrs, and viable WT and Tle3ΔCreER cells were re-sorted for molecular characterization. At various timepoints (as illustrated in Fig. 6d and Extended data Fig. 8a), the immune mice were administered with tamoxifen (4 mg/mouse) via oral gavage as previously described30.
For eliciting recall response to acute infection, the resulting WT or Tle3ΔCreER TCM cells were sorted at 2 weeks after tamoxifen treatment and transferred into Rag1−/− mice (2×10⁴ cells/recipient), followed by intravenous (i.v.) infection with LM-GP33 (5×10⁶ CFUs/mouse). Three days, secondary effector CD8+ T cells derived from TCM cells were analyzed in the spleen, and bacterial burden was determined in the livers by colony formation assay as previously described47.
To assess recall response in a tumor model, P14+ TN, WT or Tle3ΔCreER TEM or TCM cells were sort-purified and transferred into naive B6.SJL mice (5×10⁴ cells/mouse). One day later, the right flank of recipient mice was shaved, and subcutaneously (s.c.) injected with 2×10⁵ B16 melanoma cells expressing the LCMV GP33 epitope (B16-GP33) as previously described50. The tumor size was monitored every other day from day 9 after tumor inoculation, when the tumor was palpable. Tumor progression was determined by measuring tumor length multiplied by width using an electronic digital caliper. Mice were euthanized when the tumor reached an animal protocol threshold including tumor area of ≥225 mm2.
Immunoblotting and Immunoprecipitation.
To detect the abundance of Tle3 proteins, sorted naïve or effector CD8 T cells were extracted and immunoblotted with poly-clonal anti-Tle3 (Cat No.14464–1-AP, ProteinTech) and β-actin (13E5, Cell Signaling Technology). For detection of Tbet and Tle3 protein-protein interactions, FLAG-tagged Tbet and HA-tagged Tle3 cDNAs were subcloned into Mig-R1 plasmids and then co-transfected into 293T cells using Lipofectamine 2000 (Invitrogen/ThermoFisher Scientific). After 24 hrs, cell lysates were preincubated with ethidium bromide (EtBr, Bio-Rad Laboratories) at 100 μg/ml at 4°C for 30 min, followed by incubation with anti-FLAG antibody (clone M2, #F3165, MilliporeSigma) overnight at 4°C in the presence of EtBr and then 2-hr incubation with Dynabeads Protein G. The immunoprecipitated samples were immunoblotted with anti-HA (C29F4, Cell Signaling Technology). For detection of their interaction in murine primary effector CD8+ T cells, P14 naive CD8+ T cells were primed ex vivo and subjected to spinofection with retrovirus expressing FLAG-tagged Tbet and GFP, as previously described17, 48. The transduced GFP+CD45.2+ P14 cells were sort-purified and transferred into CD45.1+ B6.SJL recipient mice, followed by LCMV-Arm infection. Six days later, CD45.2+ donor-derived effector CD8+ cells were enriched using EasySep PE positive selection kit (StemCell Technologies), the cell lysates were immunoprecipitated with the anti-FLAG antibody or IgG as above, followed by immunoblotting with the anti-Tle3 antibody.
Single cell RNA-seq (scRNA-seq) and data analysis.
WT or Tle3−/− P14 cells were adoptively transferred, and recipients were infected with LCMV-Arm as above. At 30–35 dpi, CD45.2+GFP+ P14 CD8+ T cells were sort-purified, 5×10³ live cells of each genotype were used to generate single-cell gel-bead in emulsion (GEM), and the scRNA-seq libraries were constructed with 10X Genomics Chromium Next GEM Single Cell 5’ library kit following the manufacturer’s manual. The libraries were sequenced on Illumina’s HiSeq4000 in paired-end read mode with the read length of 150 nucleotides at the Admera Health. The scRNA-seq data are deposited at the GEO (GSE216633) under the SuperSeries of GSE213041
Data processing and cell clustering.
Raw reads were processed following the instructions described in the Drop-seq Laboratory Protocol v3 using Drop-Seq Tools (v2.4.1) 63, and were aligned to mm10 mouse genome using STAR (v.2.7.9a) 64 following the default DropSeq-Tools pipeline. The aligned reads were further processed to generate digital gene expression files using Drop-Seq Tools (v2.4.1) 63, and unique molecular identifier (UMI) was calculated using Seurat (v4.1.2) 65. Cells with UMI<1,000 and those with mitochondrial content higher than 2.5 were excluded for downstream analyses. The UMI counts in high quality cells were normalized to UMI count per million total counts and log-transformed. Variable genes were selected based on average expression and dispersion. Ten principal components based on variable genes were used for UMAP manifold learning and clustering analyses.
The clustering of WT memory CD8+ T cells was performed using the shared nearest modularity optimization implemented in Seurat’s FindClusters function with the resolution parameter as 0.5. Marker genes were identified with Seurat’s FindAllMarkers function. Normalized gene expression data were shown as feature plots or violin plots, and scaled expression data of cluster marker genes were used to generate heatmaps. Trajectory analysis was performed using Monocle (v3) by learning a principal graph for the data and ordering cells along the graph 33, where the pseudotime scores of each cell are calculated from a full transcriptome profile using pseudotime function in Monocle. To define TCM and TEM signature genes based on single cell transcriptomes, the cells in TEM1 and TEM2 clusters were combined as TEM cells and then compared with those in TCM cluster. By criteria of ≥1.5 expression changes and FDR<0.05, 96 TCM and 53 TEM signature genes were identified.
For characterizing the impact of Tle3 deficiency, WT and Tle3−/− memory CD8+ T cells were pooled for UMAP clustering analysis as above. Using TCM and TEM signature genes defined above, TCM and TEM scores were calculated for each cell using Seurat’s “AddModuleScore” function. The TCM and TEM scores were mapped on UMAP clusters or as scatter plot for each cluster with ggplot2.
RNA-seq and data analysis.
WT or Tle3−/− P14 TCM and TEM cells were sorted from recipient mice at 30–35 dpi, and each cell type was collected in three biological replicates. Ex vivo cultured WT or Tle3ΔCreET TEM cells were re-sorted for viable cells and collected in three replicates as well. Total RNA was extracted with TRIzol RNA isolation reagents (Invitrogen/ThermoFisher Scientific), and used for RNA-seq library construction by Azenta Life Sciences. In brief, full-length cDNA synthesis was performed with SMART-Seq HT Ultra Low Input Kit (Clontech/Takara Bio), and then processed with Nextera XT DNA Library Kit (Illumina). The libraries were sequenced on Illumina HiSeq instruments (4000 or equivalent) in paired-end read mode with the read length of 150 nucleotides. Raw sequence data (.bcl files) were converted into fastq files and de-multiplexed using the bcl2fastq 2.17 software (Illumina). The bulk RNA-seq data are deposited at the GEO (GSE213037 and GSE241532) under the SuperSeries of GSE213041.
The sequencing quality of RNA-seq libraries were assessed by FastQC (v0.11.9), and sequenced reads were then trimmed by 50 bp from the 3’-end to remove the low-quality bases using the Trimmomatic (v.0.39). The trimmed paired-end reads were mapped to the mm10 mouse genome using STAR-2.7.9a64, and only the pairs with mapping quality (MAPQ) ≥ 30 and both ends mapped to the same chromosome were retained. The mapped reads were converted to gene expression matrix by featureCounts (v.2.0.1), and then processed with DESeq2 (v1.32.0)38 to estimate expression levels of all genes as a gene-level Fragments Per Kilobase of transcripts per Million mapped reads (FPKM) values. Differentially expressed genes (DEGs) between a pair of conditions were identified by the criteria of ≥1.5-fold expression changes, FDR<0.05, and FPKM≥0.5 in the higher expression condition. DEGs from 3 key comparisons (defined in Extended data Fig. 3c) were collected for unsupervised K-means clustering analysis to define dynamic gene expression patterns.
Based on comparative analysis between WT TCM and WT TEM cell transcriptomes, TCM and TEM signatures were defined (Table S2) and used as custom gene sets in GSEA 66 to measure their relative enrichment in WT and Tle3-deficient TEM cells.
CUT&RUN and data analysis.
Cleavage Under Targets and Release Using Nuclease (CUT&RUN) was used for genome-wide mapping of Tle3 binding sites in naïve WT CD8+ T cells (3 biological replicates), WT TEFF (8 dpi, 2 replicates), WT TEM and TCM cells (≥30 dpi, 2 biological replicates each), Tle3 binding sites in WT and Tbet/Runx3-deficient (TRKO) early TEFF (4 dpi, 4 and 3 replicates, respectively), Tle3 binding sites in WT and Tbet-deficient (TbetKO) early TEFF (6 dpi, 4 and 3 replicates, respectively), Runx3 binding sites in WT or Runx3−/− early TEFF cells (4 dpi) and Tbet binding sites in WT or Tbx21−/− effector CD8+ T cells (6 dpi) following an improved protocol67 with minor modifications. In brief, the sort-purified cells (~1×10⁵ cells for each replicate) were fixed with 1% formaldehyde for 10 min at room temperature and then suspended in RIPA buffer (10 mM Tris-HCl pH7.5, 1 mM EDTA, 150 mM NaCl, 0.2% SDS, 0.1% w/v sodium deoxycholate, and 1% Triton X-100) for nuclei extraction. The nuclei were then incubated with 0.5 μg rabbit anti-Tle3 polyclonal antibody (11372–1-AP, Proteintech), rabbit anti-Runx3 polyclonal antibody (Ab11905, Abcam), rabbit anti-Tbet polyclonal antibody (13700–1-AP, Proteintech), or rabbit IgG in antibody-binding buffer (10 mM Tris-HCl pH7.5, 1 mM EDTA, 150 mM NaCl, and 1% Triton X-100) overnight with rotation. The unbound antibody was removed by washing the nucleus pellet with the Antibody-Binding buffer, and the nuclei were incubated with protein A/G-micrococcal nuclease (MNase) fusion protein (produced with prokaryotic expression plasmid from Addgene, plasmid #123461) for one hour at 4°C. The unbound MNase was removed by washing with Wash buffer (10 mM Tris-HCl pH7.5, 1 mM EDTA, 400 mM NaCl, and 1% Triton X-100). After suspended in Resuspension buffer (20 mM Tris-HCl pH7.5, 10 mM NaCl, and 0.1% Triton X-100), the antibody-bound MNase was activated by addition of CaCl2 (final concentration 2 mM) followed by 30 min incubation at 0°C. The reaction was quenched with Stopping buffer (20 mM Tris,-HCl pH 8.0, 10 mM EGTA, 20 mM NaCl, 0.2% SDS, and 0.2 μg/μl proteinase K), and then incubated at 65°C for 2 hrs to reverse the crosslinking. The DNA fragments were purified with MinElute Reaction Cleanup kit (QIAGEN), end-repaired, adaptor added and then amplified with PCR for 10–14 cycles with barcoded Nextera primers (Illumina). The amplified DNA fragments in the range of 150–1,000 bp were recovered from 2% E-Gel EX Agarose Gels (Invitrogen/ThermoFisher Scientific). The libraries were quantified using a KAPA Library Quantification kit (Roche) and sequenced on Illumina HiSeq4000 in paired-end read mode with the read length of 150 nucleotides at the Admera Health. The Tle3 CUT&RUN data were deposited at the GEO (GSE213036 and GSE241534) under the SuperSeries of GSE213041.
Data processing.
The sequencing quality of the libraries was assessed by FastQC v0.11.9 (http://www.bioinformatics.babraham.ac.uk/projects/fastqc/). The Trimmomatic (v.0.39) was used to retain 36 bp from 5’-end of the sequence. Bowtie2 v2.4.4 68 was used to align the sequencing reads to the mm10 mouse genome, and only uniquely mapped reads (MAPQ≥30) were retained. Samtools 1.13 69 was used to transfer the sam files to bam files and sort bam files. Picard MarkDuplicates 2.26.0 (https://github.com/broadinstitute/picard) was used to remove duplicate reads in the bam files. MACS v2.2.7.137 was used for Tle3 peak calling (paired-end mode, FDR<0.05), and Tle3 binding peaks in each cell type were called by applying MACS2 to the reads pooled from biological replicates.
Reproducibility analysis.
The Tle3 binding peaks called by MACS2 from four cell types (a total of 9 biological replicates) were merged into 34,292 union peaks. Raw counts in each library were mapped onto those union peaks, resulting in a 34,292 × 9 matrices with rows representing the peaks and columns representing the libraries. The raw-count matrices were then subjected to normalization as follows: each row, representing a peak region, was normalized by length of each peak region per kilobase (also used as peak signal score) and each column, representing a library, was then normalized by the column sum per million. The normalized matrices were subjected to PCA analysis.
Identification of dynamic Tle3 binding clusters during CD8+ T cell response.
Tle3 binding sites in TN, TEFF, TEM and TCM replicates were used to generate 34,292 × 9 raw-count matrices, which were used as input for DESeq2 (v.1.32.0)70 to identify dynamic Tle3 binding peaks. To identify the most significant, high-confidence changes in Tle3 binding strength during CD8+ T cell responses, stringent criteria were applied as the following: ≥3-fold binding strength changes, FDR<0.1, and the peak signal score (as defined above) ≥0.7 in cell type with higher binding strength. From 3 key comparison of TEFF, TEM, or TCM with TN cells, 3,627 dynamic Tle3 binding peaks were identified (as in Extended data Fig. 3c), and the corresponding 3,627 rows were extracted from the normalized 34,292 × 9 matrices and subjected to row-wise z-score transformation. The dynamic Tle3 peaks were separated into 3 major clusters based on K-means clustering analysis.
For specific analysis of less dynamic Tle3 binding peaks in memory CD8+ T cells, Tle3 binding peaks in TCM and TEM cells were called, and those overlapping with the 34,292 union peaks (defined from four cell types as above) were retained. The resulting 23,089 Tle3 binding peaks contained 3,041 dynamic Tle3 peaks, and the remainder 20,048 peaks were defined as less dynamic Tle3 peaks for downstream analysis.
For comparative analysis of Tle3 binding strength between WT and TRKO early TEFF and that between WT and TbetKO early TEFF cells, Tle3 binding peaks were called using genomic background with llocal=7500 and by the criteria of ≥2 fold enrichment and FDR<0.05, and then peaks called in IgG CUT&RUN samples were excluded from downstream analyses.
Analyses of Tle3 binding sites.
The distribution of dynamic Tle3 binding sites was determined with ChIPseeker’s annotatePeak function 71, where promoter region was defined as +/–1kb region flanking TSS. For motif analysis, HOMER (v4.10.0) 41 was used with default parameters, and the top motifs were extracted with the corresponding statistics (p-value and percentage of targets). For functional annotation, the Genomic Regions Enrichment of Annotations Tool (GREAT, v.4.0.4) was used with default settings 39.
ATAC-seq and data analysis.
WT or Tle3−/− TEM and TCM cells were sort-purified in 2–3 biological replicates for each cell type, and ex vivo cultured WT or Tle3ΔCreET TEM cells were re-sorted for viable cells and collected in 2–3 replicates. Approximately 1×10⁴ cells were used for ATAC-seq library preparation as previously described50. In brief, the sorted cells were treated in lysis buffer for 3 min on ice, and the extracted nuclei were resuspended in transposition mix containing 0.5 μl Transposase (Illumina) and incubated at 37°C for 30 min. The products were purified with MinElute Reaction Cleanup Kit (Qiagen) and then amplified with PCR for 13 cycles using barcoded Nextera primers (Illumina). DNA fragments in the range of 150–1,000 bp were recovered from 2% E-Gel EX Agarose Gels (Invitrogen, ThermoFisher Scientific). The libraries were quantified using a KAPA Library Quantification kit and sequenced on Illumina HiSeq4000 in paired-end read mode with the read length of 150 nucleotides at the Admera Health. The ATAC-seq data were deposited in the GEO (accession number GSE213035 and GSE241533) under the SuperSeries of GSE213041.
Data processing.
The sequencing quality of the libraries was assessed by FastQC v0.11.9. The Trimmomatic (v.0.39) was used to retain 36 bp from 5’-end of the sequence. Bowtie2 v2.4.4 68 was used to align the sequencing reads to the mm10 mouse genome, and only uniquely mapped reads (MAPQ≥30) were retained. Samtools 1.13 69 was used to transfer the sam files to bam files and sort bam files. Picard MarkDuplicates 2.26.0 (https://github.com/broadinstitute/picard) was used to remove duplicate reads in the bam files. MACS v2.2.7.1 37 was used for ATAC-seq peak calling (paired-end mode, FDR<0.05), and ATAC-seq peaks in each cell type were called by applying MACS2 to the reads pooled from biological replicates.
Reproducibility analysis.
The ATAC-seq peaks called by MACS2 from four cell type/states (i.e., WT or Tle3−/− TEM and TCM cells, a total of 10 biological replicates) were merged into 55,158 union peaks, which were defined as union chromatin accessibility (ChrAcc) sites. Raw counts in each library were mapped onto those union ChrAcc sites, resulting in a 55,158×10 matrices with rows representing the peaks and columns representing the libraries. The raw-count matrices were then subjected to normalization as follows: each row, representing a peak region, was normalized by length of each peak region per kilobase (also used as ChrAcc site signal score) and each column, representing a library, was then normalized by the column sum per million. The normalized matrices were subjected to PCA analysis.
Identification of differential ChrAcc clusters.
The 55,158×10 raw-count matrices were used as input for DESeq2 (v.1.32.0) 70 to identify differential ChrAcc sites between two cell types/states. To define TCM and TEM signature ChrAcc sites through WT TCM vs. WT TEM cell comparison, the criteria were applied as the following: ≥2-fold ChrAcc signal strength changes, FDR<0.05, and the ChrAcc site signal score (as defined above) ≥0.15 in cell type with higher ChrAcc signal strength (Fig. 3B). To identify the most significant, high-confidence changes in ChrAcc caused by Tle3 deficiency in memory CD8+ T cells, more stringent criteria were used in comparisons between WT and Tle3−/− TEM, and WT and Tle3−/− TCM cells as the following: ≥3-fold ChrAcc signal strength changes, FDR<0.05, and the ChrAcc site signal score (as defined above) ≥0.15 in cell type with higher ChrAcc signal strength (Extended data Fig. 3e). From the WT and Tle3−/− cell comparisons, 5,553 differential ChrAcc sites were identified (as in Fig. 4C), and the corresponding 5,553 rows were extracted from the normalized 55,158×10 matrices and subjected to row-wise z-score transformation. The differential ChrAcc sites were separated into 8 distinct clusters based on K-means clustering analysis.
Association of Tle3 binding sites and/or Diff ChrAcc sites with DEGs.
For assignment of dynamic Tle3 peaks or Diff ChrAcc sites to their target genes, a site that appears within +/–100 kb flanking region of gene TSS was considered to be associated with that gene. Sites located within +/– 1 kb from the TSS were designated as promoter-associated sites, and other sites outside the promoter regions were designated as distal sites. Note that one Tle3 binding or ChrAcc site could be associated with more than one unique Refseq gene(s).
Statistical analysis.
For comparison between two experimental groups, Student’s t-test was used. For multiple group comparisons, one way ANOVA was used to first determine whether any of the differences between the means are statistically significant, followed by 1) unpaired Student’s t-test to determine the statistical significance for a specific pair, or 2) post hoc Tukey’s multiple comparisons test to more stringently determine the statistical significance of differences between all possible pairs.
Extended Data
Extended Data Figure 1. Ablating Tle3 shows modest impact on the functions of antigen-responding CD8+ T cells without affecting viral clearance.

a. Gating stratey to identify CD45.2+ donor-derived P14 CD8+ T cells in CD45.1+ wild-type recipients.
b. Detection of cytokine production in effector CD8+ T cells on 8 dpi. CD45.2+ wild-type or Tle3−/− naive CD8+ T cells were transferred into CD45.1+ wild-type recipients, which were infected with LCMV-Arm the next day, following experimental design in Fig. 1c. GP33-induced production of IFN-γ (top) and TNF-α (bottom) was detected in CD45.2+CD8+ T cells. Representative contour plots (left) are from 2 independent experiments, with values denoting percentages of the gated population. Cumulative data (right) of the percentage of IFN-γ+ population in P14 CD8+ T cells and the percentage of TNF-α+ populations in IFN-γ+ P14 CD8+ T cells are means ± s.d.
c. Detection of granzyme B expression in effector CD8+ T cells by intracellular staining on 8 dpi. Representative histographs (left) are from 2 independent experiments, with the values denoting geometric mean fluorescence intensity (gMFI) of granzyme B. Cumulative data (left) are means ± s.d. ns, not statistically significant; *, p<0.05; ***, p<0.001 as determined with two-tailed Student’s t-test.
d–f. Detection of LCMV in recipient sera. The serum samples were collected from recipients of WT or Tle3−/− CD8+ T cells at the indicated time points, and LCMV was detected with either quantitative RT-PCR (d) or plaque assays (e, f). Note that in the plaque assay, sera were serially diluted for the measurement as exemplifed for the 4 dpi samples (e), and plaque forming units (PFUs) at 1:10 dilution were plotted for all time points (f).
g. Detection of TCM frequency at ≥30 dpi in the spleen (SP) and lymph nodes (LN) of CD45.1+ recipients where CD45.2+ Tle3−/− and CD45.1+ CD45.2+ WT P14 cells were mixed for co-transfer, followed by LCMV-Arm infection. Donor-derived TM cells were identified firstly by gating on CD45.2+ cells, in which CD45.1+ cells were from WT (black) while CD45.1−GFP+ cells were from Tle3−/− (blue).
Extended Data Figure 2. Targeting Tle3 promotes expression of TCM signature genes on the single cell level.

a. Volcano plot showing differential gene expression between the TCM and TEM1/2 clusters based on scRNA-seq analysis of WT memory CD8+ T cells. 96 TCM and 53 TEM signature genes were identified by the criteria of ≥1.5 expression changes and FDR<0.05.
b. UMAP plots of WT and Tle3−/− cells displaying TCM and TEM scores for single cells. The scores for each cell were calcuated based on the expression of 96 TCM and 53 TEM signature genes defined in a, using Seurat’s “AddModuleScore” function.
c. Scatter plots showing TCM and TEM scores for cells in each of the seven clusters as defined in Fig. 2e, with WT and Tle3−/− cells coded in distinct colors.
Extended Data Figure 3. Targeting Tle3 promotes TCM- but diminishes TEM-chracteristic molecular features.

a. Phenotypic analysis of WT and Tle3−/− P14 TM cells at ≥30 dpi based on select cell surface markers.
b. Gating strategy for cell sorting of WT and Tle3−/− TCM and TEM cells.
c. Key comparisons for analysis of transcriptomic and ChrAcc changes in this study.
d. Volcano plots showing DEGs between WT and Tle3−/− TEM cells (left) and those between WT and Tle3−/− TCM cells (right) by the criteria of ≥1.5-fold expression changes, FDR<0.05, and FPKM≥0.5 in the higher expression condition. Values in the plot denote DEG numbers in each pairwise comparison.
e. Volcano plots showing differential ChrAcc sites between WT and Tle3−/− TEM cells (left) and those between WT and Tle3−/− TCM cells (right) by a more stringent criteria of ≥3-fold signal strength changes and FDR<0.05. Values in the plot denote numbers of differential ChrAcc sites in each pairwise comparison.
Extended Data Figure 4. Differential Tle3 binding is associated with immune regulation during CD8+ T cell responses.

a. Principal component analysis (PCA) of Tle3 CUT&RUN libraries from WT TN, TEFF, TEM and TCM cells.
b. Volcano plots showing differential Tle3 binding sites in comparisons of TEFF, TEM and TCM with TN cells, where stringent criteria (≥3-fold difference in binding strength, adjusted p value <0.05) were used to define dynamic Tle3 binding sites. Values in plots denote numbers of dynamic Tle3 binding sites in each comparison.
c,e. Functional annotation of dynamic Tle3 binding sites in clusters 1 (c) and 3 (e) using GREAT analysis, with GO terms associated with immune regulation highlighted in orange. Values denote Hyper Observed Gene hits.
d,f. Tle3 CUT&RUN sequencing tracks showing cluster 1 (d) or 3 (f) Tle3 binding sites at select genes as displayed on IGV, with the dynamic Tle3 binding sites marked with open bars and subcluster information labeled. IgG CUT&RUN in TN cells was used as a negative control.
g. Detection frequency of dynamic Tle3 sites within +/–100 kb of TSS of DEGs in the five expression clusters defined in Fig. 3c. Values denote numbers of DEGs that are assocatied with dynamic Tle3 sites and those that are not (w/o).
h. Distribution of DEG-associated dynamic Tle3 binding sites in genomic regions. From panel g, the DEGs associated with dynamic Tle3 peaks are divided into three categories, based on Tle3 site locations in promoters, distal regulatory regions, or both; and the values denote DEG numbers in each category.
Extended Data Figure 5. Tle3 recruitment and stabilized binding require Runx3 and Tbet.

a. Stratification of less dynamic Tle3 binding sites with differential ChrAcc clusters as defined in Fig. 4c. Marked on the right are numbers and percentage of ChrAcc sites overlapping with less dynamic Tle3 binding peaks.
b. De novo motif analysis of ChrAcc clusters 6–8 (Fig. 4c, Tle3-opened) that overlapped with “less dynamic” Tle3 binding sites.
c. Principal component analysis (PCA) of Tle3 CUT&RUN sequencing libraries from WT and TRKO early TEFF cells isolated on 4 dpi.
d. Venn diagram showing the overlap of Tle3 binding sites identified in WT and TbetKO TEFF cells. Tle3 CUT&RUN was performed on WT (4 replicates) and TbetKO (in 3 replicates) TEFF cells isolated on 6 dpi. Note that a single Tle3 binding site called in one cell type could overlap with more than one sites in the other, and therefore, the sum of common and uniquely identified Tle3 binding sites in the Venn diagram is not necessarily equal to the total site numbers called in a specific cell type.
e. Boxplot showing the ratio of Tle3 binding strength in TbetKO to WT TEFF cells for Tle3 binding sites uniquely detected in each cell type. The box center lines denote the median, box edge denotes interquartile range (IQR), and whiskers denote the most extreme data points that are no more than 1.5 × IQR from the edge.
f. Cumulative frequency plot showing differential Tle3 binding strength in WT versus TbetKO TEFF cells at the 3,380 Tbet/Runx-dependent Tle3 binding sites (defined in Fig. 5f). Statitistical significance of the observed difference was determined with two-sided paired MWU test.
g. Sequencing tracks of Tle3 CUT&RUN in WT and TbetKO TEFF cells. Rectangles with solid lines denote differential Tle3 binding sites with TbetKO cells showing ≥1.25-fold decrease in binding strength with FDR<0.05, while those with dotted lines denote Tle3 binding sites indentifed in WT but not TbetKO TEFF cells by the same peak calling criteria.
Extended Data Figure 6. Tle3 restrains chromatin opening at TCM signature ChrAcc sites via direct and indirect means.

a. De novo motif analysis of ChrAcc clusters 1–5 that overlapped with “TEFF-attenuated” Tle3 binding sites (within blue square in Fig. 4e).
b. Venn diagram showing overlap of “TEFF-attenuated” Tle3 binding sites with Tcf1 binding sites in TN and Runx3 binding sites in TEFF cells at Tle3-closed TCM signature ChrAcc sites (from ChrAccC1–5 with red bars in Fig. 4c).
c,d. Sequencing tracks of Tle3 binding (top), Tcf1 and Runx3 binding (bottom), and ChrAcc states (middle) at TCM-characteristic genes as displayed on IGV. Open bars denote colocalized “TEFF-attenuated” Tle3 binding peaks and Tle3-closed ChrAcc sites, with Tle3 binding subcluster information marked on the top. Bars with dotted lines at the Ccr7 (c), Tcf7, Sell and Id3 (d) gene loci mark dynamic Tle3 binding sites where the ChrAcc changes between WT and Tle3−/− TEM cells did not reach the stringent ≥3-fold differences, while bars with grey dotted lines at the Id3 gene locus (d) mark differential ChrAcc sites between WT and Tle3−/− TEM cells, which are associated with “less dynamic” Tle3 binding sites (the Tle3 binding strength did not show ≥3fold changes during CD8+ T cell responses). Statistical data in the comparison of the marked ChrAcc sites between WT and Tle3−/− TEM cells are shown for Tcf7, Sell and Id3 (d) genes under the tracks.
e. Tle3-bound, Tle3-closed ChrAcc sites can contribute to positive gene regulation, as observed at the Il2ra gene locus. We posit that these Tle3-bound elements may have the potential to function as silencers, and the Tle3 binding likely maintains their inactive state, allowing their target genes to be expressed/induced in WT cells. Loss of Tle3 resulted in increased ChrAcc at these elements, unleashing the silencer activity and hence leading to target gene repression.
Extended Data Figure 7. Induced deletion of Tle3 at the effector phase promotes TCM cell features without detectably affecting TM cell functions.

a–b. Detection of TCM (a) and TEM (b) characteristic proteins with flow cytometry. CreER+Tle3+/+ (WT) and CreER+Tle3FL/FL (Tle3DCreER) P14 cells were adoptively transferred, followed by LCMV-Arm infection. The recipients were treated with Tamoxifen on 6 and 7 dpi to achieve Tle3 deletion at the effector phase, and treated again on 21 dpi to sustain Tle3 deletion (as in Fig. 6d). At ≥35 dpi, donor-derived P14 memory CD8+ T cells in the recipient spleens were analyzed for TCM and TEM-characteristic proteins. Half-stacked histograms are representative data from at least 2 independent experiments with values denoting gMFI. Cumulative data for each protein are means ± s.d., with individual data points shown.
c. Detection of cytokine production in GP33-stimulated TCM and TEM cells. Representative contour plots (left) are from 2 independent experiments, with values denoting percentages of the gated population. Cumulative data (right) of the percentage of IFN-γ+ population in P14 CD8+ T cells and the percentage of TNF-α+ populations in IFN-γ+ P14 CD8+ T cells are means ± s.d.
For all panels, statistical significance for multiple group comparisons was first determined with one-way ANOVA, and Tukey’s test was used as post-hoc correction for indicated pair-wise comparison. *, p<0.05; **, p<0.01; ***, p<0.001; ns, not statistically significant.
Extended Data Figure 8. Targetig Tle3 promotes TCM cell formation without compromising its recall capacity.

a. Experimental design for investigating the impact of acute deletion of Tle3 in ‘established’ TEM cells.
b–g. Assessment of TCM recall response in B16 melanoma model. Note that WT and Tle3DCreER TCM cells were sort-purified following the study design in Fig. 6d. Data are from one of two independent experiments with similar results.
b. Kaplan-Meier survival curves of recipient mice that received 5´104 P14+ TN, WT or Tle3DCreER TCM or TEM cells, followed by s.c. inoculation of B16-GP33 cells (2´105/mouse, n=8 for each type of recipients). *, p<0.05; ***, p<0.001; ns, not statistically significant for indicated pair-wise comparison. Statistically insignificant time points are unmarked for clarity.
c. Tracking tumor growth in surviving recipient mice. *, p<0.05; **, p<0.01 for comparison between WT and Tle3DCreER TCM or TEM cells.
d. Tumor size in recipients of WT or Tle3DCreER TCM cells that survived till day 33 after tumor inoculation,
e–g. Analyses of tumor-infiltrating CD8+ lymphocytes (TILs) derived from WT or Tle3DCreER TCM cells in surviving recipients on day 33 after tumor inoculation, including cell counts (e), cell surface detection of Tim3 and PD-1 (f) and intracellular detection of granzyme B (g).
Supplementary Material
Acknowledgements
We thank the HMH-CDI Flow Cytometry Core facility (M. Poulus and W. Tsao) for cell sorting. We thank Drs Jianmin Wang (Roswell Park Comprehensive Cancer Center), Qing-Sheng Mi and Indra Adrianto (Henry Ford Health) for their input in possessing NextGen sequencing data. This study is supported in-part by grants from the NIH (AI121080, AI139874, and AI112579 to H.-H.X.) and the Veteran Affairs (BX005771 to H.-H.X.). Q.S. is supported by the CAMS Innovation Fund for Medical Sciences (2022-I2M-1–024, 2022-I2M-2–004, 2021-I2M-1–047), the Non-profit Central Research Institute Fund of Chinese Academy of Medical Sciences (2022-RC310–11). The authors declare no conflict of interests.
Data Availability
The Tle3 CUT&RUN, bulk RNA-seq, single-cell RNA-seq, and ATAC-seq data in CD8+ T cells are deposited at the Gene Expression Omnibus under accession number GSE213041.
References
- 1.Akondy RS et al. Origin and differentiation of human memory CD8 T cells after vaccination. Nature 552, 362–367 (2017). [DOI] [PMC free article] [PubMed] [Google Scholar]
- 2.Jameson SC & Masopust D Understanding Subset Diversity in T Cell Memory. Immunity 48, 214–226 (2018). [DOI] [PMC free article] [PubMed] [Google Scholar]
- 3.Martin MD & Badovinac VP Defining Memory CD8 T Cell. Front Immunol 9, 2692 (2018). [DOI] [PMC free article] [PubMed] [Google Scholar]
- 4.Sallusto F, Lenig D, Forster R, Lipp M & Lanzavecchia A Two subsets of memory T lymphocytes with distinct homing potentials and effector functions. Nature 401, 708–712 (1999). [DOI] [PubMed] [Google Scholar]
- 5.Wherry EJ et al. Lineage relationship and protective immunity of memory CD8 T cell subsets. Nature immunology 4, 225–234 (2003). [DOI] [PubMed] [Google Scholar]
- 6.Kaech SM et al. Selective expression of the interleukin 7 receptor identifies effector CD8 T cells that give rise to long-lived memory cells. Nature immunology 4, 1191–1198 (2003). [DOI] [PubMed] [Google Scholar]
- 7.Joshi NS et al. Inflammation directs memory precursor and short-lived effector CD8(+) T cell fates via the graded expression of T-bet transcription factor. Immunity 27, 281–295 (2007). [DOI] [PMC free article] [PubMed] [Google Scholar]
- 8.Lin WW et al. CD8(+) T Lymphocyte Self-Renewal during Effector Cell Determination. Cell Rep 17, 1773–1782 (2016). [DOI] [PMC free article] [PubMed] [Google Scholar]
- 9.Pais Ferreira D et al. Central memory CD8(+) T cells derive from stem-like Tcf7(hi) effector cells in the absence of cytotoxic differentiation. Immunity 53, 985–1000 e1011 (2020). [DOI] [PubMed] [Google Scholar]
- 10.Johnnidis JB et al. Inhibitory signaling sustains a distinct early memory CD8(+) T cell precursor that is resistant to DNA damage. Sci Immunol 6 (2021). [DOI] [PMC free article] [PubMed] [Google Scholar]
- 11.Chung HK, McDonald B & Kaech SM The architectural design of CD8+ T cell responses in acute and chronic infection: Parallel structures with divergent fates. J Exp Med 218 (2021). [DOI] [PMC free article] [PubMed] [Google Scholar]
- 12.Chen Y, Zander R, Khatun A, Schauder DM & Cui W Transcriptional and Epigenetic Regulation of Effector and Memory CD8 T Cell Differentiation. Front Immunol 9, 2826 (2018). [DOI] [PMC free article] [PubMed] [Google Scholar]
- 13.Kallies A, Xin A, Belz GT & Nutt SL Blimp-1 transcription factor is required for the differentiation of effector CD8(+) T cells and memory responses. Immunity 31, 283–295 (2009). [DOI] [PubMed] [Google Scholar]
- 14.Gautam S et al. The transcription factor c-Myb regulates CD8(+) T cell stemness and antitumor immunity. Nature immunology 20, 337–349 (2019). [DOI] [PMC free article] [PubMed] [Google Scholar]
- 15.Zhou X et al. Differentiation and persistence of memory CD8(+) T cells depend on T cell factor 1. Immunity 33, 229–240 (2010). [DOI] [PMC free article] [PubMed] [Google Scholar]
- 16.Pipkin ME Runx proteins and transcriptional mechanisms that govern memory CD8 T cell development. Immunol Rev 300, 100–124 (2021). [DOI] [PMC free article] [PubMed] [Google Scholar]
- 17.Shan Q et al. The transcription factor Runx3 guards cytotoxic CD8(+) effector T cells against deviation towards follicular helper T cell lineage. Nature immunology 18, 931–939 (2017). [DOI] [PMC free article] [PubMed] [Google Scholar]
- 18.Orian A et al. A Myc-Groucho complex integrates EGF and Notch signaling to regulate neural development. Proceedings of the National Academy of Sciences of the United States of America 104, 15771–15776 (2007). [DOI] [PMC free article] [PubMed] [Google Scholar]
- 19.Ren B, Chee KJ, Kim TH & Maniatis T PRDI-BF1/Blimp-1 repression is mediated by corepressors of the Groucho family of proteins. Genes & development 13, 125–137 (1999). [DOI] [PMC free article] [PubMed] [Google Scholar]
- 20.Zhao X, Shan Q & Xue HH TCF1 in T cell immunity: a broadened frontier. Nat Rev Immunol 22, 147–157 (2022). [DOI] [PubMed] [Google Scholar]
- 21.Seo W & Taniuchi I The Roles of RUNX Family Proteins in Development of Immune Cells. Mol Cells 43, 107–113 (2020). [DOI] [PMC free article] [PubMed] [Google Scholar]
- 22.Turki-Judeh W & Courey AJ Groucho: a corepressor with instructive roles in development. Curr Top Dev Biol 98, 65–96 (2012). [DOI] [PubMed] [Google Scholar]
- 23.Buscarlet M & Stifani S The ‘Marx’ of Groucho on development and disease. Trends in cell biology 17, 353–361 (2007). [DOI] [PubMed] [Google Scholar]
- 24.Jennings BH & Ish-Horowicz D The Groucho/TLE/Grg family of transcriptional co-repressors. Genome Biol 9, 205 (2008). [DOI] [PMC free article] [PubMed] [Google Scholar]
- 25.Gasperowicz M & Otto F Mammalian Groucho homologs: redundancy or specificity? Journal of cellular biochemistry 95, 670–687 (2005). [DOI] [PubMed] [Google Scholar]
- 26.Xing S et al. Tle corepressors are differentially partitioned to instruct CD8(+) T cell lineage choice and identity. J Exp Med 215, 2211–2226 (2018). [DOI] [PMC free article] [PubMed] [Google Scholar]
- 27.Wheat JC et al. The corepressor Tle4 is a novel regulator of murine hematopoiesis and bone development. PloS one 9, e105557 (2014). [DOI] [PMC free article] [PubMed] [Google Scholar]
- 28.Ramasamy S et al. Tle1 tumor suppressor negatively regulates inflammation in vivo and modulates NF-kappaB inflammatory pathway. Proceedings of the National Academy of Sciences of the United States of America 113, 1871–1876 (2016). [DOI] [PMC free article] [PubMed] [Google Scholar]
- 29.Rutishauser RL et al. Transcriptional repressor Blimp-1 promotes CD8(+) T cell terminal differentiation and represses the acquisition of central memory T cell properties. Immunity 31, 296–308 (2009). [DOI] [PMC free article] [PubMed] [Google Scholar]
- 30.Zhao X et al. beta-catenin and gamma-catenin are dispensable for T lymphocytes and AML leukemic stem cells. Elife 9 (2020). [DOI] [PMC free article] [PubMed] [Google Scholar]
- 31.Wang D et al. The Transcription Factor Runx3 Establishes Chromatin Accessibility of cis-Regulatory Landscapes that Drive Memory Cytotoxic T Lymphocyte Formation. Immunity 48, 659–674 e656 (2018). [DOI] [PMC free article] [PubMed] [Google Scholar]
- 32.Mahajan VS et al. DOCK2 Sets the Threshold for Entry into the Virtual Memory CD8(+) T Cell Compartment by Negatively Regulating Tonic TCR Triggering. J Immunol 204, 49–57 (2020). [DOI] [PMC free article] [PubMed] [Google Scholar]
- 33.Cao J et al. The single-cell transcriptional landscape of mammalian organogenesis. Nature 566, 496–502 (2019). [DOI] [PMC free article] [PubMed] [Google Scholar]
- 34.Herndler-Brandstetter D et al. KLRG1(+) Effector CD8(+) T Cells Lose KLRG1, Differentiate into All Memory T Cell Lineages, and Convey Enhanced Protective Immunity. Immunity 48, 716–729 e718 (2018). [DOI] [PMC free article] [PubMed] [Google Scholar]
- 35.Gerlach C et al. The Chemokine Receptor CX3CR1 Defines Three Antigen-Experienced CD8 T Cell Subsets with Distinct Roles in Immune Surveillance and Homeostasis. Immunity 45, 1270–1284 (2016). [DOI] [PMC free article] [PubMed] [Google Scholar]
- 36.Skene PJ & Henikoff S An efficient targeted nuclease strategy for high-resolution mapping of DNA binding sites. Elife 6 (2017). [DOI] [PMC free article] [PubMed] [Google Scholar]
- 37.Zhang Y et al. Model-based analysis of ChIP-Seq (MACS). Genome Biol 9, R137 (2008). [DOI] [PMC free article] [PubMed] [Google Scholar]
- 38.Love MI, Huber W & Anders S Moderated estimation of fold change and dispersion for RNA-seq data with DESeq2. Genome Biol 15, 550 (2014). [DOI] [PMC free article] [PubMed] [Google Scholar]
- 39.McLean CY et al. GREAT improves functional interpretation of cis-regulatory regions. Nat Biotechnol 28, 495–501 (2010). [DOI] [PMC free article] [PubMed] [Google Scholar]
- 40.Guan T et al. ZEB1, ZEB2, and the miR-200 family form a counterregulatory network to regulate CD8(+) T cell fates. J Exp Med 215, 1153–1168 (2018). [DOI] [PMC free article] [PubMed] [Google Scholar]
- 41.Heinz S et al. Simple combinations of lineage-determining transcription factors prime cis-regulatory elements required for macrophage and B cell identities. Molecular cell 38, 576–589 (2010). [DOI] [PMC free article] [PubMed] [Google Scholar]
- 42.Levanon D et al. Transcriptional repression by AML1 and LEF-1 is mediated by the TLE/Groucho corepressors. Proceedings of the National Academy of Sciences of the United States of America 95, 11590–11595 (1998). [DOI] [PMC free article] [PubMed] [Google Scholar]
- 43.Chen G & Courey AJ Groucho/TLE family proteins and transcriptional repression. Gene 249, 1–16 (2000). [DOI] [PubMed] [Google Scholar]
- 44.Liu J et al. CTCF mediates CD8+ effector differentiation through dynamic redistribution and genomic reorganization. J Exp Med 220 (2023). [DOI] [PMC free article] [PubMed] [Google Scholar]
- 45.Shan Q et al. Tcf1 and Lef1 provide constant supervision to mature CD8(+) T cell identity and function by organizing genomic architecture. Nat Commun 12, 5863 (2021). [DOI] [PMC free article] [PubMed] [Google Scholar]
- 46.Shan Q et al. Tcf1-CTCF cooperativity shapes genomic architecture to promote CD8(+) T cell homeostasis. Nature immunology 23, 1222–1235 (2022). [DOI] [PMC free article] [PubMed] [Google Scholar]
- 47.Zhao DM et al. Constitutive activation of Wnt signaling favors generation of memory CD8 T cells. J Immunol 184, 1191–1199 (2010). [DOI] [PMC free article] [PubMed] [Google Scholar]
- 48.Shan Q et al. Tcf1 preprograms the mobilization of glycolysis in central memory CD8(+) T cells during recall responses. Nature immunology 23, 386–398 (2022). [DOI] [PMC free article] [PubMed] [Google Scholar]
- 49.Milner JJ et al. Runx3 programs CD8(+) T cell residency in non-lymphoid tissues and tumours. Nature 552, 253–257 (2017). [DOI] [PMC free article] [PubMed] [Google Scholar]
- 50.Shan Q et al. Ectopic Tcf1 expression instills a stem-like program in exhausted CD8(+) T cells to enhance viral and tumor immunity. Cell Mol Immunol 18, 1262–1277 (2021). [DOI] [PMC free article] [PubMed] [Google Scholar]
- 51.Busch DH, Frassle SP, Sommermeyer D, Buchholz VR & Riddell SR Role of memory T cell subsets for adoptive immunotherapy. Semin Immunol 28, 28–34 (2016). [DOI] [PMC free article] [PubMed] [Google Scholar]
- 52.Klebanoff CA et al. Central memory self/tumor-reactive CD8+ T cells confer superior antitumor immunity compared with effector memory T cells. Proceedings of the National Academy of Sciences of the United States of America 102, 9571–9576 (2005). [DOI] [PMC free article] [PubMed] [Google Scholar]
- 53.Henning AN, Roychoudhuri R & Restifo NP Epigenetic control of CD8(+) T cell differentiation. Nat Rev Immunol 18, 340–356 (2018). [DOI] [PMC free article] [PubMed] [Google Scholar]
- 54.Sharrocks AD The ETS-domain transcription factor family. Nat Rev Mol Cell Biol 2, 827–837 (2001). [DOI] [PubMed] [Google Scholar]
- 55.Anderson MK, Hernandez-Hoyos G, Diamond RA & Rothenberg EV Precise developmental regulation of Ets family transcription factors during specification and commitment to the T cell lineage. Development 126, 3131–3148 (1999). [DOI] [PubMed] [Google Scholar]
- 56.Villanueva CJ et al. TLE3 is a dual-function transcriptional coregulator of adipogenesis. Cell Metab 13, 413–427 (2011). [DOI] [PMC free article] [PubMed] [Google Scholar]
- 57.Pearson S et al. Loss of TLE3 promotes the mitochondrial program in beige adipocytes and improves glucose metabolism. Genes & development 33, 747–762 (2019). [DOI] [PMC free article] [PubMed] [Google Scholar]
- 58.Jacob J & Baltimore D Modelling T-cell memory by genetic marking of memory T cells in vivo. Nature 399, 593–597 (1999). [DOI] [PubMed] [Google Scholar]
- 59.Guo K et al. Disruption of peripheral leptin signaling in mice results in hyperleptinemia without associated metabolic abnormalities. Endocrinology 148, 3987–3997 (2007). [DOI] [PubMed] [Google Scholar]
- 60.McCausland MM & Crotty S Quantitative PCR technique for detecting lymphocytic choriomeningitis virus in vivo. J Virol Methods 147, 167–176 (2008). [DOI] [PMC free article] [PubMed] [Google Scholar]
- 61.Sena-Esteves M, Tebbets JC, Steffens S, Crombleholme T & Flake AW Optimized large-scale production of high titer lentivirus vector pseudotypes. J Virol Methods 122, 131–139 (2004). [DOI] [PubMed] [Google Scholar]
- 62.Welsh RM & Seedhom MO Lymphocytic choriomeningitis virus (LCMV): propagation, quantitation, and storage. Curr Protoc Microbiol Chapter 15, Unit 15A 11 (2008). [DOI] [PMC free article] [PubMed] [Google Scholar]
- 63.Macosko EZ et al. Highly Parallel Genome-wide Expression Profiling of Individual Cells Using Nanoliter Droplets. Cell 161, 1202–1214 (2015). [DOI] [PMC free article] [PubMed] [Google Scholar]
- 64.Dobin A et al. STAR: ultrafast universal RNA-seq aligner. Bioinformatics 29, 15–21 (2013). [DOI] [PMC free article] [PubMed] [Google Scholar]
- 65.Hao Y et al. Integrated analysis of multimodal single-cell data. Cell 184, 3573–3587 e3529 (2021). [DOI] [PMC free article] [PubMed] [Google Scholar]
- 66.Simon M, Grandage VL, Linch DC & Khwaja A Constitutive activation of the Wnt/beta-catenin signalling pathway in acute myeloid leukaemia. Oncogene 24, 2410–2420 (2005). [DOI] [PubMed] [Google Scholar]
- 67.Meers MP, Bryson TD, Henikoff JG & Henikoff S Improved CUT&RUN chromatin profiling tools. Elife 8 (2019). [DOI] [PMC free article] [PubMed] [Google Scholar]
- 68.Langmead B & Salzberg SL Fast gapped-read alignment with Bowtie 2. Nat Methods 9, 357–359 (2012). [DOI] [PMC free article] [PubMed] [Google Scholar]
- 69.Li H et al. The Sequence Alignment/Map format and SAMtools. Bioinformatics 25, 2078–2079 (2009). [DOI] [PMC free article] [PubMed] [Google Scholar]
- 70.Robinson MD, McCarthy DJ & Smyth GK edgeR: a Bioconductor package for differential expression analysis of digital gene expression data. Bioinformatics 26, 139–140 (2010). [DOI] [PMC free article] [PubMed] [Google Scholar]
- 71.Yu G, Wang LG & He QY ChIPseeker: an R/Bioconductor package for ChIP peak annotation, comparison and visualization. Bioinformatics 31, 2382–2383 (2015). [DOI] [PubMed] [Google Scholar]
Associated Data
This section collects any data citations, data availability statements, or supplementary materials included in this article.
Supplementary Materials
Data Availability Statement
The Tle3 CUT&RUN, bulk RNA-seq, single-cell RNA-seq, and ATAC-seq data in CD8+ T cells are deposited at the Gene Expression Omnibus under accession number GSE213041.