

Abstract
Supra-aortic extra-anatomic debranch (SAD) are prosthetic surgical grafts used to revascularize head and neck arteries that would be blocked during a surgical or hybrid procedure used in treating ascending and arch of the aorta pathologies. However, bypassing the supra-aortic arteries but not occluding their orifice might introduce potential for competitive flow that reduces bypass patency. Competitive flow within the bypasses across the supra-aortic arteries has not previously been identified. This research identified haemodynamics due to prophylactic inclusion of bypasses from the brachiocephalic artery (BCA) to the left common carotid artery (LCCA), and from the LCCA to left subclavian artery (LSA). Four model configurations investigated the risk of competitive flow and the necessity of intentionally blocking the proximal LSA and/or LCCA. Particle image velocimetry (PIV) was used to assess haemodynamics in each model configuration. We found potential for competitive flow in the BCA-LCCA bypass when the LSA was blocked, in the LSA-LCCA bypass, when the LCCA alone or LCCA and LSA were blocked. Flow stagnated at the start of systole within the RCCA-LCCA bypass, along with notable recirculation zones and reciprocating flow occurring throughout systolic flow. Flow also stagnated in the LCCA-LSA bypass when the LCCA was blocked. There was a large recirculation in the LCCA-LSA bypass when both the LCCA and LSA were blocked. The presence of competitive flow in all other configurations indicated that it is necessary to block or ligate the native LCCA and LSA once the debranch is made and the thoracic endovascular aortic repair (TEVAR) completed.
Keywords: Cardiovascular surgery, debranching, particle image velocimetry, haemodynamic modelling
Introduction
Cardiovascular diseases of the aortic arch can be difficult to treat due to the complexity of the arterial geometry. 1 Thoracic endovascular aortic repair (TEVAR) is a popular repair method for stenosis, dissection and/or aneurysm of the aorta. TEVAR have lower intra-operative mortality and shorter recovery times compared to open surgery. 2 TEVAR is an endovascular repair technique that is accessed via a percutaneous groin approach. The delivery system of the TEVAR has an average 7 mm in diameter size but the size of the endograft (covered stent) loaded within the delivery varies from 24 to 46 mm. TEVAR endograft requires a minimum 20 mm of healthy aorta proximal and distal of the disease region to achieve a seal. Depending on the location of the aortic arch aneurysm, the TEVAR graft may need to cover the 1 or 2 supra-aortic arteries. 3 To maintain blood perfusion to the upper extremities, brain and spinal cord, rerouting flow from one supra-aortic artery to another is essential.
There are typically 3 supra-aortic arteries. The brachiocephalic artery (BCA) is the first and largest branch. The BCA bifurcates into the right common carotid artery (RCCA) and right subclavian artery (RSA). The left common carotid artery (LCCA) is the second branch off the aortic arch, and the left subclavian artery (LSA) is the third branch. The BCA, LCCA and LSA provide blood to the upper limbs, spinal cord and brain. 4 Revascularisation of the affected arteries prevents cerebral malperfusion, spinal ischaemia and upper limb ischaemia.2,5 Sufficient blood perfusion is pivotal to prevent brain damage (Stroke), spinal cord ischaemia, organ malperfusion and mortality.
Supra-aortic extra-anatomic debranch (SAD) is a prosthetic surgical graft used to re-vascularise supra-aortic arteries that are blocked by the TEVAR endograft. SAD create alternate pathways for blood to flow (Figure 1). SAD can be used to circumvent occlusion of proximal supra-aortic arteries, 6 or when surgical intervention, such as TEVAR, leads to blockage of blood flow. 7 Bypasses between the BCA and LCCA (BC bypass) and between the LCCA and LSA (CS bypass) may be used for occlusive disease of the proximal LCCA and/or LSA, and for TEVAR that is situated over the LCCA and LSA inlets. 7
Figure 1.
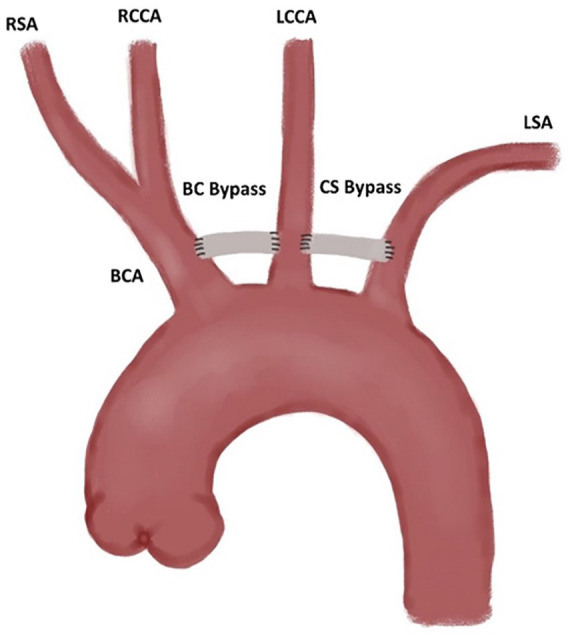
Extra-anatomic bypass example.
Clinical studies have been conducted on the efficacy of revascularisation of the LSA via SAD.2,3,5,8,9 Failing to revascularise the limb has a higher incidence of upper extremity ischaemia and stroke. 3 Revascularising the LCCA is always necessary to prevent cerebral ischaemia and stroke.10-12 SAD must be performed prior to TEVAR surgery.7,9 Debranching of the LSA is encouraged in non-emergency cases. 7 Debranching is performed prior to TEVAR surgery has been associated with lower incidence of neurologic complications and limb ischaemia.2,5 However, it is not clear whether the orifice or the proximal end of the LSA and LCCA should be ligated or embolised (with coils or plugs) following debranching.2,9 Feezor and Lee 3 suggest failing to embolise the proximal limbs may result in bypass graft occlusion due to low intra-graft flow rates and high recirculation zones. This low flow rate can be caused by a phenomenon termed ‘competitive flow’. Competitive flow can occur when the affected artery is not occluded, thereby enabling some flow through the anastomosed artery rather than the bypass. 13 Thus, competitive flow can lead to low rates of perfusion through the graft and may lead to graft occlusion. This issue is exacerbated if debranching is performed some days before the TEVAR surgery.
The aim of this study was to evaluate the necessity for occluding the origin of the LCCA and LSA following the implementation of various BC and CS bypass configurations and identify the risk of competitive flow. Competitive flow is defined as persistently low/stagnating flow in the BC or CS bypasses. Highly disrupted flow within the bypasses was also considered to result in an increased risk of occlusion. While competitive flow may cause occlusion in the bypasses, competitive flow within the BC and CS bypasses has not previously been investigated, in vivo, in vitro or in silico. This study uses particle image velocimetry (PIV) to capture haemodynamic behaviour across the lateral plane in a silicone model of the aortic arch with debranching of supra-aortic arteries. PIV analysis using thin walled phantoms allows for fluid solid interactions (FSI) that mimic physiology. While CFD can also model FSI, to do so in complex geometry requires extensive computational resources, and can yield poor results if one of the model assumptions is inaccurate. 14 ”
Methods
Model design
An idealised model of the aortic arch with 3 supra-aortic arteries was designed using geometric dimensions of the aortic arch, brachiocephalic, left common carotid and left subclavian artery from Huetter et al 15 (1.5x scale in Figure 2). Supra-aortic arteries were designed perpendicular to the aortic wall. Distal branching beyond the brachiocephalic bifurcation was omitted from the model and the branch lengths were increased to reduce the effects of rigid fixings on the fluid flow behaviour. Tortuosity of the aortic arch and branched arteries was also omitted to ensure planar illumination of the PIV system yielded meaningful, full-field results. A simplified model was used as there are some common mutations that alter the morphology, leading to high inter-patient variability.16-18 Thus, the simplified model ensures generalisability.
Figure 2.
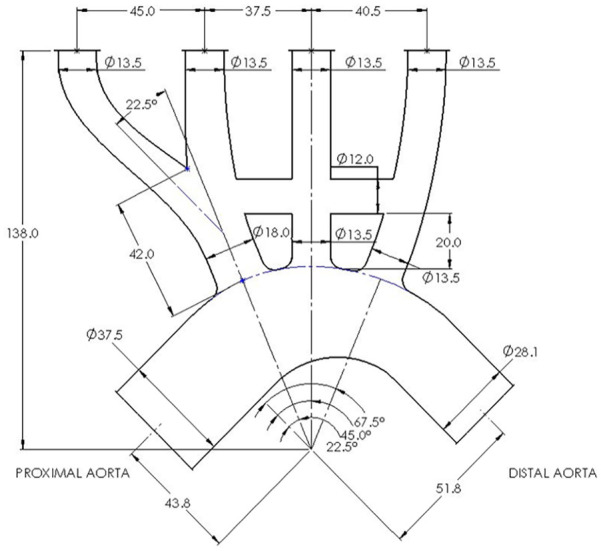
Scaled in-vitro idealised geometry. All dimensions in mm except when specified.
The phantom was manufactured with Sylgard 184 silicone (Dow Corning, MI, USA). Sylgard 184 has a Young’s modulus of 1.32 MPa. The model geometry was scaled to be 1.5x life scale to produce a consistently achievable wall thickness of 1.0 mm. Normalised compliance was matched across the phantom and in vivo using equation (1).
| (1) |
In which is the normalised compliance [MPa−1], is the resting diameter [mm], is the Young’s Modulus [MPa], and is the wall thickness [mm].
An SAD from the BCA to LCCA and the LCCA to LSA artery was included 20 mm distal of the aorta-LCCA intersection. The bypass locations were determined via literature, 19 and clinical expertise of one of the authors. The SAB had a scaled diameter of 12 mm. This diameter is 1.5x of a typical diameter for carotid-subclavian bypass grafts (8 mm). 8 The bypass was designed with a 2 mm wall thickness to achieve a compliance mismatch mimicking the mismatch between grafts and arterial tissue. The dimensions used and the potential in vivo ranges are provided in Table 1.
Table 1.
In vivo and in vitro arterial parameters for aortic arch and supra-aortic branches.
| In vivo | In vitro 1.5x scale | |
|---|---|---|
| Young’s modulus [MPa] | 0.561 (0.4-1.071) | 1.32 |
| Arterial wall thickness [mm] | 1.2 (1.16-1.63) | 1.0 |
| Bypass grafts wall thickness [mm] | N/A | 2.0 |
| Ascending aorta diameter [mm] | 25.0 (25.0-29.0) | 37.5 |
| Descending aorta diameter [mm] | 18.7 (18.3-25.0) | 28.1 |
| BCA diameter [mm] | 12.0 (8.5-12.4) | 18 |
| BCA length [mm] | 28.0 (28-34) | 42 |
| Right Subclavian Artery (RSA) diameter [mm] | 9.0 (8.4-9.9) | 13.5 |
| Right Common Carotid (RCCA) diameter [mm] | 9.0 (7.4-9.5) | 13.5 |
| LCCA diameter [mm] | 9.0 (7.4-9.5) | 13.5 |
| LSA diameter [mm] | 9.0 (8.4-9.9) | 13.5 |
| Bypass grafts diameter [mm] | 8.0 | 12 |
Phantom manufacture
The phantom was manufactured using a lost-core casting method adapted by Yazdi et al. 20 A 2-part female mould and one-part male mould, with 3 concentric locating flanges, were designed using SolidWorks (DS SolidWorks, VIY, France). A cavity between the moulds created the negative phantom geometry (Figure 3). The moulds were fuse deposition moulded (FDM) using a Stratasys F370 3D printer (Stratasys, REH, Israel). The moulds were post-processed using sandpaper starting at 240 grit up to 400 grit to remove FDM ridges. Follow sanding, the moulds were vapour smoothed using acetone. The moulds were assembled, and the cavity filled by injecting Sylgard 184 silicone (Dow Corning, MI, USA) from the base, allowing air to vent from the top. The silicone was cured at room temperature for 48 hours. Following curing, the female mould was mechanically removed, and the male mould was dissolved in acetone.
Figure 3.

3D printed mould and resultant thin-walled silicone phantom.
The effects of occluding the origin of the arteries were mimicked using a small silicone plug (Figure 4). The geometry of the silicone plug produced sufficient radial hoop stresses to remain located within the proximal supra-aortic LSA and LCCA during and between experiments. The plug protruded 1 mm into the aortic arch flow to create an effective seal. However, the protrusion into the aorta had a negligible effect on the flow within the supra-aortic arteries and bypasses. To model the potential presence of competitive flow, 4 model configurations were investigated: A) no blockages of any artery, B) blocked flow to the LCCA, C) blocked flow to the LSA, D) blocked flow to both the LCCA and LSA (Figure 5). Configuration A was used as the benchmark to compare the other configurations to.
Figure 4.
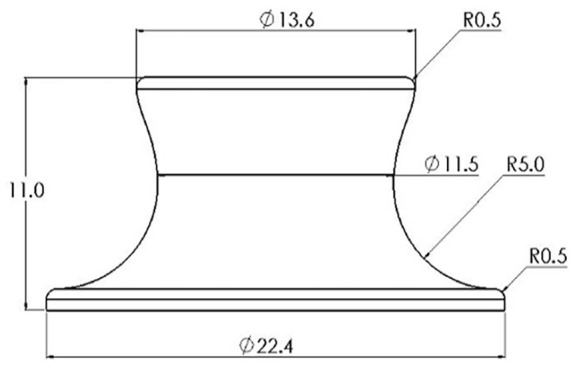
Silicone plug geometry.
Figure 5.

Model configurations (A) no blockages of any artery, (B) blocked flow to the LCCA, (C) blocked flow to the LSA and (D) blocked flow to both the LCCA and LSA.
Experimental configuration
A three-part transparent working solution containing 45.6% (by mass) water, 28.8% glycerine and 25.6% urea was used. The working solution had a refractive index of 1.41, matching that of Sylgard 184 silicone, and a kinematic viscosity of 3.15 × 10⁻⁶ m2∙s−1 21 . The scale and fluid viscosity were matched to in vivo geometry and blood viscosity (3.51 × 10⁻⁶ m2∙s−1) via dynamic matching of the Reynolds and Womersley Numbers (equations (2) and (3), respectively). Silver coated, hollow glass spheres, of nominal diameter 10 µm, were used to seed the flow.
| (2) |
| (3) |
where is the proximal aortic diameter [m], is the period of the waveform [s] and is the volumetric flowrate of the waveform [m3s−1].
A pulsatile waveform was scaled from Stalder et al 22 for the proximal aortic arch averaged across 30 young volunteers (23.8 ± 3.3 years old), taken at rest (Figure 6). The waveform was achieved with a dual-pump system adapted from Tsai and Savaş. 23 The experiment had peak Reynolds and Womersley numbers of 3880 and 17.4, respectively. These dimensionless values were obtained from Stalder et al. 22 Figure 7 shows the flow circuit. A diaphragm pump with in-built check valves (Figure 7B) provided the mean flow to the system, whilst a piston pump driven by a stepper motor (Figure 7C) modulated flow to form the pulsatile waveform. The piston was controlled by a DAQ acquisition system developed in LabVIEW (Figure 7K). A Krohne IFC300 electromagnetic flowmeter monitored the flow immediately proximal to the phantom inlet (Figure 7E). A 1.5 m pipe connected the flow straightener and flowmeter to allow flow to fully develop prior to entering the phantom. Repeatable waves were maintained using a closed feedback loop from the electromagnetic flowmeter to the DAQ acquisition system. The outlet pressure was controlled by a head tank 150 mm above the model LSA outlet (Figure 7G). A single head tank controlled the head pressure of all the model outlets.
Figure 6.
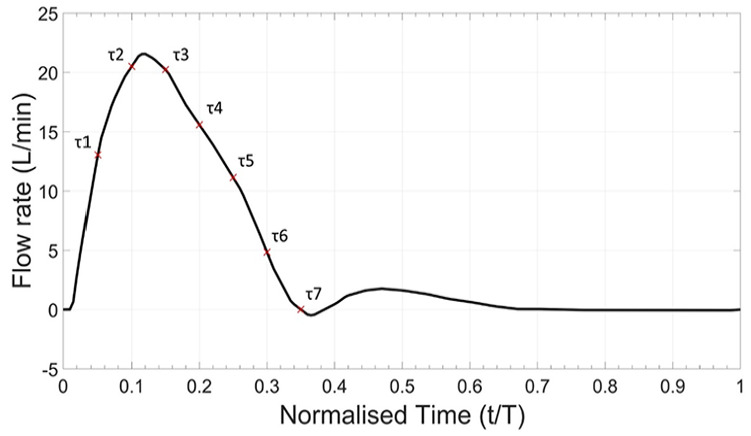
In vitro waveform for proximal aortic arch.
Figure 7.

The blue lines represent the fluid circuit. The red lines are the laser trigger and camera data cable. The orange circuit is the flowrate feedback loop. The components are: (A) reservoir, (B) in-line diaphragm pump, (C) piston pump, (D) flow straightener, (E) electromagnetic flowmeter, (F) Phantom model, (G) head tank, (H) overflow weir, (I) Nd:YAG laser, (J) camera, (K) data acquisition system and (L) DC power supply.
Planar PIV was used to capture the fluid behaviour through the phantom. A Double Pulse EverGreen 2 Nd:YAG laser illuminated the particles within a 1 mm thick slice of the fluid flow along the centre lateral plane. At each of the 7 equally spaced timepoints during systole (τ) (Figure 6), 50 image pairs were captured. To maintain accurate tracking of particles within the flow, the time delays between image pair captures varied depending on the flowrate of the fluid, from 200 to 1200 µs. A single TSI PowerView 4MP LS PIV camera (TSI Inc., USA) with 2360 × 1776 pixels resolution captured image pairs. TSI Insight 4G (TSI Inc., USA) was used for the initial processing of the image pairs and confirmed a minimum good vector validity of 92% across all image pairs. Full processing was carried out using PIVLab 24 in MATLAB (MathWorks, MA, USA). The velocity vector maps from the 50 image pairs for specific timepoints ( ) were ensemble averaged using a two-pass recursive Nyquist grid. This grid was initialised with a 64 × 64 interrogation window resolution and reducing to 32 × 32 on the second pass. A local median threshold rejected vectors if they were more than 0.05 m.s−1 different from over half of the surrounding vectors. Rejected vectors were replaced with interpolated estimates. 1.3% of vectors were rejected based on the local median threshold. This high level of vector congruence implies general stability and robustness of the PIV image postprocessing and the vector fields obtained.
Flow perfusion through the proximal supra-aortic arteries was evaluated for risk of ischaemia to the head and upper limbs. Volumetric flowrate was determined at 6 locations in the aortic arch phantom: (1) the proximal arch, (2) the BCA, (3) the proximal LCCA, (4) the proximal LSA, (5) the BC bypass and (6) the CS bypass (Figure 8). Five segments were extracted from each location and averaged to improve accuracy. Volumetric flowrate was calculated with equation (4).
Figure 8.
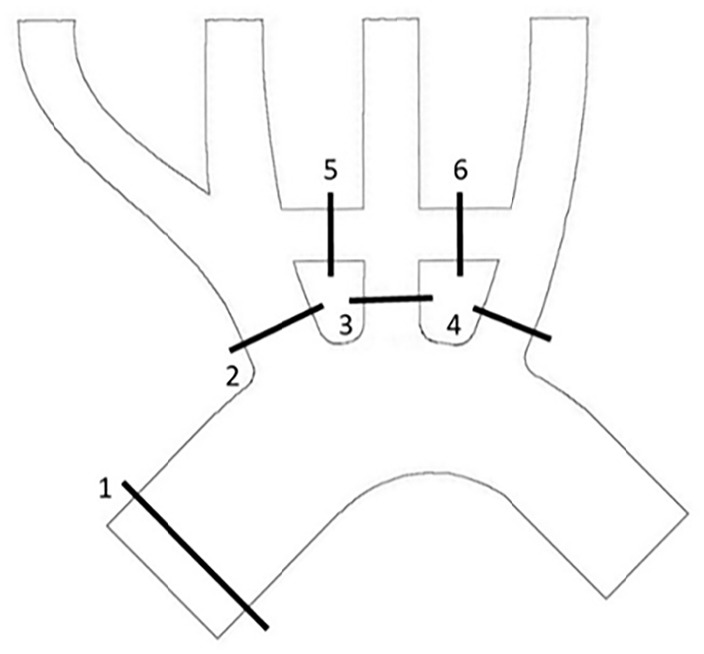
Flowrate extraction locations: (1) the proximal arch, (2) the BCA, (3) the proximal LCCA, (4) the proximal LSA, (5) the BC bypass and (6) the CS bypass.
| (4) |
Where: n is the number of segments used, b is a vector defining the distal axial direction, is the velocity vector at some variable radius from the centre of the lumen , the limits of are –r, and r.
Results
The vector profile for each of the configurations at the start of systole (τ2) showed normal flow through the aortic arch (Figure 9). Figure 9 middle and right show the velocity profiles through the BC bypass and CS bypass (labelled 5 and 6 in Figure 8) across the full waveform (τ1-τ7), for each of the configurations. The vector profiles show that flow velocity through the BCA was comparatively higher than the velocity through the proximal LCCA or LSA, regardless of the different configurations. Though, the velocities in the BCA did increase in configurations B-D, as to be expected. Configuration A had a low flow velocity through both the BC and CS bypasses. The low flow is confirmed in the velocity profiles, which, even at peak systole, did not exceed 0.1 m∙s−1. The velocity vectors for configuration B had a much-improved flow through the BC bypass at peak systole. However, there is very little flow through the CS bypass. The velocity profiles indicate that there was retrograde flow through late systole. Blocking the proximal LSA for configuration C showed good flow through both the BC and CS bypasses at τ2. However, there does appear to be some disruption to the flow path in the CS bypass. In particular, the CS bypass velocity profiles throughout systole have an s-shaped curve that presents negative velocities on the lower edge and positive velocities on the upper edge, implying recirculating flow. Configuration D had a high velocity flow through the BC bypass at τ2. The velocity, though lower, sustained the flow through the CS bypass as well. The velocity profile through both bypasses peaked at a higher velocity that any other configuration. There were some s-shaped curves through the BC bypass during late systole.
Figure 9.

Velocity vector map at peak systole (left) and respective systolic velocity profiles through the BC (middle) and CS bypasses (right) at the discrete timesteps ( 1- 7) for configurations (A) no blockages of any artery, (B) blocked flow to the LCCA, (C) blocked flow to the LSA and (D) blocked flow to both the LCCA and LSA. Note the different velocity scale across BC and CS bypasses.
The net volume of flow through each of the 6 locations (labelled in Figure 8) throughout systole is presented in Table 2. Configuration D had the lowest total volume of flow from proximal aorta to the supra-aortic arteries (6.0%). Perfusion through configuration A was similar to configuration D. Configuration B had the highest perfusion through the supra-aortic arteries of 8.0%. The net flow through both bypasses for all configurations is highest in configuration D. Configuration D had more than 4x the volume of flow through the BC bypass than any other configuration. The volume of flow through the bypasses of configuration A was far lower than any other configuration.
Table 2.
Volume of flow throughout systole.
| Systolic volume (τ1-τ7) [mL] | Proximal aorta | BCA | LCCA | LSA | Combined supra-aortic | BC bypass | CS bypass |
|---|---|---|---|---|---|---|---|
| Configuration A | 130.1 | 5.0 | 1.6 | 1.6 | 8.2 | −0.3 | −0.1 |
| Configuration B | 140.3 | 7.8 | - | 3.4 | 11.2 | 0.5 | −1.5 |
| Configuration C | 135.6 | 6.9 | 2.6 | - | 9.5 | 0.6 | 0.7 |
| Configuration D | 140.8 | 8.4 | - | - | 8.4 | 2.6 | 2.0 |
The low velocities identified through the BC bypass in configurations A (Figure 10A) and C (Figure 10B) were inspected for stagnation and recirculation. At τ1 there was a clear stagnation of flow in both configurations A and C. Reciprocating flow was identified through the bypass of configuration A at τ2-τ4. Configuration C also had clear disruption to the flow at τ3 and τ4. The flow disruptions and sudden flow direction changes were not present in configurations B and D.
Figure 10.

Flow through BC bypass during peak systole (τ1-τ4) for (A) configuration A and (B) configuration C.
Velocities within the CS bypass in configuration B had notable stagnations at τ1 and τ2 before establishing retrograde flow from the proximal LSA to distal LCCA (Figure 11A). The stagnation in the SC likely occurred due to the distal LCCA being fed by both bypasses, but the flow from the BC bypass had a shorter distance to travel. There was no stagnation within the CS bypass for configuration C (Figure 11B). However, recirculating flow was observed within the CS bypass resulting in the s-curve identified in Figure 9.
Figure 11.

Flow through CS bypass during peak systole (τ1-τ4) for (A) configuration B and (B) configuration C.
Discussion
This research modelled the haemodynamics within various configurations of extra-anatomic BC and CS bypasses. The presence of stagnating flow and recirculation zones within the bypasses may indicate a high risk of graft occlusion therefore requiring further intervention (re-do surgery) to remedy. 3 In vitro analysis was carried out using a phantom aortic arch and bypasses to identify flow behaviour that could affect bypass patency. In particular, the potential for flow competition within the bypasses was investigated. The analysis focused on the supra-aortic arteries, despite imaging the total aortic arch. Artefacts within the arch flow and distal of the bypasses were not investigated.
Figure 9 shows the velocity profiles and vector maps for each configuration at τ2. The in vitro peak velocities within the aortic arch were 0.48 m∙s−1 Reynolds number scaling leads to in vivo velocity of 0.75 m∙s−1, which is within the expected physiological range of peak systolic velocities in vivo through the aortic arch for a patient at rest. 25 Configurations B-D showed higher flow velocities through the BCA as a result of blocking the proximal regions of the LCCA and LSA. All configurations had the same BCA geometry and the same outlet head pressure (Figure 9). Hence, the increased flowrate in the BCA in configuration D was not due to any alterations in the BCA geometry. In vivo, it may be expected that the BCA would dilate in the post-operative months, increasing the overall flowrate and reducing the peak velocity in systole.
Endothelial cells have strong regenerative properties that enable growth through synthetic materials used in the manufacture of stents and bypasses. A newly deployed stent will typically be covered in a layer of cells within a few hours to days. 26 However, endothelial cell growth is highly dependent on the direction of fluid stimuli. 4 Stagnating and recirculating flow can result in multi-directional shear stresses that change the growth patterns of endothelial cells through the bypasses. 27 This may lead to abnormal aggregation of cells, which can result in narrowing the lumen of the bypass and potentially lead to total occlusion of the bypass prior to TEVAR deployment. The low flow through the bypasses of configuration A indicate there is a risk of bypass failure due to low shear stresses. However, the stagnant flow was much more notable through the CS bypass of configuration B. The vector map in Figure 9 shows an almost total lack of flow through the bypass indicating a notable stagnation. The velocity profile through the CS bypass indicates that there was little flow until late systole. Figure 11A confirms stagnation in the BC bypass at τ1 and τ2 due to competing flow. Configuration C showed improved flow through each of the bypasses. However, throughout mid to late systole, the velocity across the CS bypass had an s-shaped profile. Concurrent positive and negative flow within the bypass implies recirculation is occurring as was identified at τ4 in Figure 11B. Configuration D had the highest absolute velocities through each of the bypasses (Table 2). Typically, the flow was also parabolic indicating a much lower risk of flow competition compared to other configurations (Figure 9). High velocity flow gradients close to the wall indicates high wall shear stresses. Low wall shear stress is frequently linked to aggregation of fatty lipids and cell growth on the arterial wall and associated occlusion. 28 As such, it can be assumed that the higher internal velocity correlates to a lower risk of bypass failure in configuration D.
Table 2 showed the net volume of fluid passing through both bypasses of configuration D was higher than any other configuration. In contrast, the flow through configuration A bypasses was negligible. Low flow rates result in a low shear stress which has been linked to atherosclerotic lesion formation. 28 Flow through the CS bypass was similar between configurations B and D, though it flowed in inverse directions. The low flow through the CS bypass in configuration A and C implies a higher risk of bypass failure. However, Figure 11A shows that flow stagnated in the CS bypass of configuration B for 2 of the measured time steps. The comparatively low flow through the BC bypass of configurations A-C also indicates a risk of occlusion. Figure 10 identified flow stagnating within the BC bypass when none of the arteries were blocked (configuration A) and when the when the proximal LSA was occluded (configuration C). Stagnant flow indicates that the BC bypass of configuration A and C and the CS bypass of configuration B have an elevated risk of graft occlusion due to abnormal cell growth.
This experiment used an idealised model that ignored the tortuosity of the aortic arch and positioned the bypasses based on the surgical expertise of the third author. However, the positioning of the bypasses is often at the discretion of the surgeon and may not be aligned as they were in this experiment. Altering the alignments of the bypasses may change the momentum of flow. Any branching and bifurcations downstream of the BCA bifurcation was also ignored. The distal limbs were elongated beyond physiological lengths to reduce effect of wave reflection or fluid disturbances due to the rigid outlet fixings. However, the distal fluid flow behaviour was not evaluated in this experiment. Any downstream behaviour was assumed to have negligible effect on the flow through the proximal arteries or bypasses. Tortuosity was ignored as it poses an issue for PIV capture of primary flow. In particular PIV requires illumination of a plane to capture particles motion within that plane. Tortuosity can cause some secondary flow perpendicular to the axial direction of the arteries. Hence, such flow could not be identified on a plane, and may even confound the dominant flow features present. Hence, tortuosity has been ignored in this research.
Understanding the behaviour of flow through SAD is vital for determining the risks of flow competition for different configurations. Configurations A-C each presented with a stagnation zones and disrupted flow throughout systole. The disruptions may indicate the prophylactic use of the BC and CS bypasses prior to TEVAR deployment requires ligation of both the proximal LSA and LCCA to reduce the risk of bypass failure. Configuration A also had low flow throughout diastole which indicated that it had the highest risk of bypass occlusion. These findings have not been presented in prior literature. Sengupta et al 29 undertook CFD analysis in a rigid geometry similar to configuration C, but without the BC bypass. These important distinctions in geometry, FSI, and their incomplete model parameter definition makes comparison across papers difficult.
Conclusions
This article presents the first attempt to experimentally identify competitive flow through SADs. Clinically relevant results were obtained in this experiment, despite flow through the supra-aortic arteries being lower than expected. The goal was to understand the flow behaviour and interactions across the arteries and bypasses within the 4 configurations. The use of the BC and CS bypasses allowed fluid to flow to the distal LCCA and LSA even when the proximal arteries were blocked. There was a risk of flow competition within the bypasses for model configurations A-C. Configuration B appeared to have the highest risk due to a persisting stagnation within the CS bypass (Figure 11). However, throughout systole, the flowrates in configuration A remained very low and stagnation and recirculation zones could be identified during systole through the BC bypass (Figure 10). The confirmation of stagnating and recirculating flow in the BC or CS bypasses of the configurations A-C (Figures 10 and 11), indicated that ligating or embolisation of proximal arteries after being debranched may be necessary to reduce the loss of bypass patency or further progression of arterial disease. The identification of the potential of competitive flow through the BC bypass and CS bypass in configurations A-C but not in configuration D indicated that debranching prior to TEVAR may require the ligation or coil embolisation of the proximal LCCA and LSA. This paper provides the first indications of competitive flow in debranched supra-aortic arteries and will support cardiovascular surgeons in their decision to intentionally block the proximal LCCA and/or LSA.
Footnotes
The author(s) declared no potential conflicts of interest with respect to the research, authorship, and/or publication of this article.
Funding: The author(s) disclosed receipt of the following financial support for the research, authorship, and/or publication of this article: This project was supported by the University of Canterbury Doctoral Scholarship.
Author Contributions: Conceptualisation: PNW AK, Data Curation: PNW BMS, Formal Analysis: PNW PDD AK, Funding Acquisition: PDD, Investigation: PNW PDD BMS, Methodology: PNW, Project Administration: PNW PDD, Resources: PNW PDD, Software: PNW BMS, Supervision: PDD AK, Validation: PNW PDD AK BMS, Visualisation: PNW BMS, Writing – Original Draft Preparation: PNW, Writing – Review & Editing: PNW PDD AK BMS.
Ethical Statement: There were no humans or animals used in this research so ethical approval was not necessary.
ORCID iD: Paul D. Docherty  https://orcid.org/0000-0003-1661-2573
References
- 1. Singh C, Wang X, Morsi Y, Wong C. Importance of stent-graft design for aortic arch aneurysm repair. AIMS Bioeng. 2017;4:133-150. [Google Scholar]
- 2. Xydas S, Wei B, Takayama H, et al. Use of carotid-subclavian arterial bypass and thoracic endovascular aortic repair to minimize cerebral ischemia in total aortic arch reconstruction. J Thorac Cardiovasc Surg. 2010;139:717-722. [DOI] [PubMed] [Google Scholar]
- 3. Feezor RJ, Lee WA. Management of the left subclavian artery during TEVAR. Semin Vasc Surg. 2009;22:159-164. [DOI] [PubMed] [Google Scholar]
- 4. Caro CG. ed. The Mechanics of the Circulation. 2nd ed. Cambridge University Press; 2012. [Google Scholar]
- 5. Kamman AV, Eliason JL, Williams DM, et al. Impact of left subclavian artery revascularization before thoracic endovascular aortic repair on postoperative cerebrovascular hemodynamics. Ann Vasc Surg. 2018;46:307-313. [DOI] [PubMed] [Google Scholar]
- 6. Klonaris C, Kouvelos GN, Kafeza M, et al. Common carotid artery occlusion treatment: revealing a gap in the current guidelines. Eur J Vasc Endovasc Surg. 2013;46:291-298. [DOI] [PubMed] [Google Scholar]
- 7. Weigang E, Parker JA, Czerny M, et al. Should intentional endovascular stent-graft coverage of the left subclavian artery be preceded by prophylactic revascularisation? Eur J Cardio-Thorac Surg. 2011;40:858-868. [DOI] [PubMed] [Google Scholar]
- 8. AbuRahma AF, Robinson PA, Jennings TG. Carotid-subclavian bypass grafting with polytetrafluoroethylene grafts for symptomatic subclavian artery stenosis or occlusion: A 20-year experience. J Vasc Surg. 2000;32:411-418. [DOI] [PubMed] [Google Scholar]
- 9. Bertoglio L, Salvati S, Fittipaldi A, et al. Carotid to subclavian bypass and amplatzer vascular plug subclavian endovascular occlusion before thoracic open or endovascular repair. J Vasc Surg. 2020;71:1480-1488.e1. [DOI] [PubMed] [Google Scholar]
- 10. Melissano G, Civilini E, Bertoglio L, et al. Results of endografting of the aortic arch in different landing zones. Eur J Vasc Endovasc Surg. 2007;33:561-566. [DOI] [PubMed] [Google Scholar]
- 11. Lomazzi C, Grassi V, Domanin M, et al. Art of operative techniques: treatment options in arch penetrating aortic ulcer. Ann Cardiothorac Surg. 2019;8:500-508. [DOI] [PMC free article] [PubMed] [Google Scholar]
- 12. Han D, Jokisch C, McKinsey J. Expanding the landing zone for TEVAR. Endovasc Today. 2016;15:85-90. [Google Scholar]
- 13. Nakajima H, Kobayashi J, Tagusari O, et al. Competitive flow in arterial composite grafts and effect of graft arrangement in off-pump coronary revascularization. Ann Thorac Surg. 2004;78:481-486. [DOI] [PubMed] [Google Scholar]
- 14. Hirschhorn M, Tchantchaleishvili V, Stevens R, Rossano J, Throckmorton A. Fluid-structure interaction modeling in cardiovascular medicine - a systematic review 2017-2019. Med Eng Phys. 2020;78:1-13. [DOI] [PubMed] [Google Scholar]
- 15. Huetter L, Geoghegan PH, Docherty PD, et al. Application of a meta-analysis of aortic geometry to the generation of a compliant phantom for use in particle image velocimetry experimentation. IFAC-PapersOnLine. 2015;48:407-412. [Google Scholar]
- 16. Popieluszko P, Henry BM, Sanna B, et al. A systematic review and meta-analysis of variations in branching patterns of the adult aortic arch. J Vasc Surg. 2018;68:298-306.e10. [DOI] [PubMed] [Google Scholar]
- 17. Karabulut Ö İltimur K, Cudi Tuncer M. Coexisting of aortic arch variation of the left common carotid artery arising from brachiocephalic trunk and absence of the main branches of right subclavian artery: a review of the literature. Rom J Morphol Embryol. 2010;51:569-572. [PubMed] [Google Scholar]
- 18. Dumfarth J, Chou AS, Ziganshin BA, et al. Atypical aortic arch branching variants: a novel marker for thoracic aortic disease. J Thorac Cardiovasc Surg. 2015;149:1586-1592. [DOI] [PubMed] [Google Scholar]
- 19. Andrási TB, Grossmann M, Zenker D, Danner BC, Schöndube FA. Supra-aortic interventions for endovascular exclusion of the entire aortic arch. J Vasc Surg. 2017;66:281-297.e2. [DOI] [PubMed] [Google Scholar]
- 20. Yazdi SG, Huetter L, Docherty PD, et al. A novel fabrication method for compliant silicone phantoms of arterial geometry for use in particle image velocimetry of haemodynamics. Appl Sci. 2019;9:3811. [Google Scholar]
- 21. Brindise MC, Busse MM, Vlachos PP. Density and viscosity matched Newtonian and non-Newtonian blood-Analog Solutions with PDMS refractive index. Exp Fluids. 2018;59:173. [DOI] [PMC free article] [PubMed] [Google Scholar]
- 22. Stalder AF, Frydrychowicz A, Russe MF, et al. Assessment of flow instabilities in the healthy aorta using flow-sensitive MRI. J Magn Reson Imaging. 2011;33:839-846. [DOI] [PubMed] [Google Scholar]
- 23. Tsai W, Savaş. Flow pumping system for physiological waveforms. Med Biol Eng Comput. 2010;48:197-201. [DOI] [PMC free article] [PubMed] [Google Scholar]
- 24. Thielicke W, Sonntag R. Particle image velocimetry for MATLAB: accuracy and enhanced algorithms in PIVlab. J Open Res Software. 2021;9:12. [Google Scholar]
- 25. Garcia J, van der Palen RLF, Bollache E, et al. Distribution of blood flow velocity in the normal aorta: effect of age and gender. J Magn Reson Imaging. 2018;47:487-498. [DOI] [PMC free article] [PubMed] [Google Scholar]
- 26. Moore JE, Berry JL. Fluid and solid mechanical implications of vascular stenting. Ann Biomed Eng. 2002;30:498-508. [DOI] [PubMed] [Google Scholar]
- 27. McMillan DE. Blood flow and the localization of atherosclerotic plaques. Stroke. 1985;16:582-587. [DOI] [PubMed] [Google Scholar]
- 28. Favero G, Paganelli C, Buffoli B, Rodella LF, Rezzani R. Endothelium and its alterations in cardiovascular diseases: life style intervention. Biomed Res Int. 2014;2014:1-28. [DOI] [PMC free article] [PubMed] [Google Scholar]
- 29. Sengupta S, Zhu Y, Hamady M, Xu XY. Evaluating the haemodynamic performance of endografts for complex aortic arch repair. Bioengineering. 2022;9:573. [DOI] [PMC free article] [PubMed] [Google Scholar]