

Abstract
The prognostic nutritional index (PNI) has been associated with disease progression and overall survival among cancer patients. Nonetheless, the association between PNI and mortality risk in adult cancer patients within the United States remains unexplored. This study aims to elucidate the connection between PNI and prognostic outcomes in American adult cancer patients. This cohort study derived data from the National Health and Nutrition Examination database, involving 4366 American adults diagnosed with cancer between 1999 and 2018. The nutritional status was assessed using the PNI, with higher PNI scores indicating a more favorable nutritional status. The study employed Kaplan–Meier curves and Cox proportional hazard regression to investigate the impact of PNI on various outcomes, including all‐cause mortality (ACM), cardiovascular mortality (CAM), and malignancy tumor mortality (MTM) among adult cancer patients. Furthermore, restricted cubic spline models were used to examine the potential nonlinear relationship between the variables by creating hazard ratio (HR) curves at four specific points. The median follow‐up duration was 84 months, during which 1530 (35.04%) cases of ACM occurred, including 331 (13.67%) CAM and 449 (10.45%) MTM. COX regression analysis revealed a significant inverse association between PNI and patient prognosis, with HRs of 0.95 (95% CI: 0.93–0.96, p < .001) for ACM, 0.93 (95% CI: 0.90–0.96, p < .001) for CAM, and 0.94 (95% CI: 0.91–0.97, p < .001) for MTM. Both Kaplan–Meier analyses and restricted cubic spline curves showed significant differences in mortality rates related to PNI (p < .001, nonlinear p < .001). Our study provides compelling evidence of a clear association between PNI and reduced risk of ACM, CAM, and MTM in adult cancer patients in the United States. These findings underscore the significance of incorporating PNI as a possible prognostic indicator for individuals diagnosed with cancer.
Keywords: adult, all‐cause mortality, cancer survivors, cardiovascular mortality, malignant tumor mortality, prognostic nutritional index
Prognostic nutritional index (PNI) is associated with a reduced risk of all‐cause mortality, cardiovascular mortality, and death from malignant tumors in adult cancer patients in America. The findings highlight the importance of using PNI as a potential prognostic indicator for cancer patients.

1. INTRODUCTION
Cancer is a widespread and serious global health issue, representing one of the common causes of mortality and posing significant challenges to patients' quality of survival and prognosis. Predictions indicate that the United States could witness a staggering surge in newly diagnosed cancer cases by the year 2030, potentially reaching an alarming 22.1 million cases (Miller et al., 2019). Cancer often imposes tremendous financial stress and psychological burden on patients, their families, and society.
Nutrition serves as the foundation for maintaining normal physiological function and immunity in the body. However, both cancer itself and anticancer treatments can profoundly impact the state of nutrition. Consequently, cancer patients often experience heightened metabolic demands, increased energy expenditure, loss of appetite, and inadequate nutritional intake, all of which can impact their prognosis. Up to now, several nutritional and immunological indices have been identified to predict the prognosis of cancer patients, among which the prognostic nutrition index (PNI), originally proposed by Buzby et al. (1980), has been widely utilized due to its simplicity and convenience in assessment. PNI is a critical indicator used to comprehensively evaluate patients' nutritional and metabolic status, calculated based on the amalgamation of serum albumin and peripheral blood lymphocyte counts.
In recent years, many studies (Ellez et al., 2023; Mohri et al., 2016; Mori et al., 2015; Nogueiro et al., 2022; Tokunaga et al., 2015; Zheng et al., 2022) have demonstrated that a lower PNI is an independent predictor of long‐term poorer prognosis across various cancer types, including gastric, breast, non‐small‐cell lung, colorectal, and esophageal cancers. However, the sample sizes of these studies were small enough that the conclusions warrant further validation. Further, to our knowledge, no research has yet evaluated the relationship between PNI and prognosis in adult cancer population in America. Given the high incidence of cancer in the United States, it is critical to evaluate whether PNI can predict the prognosis of patients with cancer. To bridge this knowledge gap, we intend to prospectively investigate the association of PNI with the risk of all‐cause mortality (ACM), cardiovascular mortality (CAM), and malignancy tumor mortality (MTM) in a large, nationally representative sample of participants with cancer in the United States. This aims to provide additional health‐guidance strategies to improve the survival of US cancer patients and ultimately improve public health.
2. METHODS
2.1. Study participants
The data for this study were sourced from the National Health and Nutrition Examination Survey (NHANES), which spanned 10 consecutive cycles from 1999 to 2018. NHANES was administered by the National Center for Health Statistics, under the auspices of the US Centers for Disease Control and Prevention. This nationally representative cohort‐sectional survey utilized a grouped probability design and intricate stratified sampling methodology, targeting noninstitutionalized US civilians. The survey program encompassed demographic surveys, physical examinations, laboratory indicator tests, dietary profiles, and psychophysiological questionnaire assessments, which could be used to evaluate the relationship between nutritional status and disease avoidance.
The study strictly adhered to the guidelines of STROBE (von Elm et al., 2007). Among 57,926 participants in the 1999–2018 cycle of the NHANES survey, legal follow‐ups were conducted, from which we selected cancer survivors older than 18 years (N = 5166). Furthermore, participants with missing data were excluded from the analysis, including missing follow‐up (N = 304 people), missing albumin data (N = 433), and missing blood lymphocyte data (N = 63). As shown in Figure 1, a final total of 4366 samples were left in the analysis. The data were analyzed during the period from June 2023 through July 2023. NHANES obtained ethical approval from the Ethics Review Committee of the National Center for Health Statistics, with the following ethics approval numbers: Protocol #2018‐01, Continuation of Protocol #2011‐17, Protocol #2011‐17, Continuation of Protocol #2005‐06, Protocol #2005‐06, and Protocol #98‐12. Given that this study involved a secondary analysis of NHANES data, informed consent from patients was not required. Additional information can be obtained from the following website: NCHS Ethics Review Board Approval (cdc.gov). The study data are accessible on the website: https://www.cdc.gov/nchs/nhanes/index.htm.
FIGURE 1.
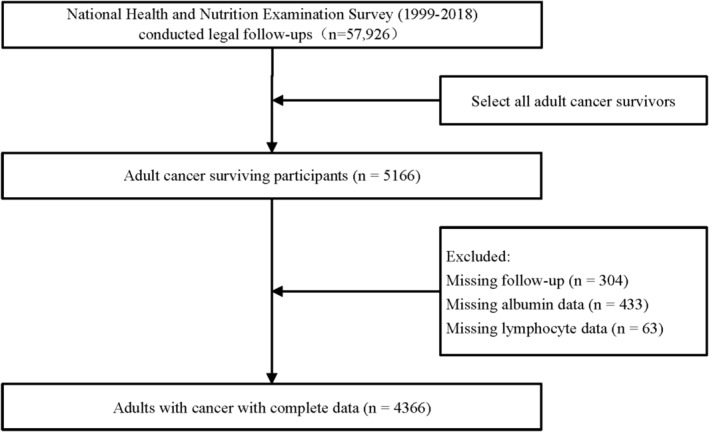
Flowchart depicting study participant inclusion and exclusion.
2.2. Assessment of prognostic nutritional index
The formula for calculating PNI: 5 × lymphocyte count (109/L) + serum albumin (g/L). Participants were allowed to sit still for at least 15 min prior to specimen collection. After blood specimens were collected, the specimens were mixed well to allow for complete clot formation and centrifuged at 2000×g for 10 min before use. The complete blood count parameters were determined according to the Beckman Coulter® counting and quantification method to obtain the corresponding lymphocyte count (NHANES, 2006). Serum albumin count was performed using a Roche Cobas 6000 analyzer (Roche Diagnostics Corporation, Indianapolis, IN 46250) with bromocresol purple reagent (Prevention).
2.3. Outcome assessment
Study outcomes included ACM, CAM, and MTM, each considered separately. ACM were considered as the probability of deaths from any cause, while CAM were identified as the probability of deaths originating from a variety of cardiovascular diseases (CVDs) including heart disease (e.g., myocardial infarction and sudden cardiac death) as well as cerebrovascular disease (stroke) (Wen et al., 2023). MTM were viewed as the probability of deaths due to a variety of malignant tumors, including head and neck cancers, skin‐related cancers, respiratory system cancers, digestive system cancers, breast cancers, blood‐related cancers, musculoskeletal cancers, genitourinary cancers, and other cancers. Mortality data for the follow‐up participants were derived from the NHANES Public Use Linked Mortality File. Within this dataset, the National Center for Health Statistics established a correlation with the National Death Index using a probabilistic algorithm for matching. In this case, data on cardiovascular deaths are taken from the International Statistical Classification of Diseases, 10th edition (ICD‐10) codes including I20–I51, I13, I11, and I00–I09 (Shen et al., 2023). Every patient's follow‐up is extended until the occurrence of their passing or until the study's conclusion (Bottomley & Raymond, 2007). Every patient's follow‐up is extended until the occurrence of their passing or until the study's conclusion (December 31, 2019).
2.4. Selection of study variables
The inclusion of covariates in this study is rooted in a comprehensive review of previous literature, clinical expertise, and the attainment of statistical significance (Liu et al., 2022; Qiao et al., 2023; Ying et al., 2022). During home interviews, demographic characteristics such as age, gender, race/ethnicity, marital status, and education levels were collected in the study. Physical measurements were taken by trained technicians and included height, weight, and the mean of three consecutive blood pressure readings obtained while the participants were sitting and at rest for 5 min.
Lifestyle factors, including smoking, alcohol consumption, and physical activity, were captured through self‐reported responses. Lifestyle factors, such as smoking, alcohol consumption, and physical activity, were obtained by self‐report. “Never” were identified as those who had smoked <100 cigarettes in their lifetime; those who had smoked ≥100 cigarettes in their lifetime and were now nonsmokers were considered “former”; those who had smoked ≥100 cigarettes in their lifetime and had smoked every day were categorized as “Now.” Participants were regarded as “never,” “former,” “mild,” and “moderate or heavy” drinkers according to the number of drinks he/she had drunk every day in 1 year: “Never” (had <12 drinks in lifetime), “former” (did not drink last year and ≥12 drinks/year or did not drink last year but drank ≥12 drinks in lifetime), “mild” (women drink less than 2 drinks per day and men drink less than 4 drinks per day), and “moderate or heavy” (women consume at least 2 drinks per day and men consume at least 4 drinks per day). Physical activity is categorized as “poor,” “intermediate,” and “ideal” according to metabolic equivalent task (MET) score. Biochemical data such as Lymphocytes, Creatinine (Cr), Neutrophils, triglyceride (TG), uric acid (UA), total cholesterol (TC), and albumin were obtained from the file of blood Hemal Biochemistry. Additionally, the energy intake was assessed using dietary data obtained from 24‐hour dietary recalls.
Participants with systolic blood pressure values (mmHg) ≥140 and/or diastolic blood pressure values (mmHg) ≥90 or individuals with a reported history of high blood pressure and a physician's diagnosis of having hypertension were defined as hypertensive. The diagnostic for diabetes includes these conditions, one of which should be met: doctor's notification of diabetes mellitus, fasting blood glucose ≥7.0 (mmol/L), glycosylated hemoglobin >6.5 (%), random blood glucose ≥11.1 (mmol/L), two‐hour OGTT blood glucose ≥11.1 (mmol/L), and use of antihyperglycemic drugs or insulin. CVD was viewed as having been diagnosed by a doctor as having a coronary heart disease/stroke/heart attack. In addition, chronic kidney disease (CKD) is defined as an estimated glomerular filtration rate <60 mL/min/1.73 m2.
2.5. Statistical analysis
Statistical analyses were carried out using the R software (The R Foundation version 4.2.3). A two‐sided p‐value lower than .05 was deemed to be statistically significant. To ensure the accuracy of results, the data were weighted in accordance with the NHANES analytical guidelines. This weighting aimed to accommodate the intricate sampling design inherent to this dataset (Johnson et al., 2014). Categorical variables were presented as weighted frequencies and corresponding percentages. To assess group differences, Rao‐Scott's χ 2 test was employed. Continuous variables were described as weighted means ± standard error. Group comparisons for continuous variables were conducted using one‐way analysis of variance.
Cox proportional hazard regression modeling was employed to examine the association of PNI with mortality among cancer survivors. The crude model did not involve any adjustment. Model 1 adjusted for a range of characteristics, including gender, age, marital status, race/ethnicity, body mass index, smoking status, and alcohol consumption. Model 2 adds neutrophil count, Cr, UA, TG, and TC to Model 1. In Model 3, Adjustments for diabetes, hypertension, CKD, and CVD were added to Model 2. Further, to explore the continuum relationship between PNI and three mortality outcomes, a weight‐multivariate adjusted Cox‐constrained cubic spline model was formulated. This was constructed at the 5th, 35th, 65th, and 95th percentile of the PNI. Additionally, the PNI was stratified into four quartiles: Q1 (<48.0), Q2 (48.0 to 51.0), Q3 (51.1 to 54.5), and Q4 (>54.5).
In addition, Kaplan–Meier curves with log‐rank tests were used to evaluate the survival probability of cancer patients across different quartile levels of PNI. Finally, subgroup analyses were performed on different age groups, genders, and cancer categories to verify the stability of the relationship between PNI and the prognosis of cancer patients.
2.6. Participants and public involvement
Participants were not involved in the design and dissemination plan of our study.
3. RESULTS
3.1. Baseline characteristics
Data were extracted from NHANES for 10 cycles spanning from 1999–2000 through 2017–2018. This cohort study included a total of 4366 participants, representing an estimated population of 18,733,193 individuals based on weighting. Baseline characteristics of these 4366 participants according to PNI quartiles are presented in Table 1. The PNI scores ranged from 51.57 to 51.79 in the sample, with a mean PNI score of 45.38 ± 0.08 (mean ± SD) for participants in quartile 1, and 57.95 ± 0.09 for participants in quartile 4. The average age of the participants was 52.31 years, with the majority being male (2300, 52.7%) and 3075 (70.4%) being non‐Hispanic white. In quartile 4, participants had higher neutrophil and lymphocyte counts, lower Cr levels, higher TG, TC, and albumin levels, and were more likely to have never smoked, engage in intermediate‐intensity physical activity, be light drinkers, have no CVD, and have no hypertension.
TABLE 1.
Baseline information for participants grouped according to PNI, weight.
| Characteristics | Overall | Q1 (<48.0) | Q2 (48.0 to 51.0) | Q3 (51.1 to 54.5) | Q4 (>54.5) | p‐value |
|---|---|---|---|---|---|---|
| N = 4366 | N = 1183 | N = 1102 | N = 1102 | N = 979 | ||
| PNI | 51.68 ± 0.11 | 45.38 ± 0.08 | 49.81 ± 0.03 | 52.97 ± 0.04 | 57.95 ± 0.09 | <.001 |
| Age, year | 62.31 ± 0.31 | 68.26 ± 0.57 | 63.87 ± 0.48 | 60.56 ± 0.52 | 57.17 ± 0.64 | <.001 |
| Gender | ||||||
| Male | 2300 (52.7) | 573 (55.1) | 564 (58.3) | 598 (57.9) | 565 (59.2) | .517 |
| Female | 2066 (47.3) | 610 (44.9) | 538 (41.7) | 504 (42.1) | 414 (40.8) | |
| Race | ||||||
| Non‐Hispanic White | 3075 (70.4) | 817 (84.9) | 811 (88.5) | 775 (86.5) | 672 (87.0) | .017 |
| Non‐Hispanic Black | 567 (13) | 199 (7.1) | 125 (4.3) | 134 (4.8) | 109 (4.2) | |
| Mexican American | 317 (7.3) | 69 (2.1) | 73 (2.0) | 81 (2.3) | 94 (3.1) | |
| Other race | 407 (9.3) | 98 (5.8) | 93 (5.3) | 112 (6.5) | 104 (5.7) | |
| Marital | ||||||
| With‐partner | 2650 (60.7) | 658 (61.3) | 699 (67.9) | 669 (65.3) | 624 (68.2) | <.001 |
| Without‐partner | 1435 (32.9) | 466 (35.2) | 338 (25.6) | 352 (28.5) | 279 (23.6) | |
| Never married | 281 (6.4) | 59 (3.5) | 65 (6.5) | 81 (6.2) | 76 (8.2) | |
| Education | ||||||
| High school or above | 3910 (89.6) | 1063 (94.3) | 980 (95.1) | 988 (95.0) | 879 (94.5) | .793 |
| Less than high school | 456 (10.4) | 120 (5.7) | 122 (4.9) | 114 (5.0) | 100 (5.5) | |
| Height, cm | 167.54 ± 0.22 | 167.07 ± 0.40 | 167.50 ± 0.38 | 167.67 ± 0.37 | 167.86 ± 0.44 | .530 |
| Weight, kg | 80.88 ± 0.37 | 81.44 ± 0.81 | 81.66 ± 0.85 | 80.89 ± 0.70 | 79.55 ± 0.79 | .228 |
| BMI, kg/m2 | 28.72 ± 0.12 | 29.10 ± 0.25 | 28.99 ± 0.28 | 28.69 ± 0.23 | 28.16 ± 0.24 | .030 |
| MET | ||||||
| Poor | 1571 (36) | 431 (34.9) | 400 (32.3) | 389 (33.5) | 351 (35.9) | .533 |
| Intermediate | 2454 (56.2) | 669 (58.9) | 622 (58.9) | 622 (58.1) | 541 (56.4) | |
| Ideal | 341 (7.8) | 83 (6.2) | 80 (8.9) | 91 (8.4) | 87 (7.7) | |
| Drinking | ||||||
| Never | 940 (21.5) | 317 (24.9) | 233 (17.3) | 211 (15.5) | 179 (14.6) | <.001 |
| Former | 977 (22.4) | 286 (21.8) | 251 (19.0) | 241 (17.5) | 199 (16.2) | |
| Mild | 1648 (37.7) | 439 (39.9) | 420 (41.4) | 422 (41.6) | 367 (38.6) | |
| Moderate or heavy | 801 (18.3) | 141 (13.4) | 198 (22.3) | 228 (25.3) | 234 (30.6) | |
| Smoking | ||||||
| Never | 1942 (44.5) | 521 (47.3) | 502 (46.6) | 524 (49.4) | 395 (38.4) | <.001 |
| Former | 1741 (39.9) | 523 (41.9) | 482 (41.7) | 400 (33.9) | 336 (34.4) | |
| Now | 679 (15.6) | 137 (10.8) | 118 (11.7) | 178 (16.6) | 246 (27.1) | |
| Energy intake | ||||||
| Low | 2183 (50) | 596 (46.2) | 528 (43.7) | 567 (48.1) | 492 (47.0) | .403 |
| High | 2183 (50) | 587 (53.8) | 574 (56.3) | 535 (51.9) | 487 (53.0) | |
| Biochemical indicators | ||||||
| Neutrophil, 109/L | 1.94 ± 0.01 | 1.35 ± 0.02 | 1.66 ± 0.02 | 2.02 ± 0.02 | 2.67 ± 0.02 | <.001 |
| Lymphocyte, 109/L | 4.33 ± 0.03 | 4.31 ± 0.07 | 4.14 ± 0.06 | 4.25 ± 0.06 | 4.62 ± 0.06 | <.001 |
| Cr, μmol/L | 83.17 ± 0.60 | 93.30 ± 1.82 | 81.18 ± 0.98 | 80.59 ± 0.77 | 78.69 ± 1.02 | <.001 |
| UA, μmol/L | 325.36 ± 1.59 | 335.62 ± 3.37 | 318.63 ± 3.04 | 328.13 ± 3.24 | 320.06 ± 3.27 | .001 |
| TG, mmol/L | 1.54 ± 0.02 | 1.42 ± 0.04 | 1.49 ± 0.03 | 1.57 ± 0.04 | 1.68 ± 0.04 | <.001 |
| TC, mmol/L | 5.11 ± 0.03 | 4.85 ± 0.04 | 5.14 ± 0.06 | 5.14 ± 0.04 | 5.30 ± 0.04 | <.001 |
| Albumin, g/L | 42.00 ± 0.06 | 38.60 ± 0.11 | 41.52 ± 0.08 | 42.88 ± 0.09 | 44.63 ± 0.11 | <.001 |
| Chronic diseases | ||||||
| Cardiovascular disease | ||||||
| Yes | 1085 (24.9) | 374 (27.9) | 277 (19.6) | 244 (16.8) | 190 (15.6) | <.001 |
| No | 3281 (75.1) | 809 (72.1) | 825 (80.4) | 858 (83.2) | 789 (84.4) | |
| Diabetes | ||||||
| Yes | 1128 (25.8) | 332 (25.9) | 291 (21.6) | 258 (18.2) | 247 (19.8) | .008 |
| No | 3238 (74.2) | 851 (74.1) | 811 (78.4) | 844 (81.8) | 732 (80.2) | |
| Chronic kidney disease | ||||||
| Yes | 1496 (34.3) | 539 (40.5) | 358 (25.7) | 354 (24.6) | 245 (19.0) | <.001 |
| No | 2870 (65.7) | 644 (59.5) | 744 (74.3) | 748 (75.4) | 734 (81.0) | |
| Hypertension | ||||||
| Yes | 2791 (63.9) | 815 (65.5) | 700 (58.4) | 689 (55.5) | 587 (52.8) | <.001 |
| No | 1574 (36.1) | 367 (34.5) | 402 (41.6) | 413 (44.5) | 392 (47.2) | |
| Cancer category | ||||||
| Head and neck cancers | 187 (4.3) | 46 (4.3) | 51 (4.8) | 45 (4.1) | 45 (3.9) | <.001 |
| Skin‐related cancers | 1289 (29.5) | 280 (28.6) | 337 (37.4) | 358 (41.7) | 314 (40.0) | |
| Respiratory system cancers | 102 (2.3) | 45 (3.3) | 19 (1.5) | 17 (1.0) | 21 (1.8) | |
| Digestive system Cancers | 361 (8.3) | 127 (8.6) | 87 (5.5) | 87 (5.6) | 60 (4.5) | |
| Breast cancers | 635 (14.5) | 192 (18.4) | 169 (16.3) | 154 (14.6) | 120 (10.3) | |
| Blood‐related cancers | 77 (1.8) | 20 (2.5) | 18 (1.9) | 19 (2.0) | 20 (2.0) | |
| Musculoskeletal cancers | 34 (0.8) | 13 (1.0) | 4 (0.4) | 11 (1.0) | 6 (0.7) | |
| Genitourinary cancers | 1449 (33.2) | 393 (27.9) | 368 (27.7) | 360 (25.5) | 328 (29.3) | |
| Other cancers | 232 (5.3) | 67 (5.4) | 49 (4.6) | 51 (4.4) | 65 (7.5) | |
Note: Continuous variables were expressed as weighted mean ± standard deviation; one‐way ANOVA was used to compare differences among the different groups. Categorical variables were expressed as weighted frequencies and percentages and compared using Rao‐Scott's χ 2 test.
Bold values indicate statistical significance (p < 0.05).
Abbreviations: Cr, creatinine; UA, serum uric acid; PNI, prognostic nutritional index; TC, total cholesterol; TG, triglyceride.
3.2. Association between PNI and ACM, CAM, MTM in American adult cancer patients
With a median follow‐up period of 84 months, a total of 1530 out of 2836 patients (35.04%), 331 out of 2836 (10.45%), and 449 out of 2836 (13.67%) died from ACM, CAM, and MTM, respectively. In this study, we established four multifactorial Cox regression models to examine the relationship between the PNI and ACM, CAM, and MTM among American cancer survivors. Multivariate Cox regression analyses showed a 5.3%, 7.1%, and 5.8% probability reduction in the risk of ACM, CAM, and MTM, respectively, for each 1‐point increase in PNI. After adjusting for various factors, including age, gender, race/ethnicity, marital status, smoking status, BMI, and alcohol consumption, the hazard ratios (HR) were 0.95 (95% CI: 0.93–0.96, p < .001) for all‐cause mortality, 0.93 (95% CI: 0.90–0.96, p < .001) for cardiovascular mortality, and 0.94 (95% CI: 0.91–0.97, p < .001) for malignant tumor mortality in Table 2.
TABLE 2.
Relationship between PNI and all‐cause mortality cardiovascular mortality, and malignant tumor mortality among adult cancer patients in the United States.
| Characteristics | Crude model | Model 1 | Model 2 | Model 3 | ||||
|---|---|---|---|---|---|---|---|---|
| HR (95% CI) | p‐value | HR (95% CI) | p‐value | HR (95% CI) | p‐value | HR (95% CI) | p‐value | |
| All‐cause mortality | ||||||||
| PNI | 0.91 (0.89,0.92) | <.001 | 0.95 (0.93,0.96) | <.001 | 0.95 (0.94,0.96) | <.001 | 0.95 (0.94,0.96) | <.001 |
| PNI quartiles | ||||||||
| Q1 (<48.0) | Reference | Reference | Reference | Reference | ||||
| Q2 (48.0 to 51.0) | 0.465 (0.39,0.55) | <.001 | 0.617 (0.54,0.71) | <.001 | 0.63 (0.55,0.73) | <.001 | 0.65 (0.56,0.76) | <.001 |
| Q3 (51.1 to 54.5) | 0.41 (0.34,0.48) | <.001 | 0.64 (0.55,0.75) | <.001 | 0.65 (0.55,0.76) | <.001 | 0.65 (0.55,0.77) | <.001 |
| Q4 (>54.5) | 0.29 (0.24,0.35) | <.001 | 0.52 (0.45,0.62) | <.001 | 0.521 (0.44,0.62) | <.001 | 0.52 (0.44,0.62) | <.001 |
| p for trend | <.001 | <.001 | <.001 | <.001 | ||||
| Cardiovascular mortality | ||||||||
| PNI | 0.873 (0.84,0.90) | <.001 | 0.929 (0.90,0.96) | <.001 | 0.93 (0.91,0.96) | <.001 | 0.93 (0.91,0.96) | <.001 |
| PNI quartiles | ||||||||
| Q1 (<48.0) | Reference | Reference | Reference | Reference | ||||
| Q2 (48.0 to 51.0) | 0.45 (0.34,0.60) | <.001 | 0.65 (0.51,0.81) | <.001 | 0.63 (0.50,0.80) | <.001 | 0.70 (0.53,0.92) | .01 |
| Q3 (51.1 to 54.5) | 0.29 (0.20,0.42) | <.001 | 0.58 (0.40,0.84) | .004 | 0.57 (0.39,0.84) | .005 | 0.61 (0.41,0.89) | .012 |
| Q4 (>54.5) | 0.21 (0.13,0.31) | <.001 | 0.45 (0.32,0.64) | <.001 | 0.43 (0.31,0.60) | <.001 | 0.44 (0.31,0.61) | <.001 |
| p for trend | <.001 | <.001 | <.001 | <.001 | ||||
| Malignant tumor mortality | ||||||||
| PNI | 0.908 (0.881,0.936) | <.001 | 0.942 (0.913,0.971) | <.001 | 0.940 (0.911,0.971) | <.001 | 0.943 (0.913,0.973) | <.001 |
| PNI quartiles | ||||||||
| Q1 (<48.0) | Reference | Reference | Reference | Reference | ||||
| Q2 (48.0 to 51.0) | 0.31 (0.23,0.43) | <.001 | 0.40 (0.29,0.54) | <.001 | 0.39 (0.29,0.54) | <.001 | 0.41 (0.30,0.56) | <.001 |
| Q3 (51.1 to 54.5) | 0.42 (0.32,0.55) | <.001 | 0.62 (0.47,0.81) | <.001 | 0.61 (0.47,0.80) | <.001 | 0.62 (0.47,0.82) | <.001 |
| Q4 (>54.5) | 0.26 (0.19,0.36) | <.001 | 0.42 (0.31,0.56) | <.001 | 0.40 (0.29,0.54) | <.001 | 0.41 (0.30,0.56) | <.001 |
| p for trend | <.001 | <.001 | <.001 | <.001 | ||||
Note: Calculated using multivariate COX regression analysis was performed, weight. Crude Model: no adjustment. Model 1: adjusted for age, sex, marital status, race/ethnicity, BMI, smoking status, and alcohol use. Model 2: adjusted for age, sex, marital status, race/ethnicity, BMI, smoking status, alcohol use, neutrophil count, creatinine, uric acid, triglycerides, and total cholesterol. Model 3: adjusted for age, sex, marital status, race/ethnicity, BMI, smoking status, alcohol use, neutrophil count, creatinine, uric acid, triglycerides, total cholesterol, hypertension, diabetes, cardiovascular disease, and chronic kidney disease.
Meanwhile, after further additional adjustments for laboratory biochemical parameters, the correlation between PNI and the risk of all‐cause mortality, cardiovascular mortality, and death from malignancy remained a strong (HR: 0.95, [95% CI: 0.94–0.96], p < .001; HR = 0.93, [95% CI: 0.91–0.96], p < .001; HR = 0.94, [95% CI: 0.91–0.97], p < .001). Each unit increase in PNI was associated with a reduction probability of 5.1%, 6.7%, and 6.0% in the risk of death in cancer patients. Furthermore, even after adjusting for potential confounding variables (Model 3), PNI significantly reduced the risk of ACM, CAM, and MTM in cancer patients (HR: 0.95, [95% CI: 0.93–0.94], p < .001; HR: 0.93, [95% CI: 0.91–0.96], p < .001; HR: 0.94, [95% CI: 0.91–0.97], p < .001), as shown in Table 2.
In addition, Figure 2 shows Kaplan–Meier survival curves for ACM, CAM, and MTM of survival in American adult cancer patients stratified by PNI group (Figure 2a–c). The curves depicted those individuals with higher PNIs had lower mortality rates compared to those with lower PNIs, with a significant difference (log‐rank p < .001).
FIGURE 2.
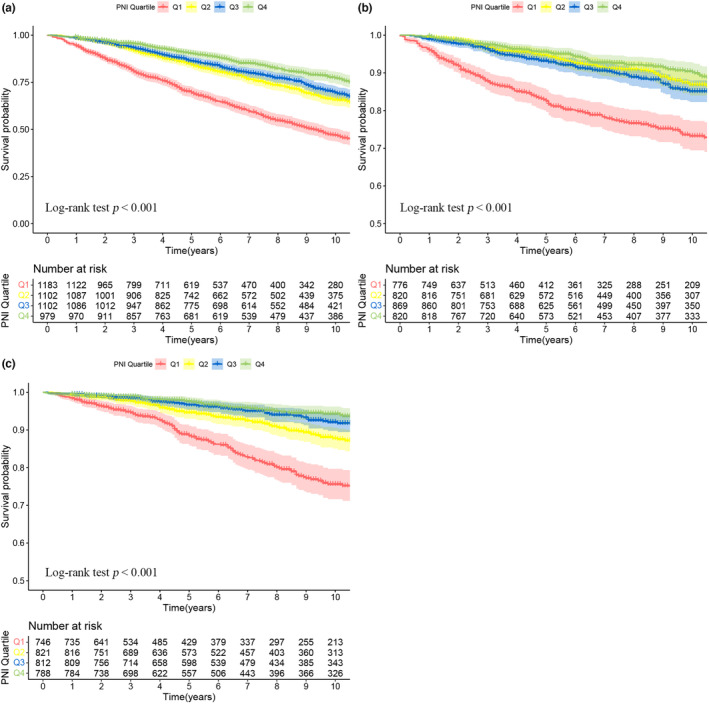
Kaplan–Meier survival rates illustrating mortality among US adult cancer patients categorized by different PNI quartile groups: (a) all‐cause mortality; (b) cardiovascular mortality; (c) malignant tumor mortality. PNI stratification: Q1 (<48.0), Q2 (48.0 to 51.0), Q3 (51.1 to 54.5), and Q4 (>54.5). Statistical adjustments were made for age, gender, marital status, ethnicity, BMI, smoking status, alcohol use, neutrophil count, creatinine, uric acid, triglycerides, total cholesterol, diabetes, hypertension, chronic kidney disease, and cardiovascular disease.
3.3. Nonlinear correlation analysis of PNI and ACM, CAM, MTM in American adult cancer patients
In the restricted cubic spline plot (Figure 3), the horizontal axis represents the percentage of PNI, while the vertical axis indicates the HR of ACM, CAM, and MTM incidence. The results revealed a nonlinear correlation between PNI and the risk of ACM, CAM, and MTM (nonlinear p < .001). Furthermore, there was an “L”‐shaped curve correlation between PNI and the occurrence of all‐cause deaths, cardiovascular deaths, and deaths from malignant tumors.
FIGURE 3.
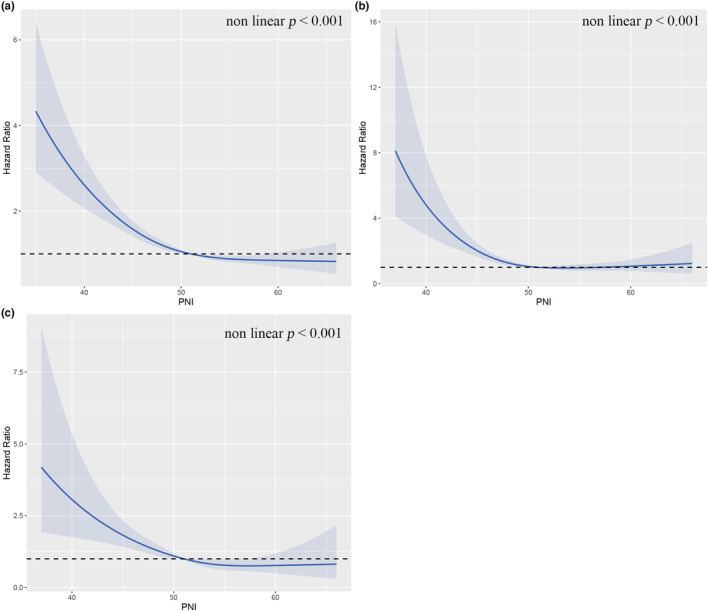
Nonlinear relationship between PNI and mortality in adult cancer patients. (a) all‐cause mortality; (b) cardiovascular mortality; (c) malignant tumor mortality. Statistical adjustments were made for age, gender, race/ethnicity, marital status, smoking status, BMI, alcohol consumption, neutrophil count, triglycerides, serum creatinine, total cholesterol, serum uric acid, diabetes, hypertension, chronic kidney disease, and cardiovascular disease.
3.4. Subgroup analysis of PNI and ACM, CAM, MTM in American adult cancer patients
We further analyzed subgroups by gender, age, and Cancer Category. The results suggest that regardless of age (≤ 60 or >60) or gender (male or female), an increase in PNI was associated with a significant reduction in the risk of ACM among US adult cancer patients. At the same time, PNI showed a protective effect against ACM in different categories of malignancies, except for blood‐related cancers. Furthermore, we observed a protective effect of PNI on the risk of CAM and MTM in participants aged over 60 years, as well as in both male and female participants. However, this association was not observed in patients aged ≤60 years (Table 3).
TABLE 3.
Associations between PNI and all‐cause mortality cardiovascular mortality, and malignant tumor mortality in different subgroups of American Adult Cancer Patients.
| Characteristics | All‐cause mortality | Malignant tumor mortality | Cardiovascular mortality | |||
|---|---|---|---|---|---|---|
| HR (95% CI) p | p for interaction | HR (95% CI) p | p for interaction | HR (95% CI) p | p for interaction | |
| Age | ||||||
| <60 | 0.94 (0.90,0.99) p = .012 | .885 | 0.94 (0.87,1.02) p = .125 | .806 | 0.90 (0.74, 1.06) p = .196 | .703 |
| ≥60 | 0.94 (0.92,0.95) p < .001 | 0.93 (0.90,0.97) p < .001 | 0.91 (0.89,0.94) p < .001 | |||
| Gender | ||||||
| Male | 0.93 (0.91,0.95) p < .001 | .571 | 0.92 (0.87,0.97) p < .001 | .186 | 0.87 (0.84,0.91) p < .001 | .14 |
| Female | 0.94 (0.92,0.96) p < .001 | 0.95 (0.91,0.99) p = .007 | 0.93 (0.88, 0.98) p = .005 | |||
| Race | ||||||
| Non‐Hispanic White | 0.93 (0.92,0.94) p < .001 | .077 | 0.93 (0.90,0.96) p < .001 | .637 | 0.90 (0.87,0.93) p < .001 | .958 |
| Non‐Hispanic Black | 0.96 (0.93,1.00) p = .040 | 0.95 (0.89, 1.02) p = .151 | 0.91 (0.82, 1.02) p = .098 | |||
| Mexican American | 0.94 (0.87, 1.02) p = .125 | 0.92 (0.81, 1.04) p = .183 | 0.86 (0.63, 1.18) p = .360 | |||
| Other race | 0.88 (0.82,0.94) p < .001 | 0.86 (0.75, 0.98) p = .019 | 0.85 (0.62,1.17) p = .325 | |||
| Cancer category | ||||||
| Head and neck cancers | 0.89 (0.82, 0.97) p = .009 | .016 | 0.90(0.79, 1.03) p = .133 | .228 | 1.09 (1.01,1.18) p = .037 | .12 |
| Skin‐related cancers | 0.93 (0.90,0.96) p < .001 | 0.96 (0.88, 1.05) p = .386 | 0.87 (0.82,0.93) p < .001 | |||
| Respiratory system cancers | 0.91 (0.87, 0.95) p < .001 | 0.83 (0.74,0.93) p = .002 | 0.93 (0.85, 1.02) p = .119 | |||
| Digestive system cancers | 0.94 (0.91,0.98) p = .004 | 0.93 (0.87, 1.01) p = .075 | 0.90 (0.83,0.97) p = .009 | |||
| Breast cancers | 0.95 (0.91,0.99) p = .016 | 0.94 (0.87, 1.02) p = .131 | 0.91 (0.81, 1.02) p = .116 | |||
| Blood‐related cancers | 0.94 (0.84, 1.04) p = .229 | 0.95 (0.80, 1.12) p = .527 | 3.45 (3.11,3.82) p < .001 | |||
| Musculoskeletal cancers | 0.61 (0.43, 0.88) p = .008 | 0.70 (0.51,0.95) p = .022 | 7.46 (0.41,1.37) p = .344 | |||
| Genitourinary cancers | 0.94 (0.92,0.96) p < .001 | 0.94 (0.90,0.99) p = .021 | 0.90 (0.86,0.95) p < .001 | |||
| Other cancers | 0.87 (0.82,0.92) p < .001 | 0.89 (0.81, 0.98) p = .012 | 0.84 (0.76, 0.93) p < .001 | |||
Note: Calculated using multivariate COX regression analysis was performed, weight. Adjusted for age, sex, marital status, race/ethnicity, BMI, smoking status, alcohol use, neutrophil count, creatinine, uric acid, triglycerides, total cholesterol, hypertension, diabetes, cardiovascular disease, and chronic kidney disease.
Bold values indicate statistical significance (p < 0.05).
Furthermore, we did find that PNI significantly attenuated cardiovascular deaths in US adult cancer patients with increasing PNI in the strata of respiratory system cancers, musculoskeletal cancers, genitourinary cancers, and other cancers. Similarly, PNI significantly reduced the incidence of malignancy deaths in US adult cancer patients with increasing PNI in the subgroups of skin‐related cancers, digestive system cancers, genitourinary cancers, and other cancers. However, there was a positive correlation between PNI and malignancy deaths in the subgroups of head and neck cancers and blood‐related cancers.
4. DISCUSSION
Through the retrospective analysis of a large cohort of adult cancer survivors in America, the study reveals that the PNI is a potentially independent risk factor for prognosis. The study simultaneously explored the relationship between PNI and ACM, CAM, and MTM in cancer survivors separately. The findings show an L‐shaped relationship between PNI and adverse outcomes in cancer survivors, indicating that patients with lower PNI scores have a higher probability of death, regardless of ACM, CAM, or MTM. The results of the subgroup analyses showed a negative association between PNI and the risk of ACM among adult cancer patients in the United States, except for blood‐related cancers. However, it should be noted that the association between PNI and the risk of CAM and MTM showed inconsistent results across subgroups. Furthermore, it is interesting that the PNI demonstrated good predictability for ACM, CAM, and MTM in non‐Hispanic white (p < .05).
The study sample size is larger compared to previous studies, and it is the first study conducted in a nationally representative adult cancer population. Currently, the study of the relationship between nutritional and inflammatory indicators and tumor prognosis has become an important topic. Some studies (Mirili et al., 2019; Nazha et al., 2015) have suggested that nutrition and inflammation play a vital role in tumor development, angiogenesis, and apoptosis. This finding is in accordance with previous studies (Ellez et al., 2023; Kocak et al., 2023; Maejima et al., 2022; Xu et al., 2023) and supports the usefulness of PNI as a predictor of prognosis in cancer patients. However, the differing results in subgroup analyses may be attributed to variations in the stratified population, race, and genetic inheritance, among other factors.
The PNI, which is calculated from serum albumin levels and total lymphocyte counts, serves as a predictor of nutritional status. It has been widely used not only to predict poor prognosis in a variety of patients but also has been considered a significant predictor of cancer (Lu et al., 2021; Obermair et al., 2017; Yoshihisa et al., 2018). The PNI is an objective measure as it is derived from routine laboratory indicators that can be easily obtained in a clinical setting. Clinical caregivers can use the PNI to assess a patient's condition quickly, enabling timely interventions to reduce the risk of death. Moreover, it allows for large‐sample monitoring and follow‐up. Therefore, improving PNI scores by controlling inflammation and enhancing immune status may prove to be an effective clinical intervention tool.
The mechanisms underlying the association between lower PNI scores and worse survival in cancer patients are not yet well understood, because albumin and lymphocytes are two important factors in the PNI equation, which may explain the relationship between PNI and mortality in cancer survivors. According to the former study (Lu et al., 2021), it demonstrated the relationship between PNI and a patient's prognosis that low serum albumin often suggests malnutrition in the patient. Not only does serum albumin reflect the body's nutritional status, which regulates the body's inflammatory response and has a strong negative correlation with C‐reactive protein (CRP), but influences the function of many oxidative stress enzymes in the body (Deng et al., 2021; Eckart et al., 2020; Li et al., 2023). Furthermore, the lymphocyte reflects not only the body's immune regulation but also the progression of inflammation and its role as a fundamental component of cytotoxic immune function, mediating cytotoxicity through cytokines, thereby inhibiting tumor cell proliferation and invasion (Ray‐Coquard et al., 2009; Walzik et al., 2021). Currently, it has been demonstrated that controlling inflammation and improving immunity can improve the prognosis of patients (Shimizu et al., 2022; Zhang, Feng, et al., 2023). Similarly, a significant reduction in cardiovascular risk in mice has been found to influence the expression of inflammatory cell‐associated factors and chemokines (Wang et al., 2022). Therefore, specific mechanisms can be considered in terms of immune function and inflammatory response when exploring the relationship between lower PNI and worse prognosis in cancer patients.
Interestingly, however, we also found that PNI was associated with cancer‐related mortality and did not apply to blood‐related cancers. Blood‐related cancers, such as leukemia and myeloma, possess distinct different pathophysiological characteristics than other types of solid tumors. These cancers occur predominantly in the bone marrow or lymphoid tissue and do not form masses like solid tumors. As a result, we believe that the effect of PNI on blood‐related cancers may be minimal or insignificant. Second, there may still be other important factors that influence mortality from blood‐related cancers. For instance, patients with this cancer are treated differently and have a different prognosis than those with solid tumors. It is essential to carefully consider the specific type of cancer when interpreting the association between PNI and cancer‐related mortality. PNI may not be the primary influencing factor for blood‐related cancers, while other factors might exert a more significant influence. Nevertheless, there is no doubt that the relationship between PNI and blood‐related tumors needs to be further investigated.
Several limitations were observed in the study. For example, since the data only encompassed US adult cancer patients, the findings may not be extrapolated to participants in other countries with differing genetic backgrounds, diets, and lifestyles. In addition, despite our attempts to adjust for numerous confounding factors, the potential omission of other significant covariates remains plausible.
5. CONCLUSION
The PNI score emerges as an independent risk factor for ACM, CAM, and MTM from malignant tumors in cancer survivors, with higher PNI scores associated with lower mortality. Therefore, assessing cancer patients' immune and nutritional statuses via PNI proves helpful in lowering poor prognosis risks and is crucial for comprehensive cancer patient management.
AUTHOR CONTRIBUTIONS
Li Zhao: Data curation (equal); formal analysis (equal); methodology (equal); resources (equal); software (equal); writing – original draft (equal). Xia Shen: Data curation (equal); formal analysis (equal); investigation (equal); methodology (equal); software (equal); writing – original draft (equal). Long Yang: Investigation (equal); validation (equal); writing – review and editing (equal). Pengfei Wang: Formal analysis (equal); investigation (equal); writing – review and editing (equal). Jianfeng Zhang: Data curation (equal); investigation (equal); writing – review and editing (equal). Ning Liu: Supervision (equal). Yan Xie: Supervision (equal).
FUNDING INFORMATION
External funding was not received for this study.
CONFLICT OF INTEREST STATEMENT
The authors state that there are no conflicts of interest.
ETHICS STATEMENT
NHANES obtained ethical approval from the Ethics Review Committee of the National Center for Health Statistics, under the following protocol numbers: #2018‐01, Continuation of Protocol #2011‐17, Protocol #2011‐17, Continuation of Protocol #2005‐06, Protocol #2005‐06, and Protocol #98‐12. You can access the pertinent details at: https://www.cdc.gov/nchs/nhanes/irba98.htm. As this study constituted a secondary analysis of NHANES data, obtaining patient informed consent was not required.
PATIENT CONSENT STATEMENT
This study involves an analysis of publicly available NHANES data. Informed consent was originally obtained from NHANES participants by the National Center for Health Statistics Research Ethics Review Board.
ACKNOWLEDGMENTS
We would like to sincerely thank the personnel and participants of the National Health and Nutrition Examination Survey for their invaluable contributions, which have enabled this analysis. Additionally, we wish to extend our deep appreciation to Zhang Jing from Shanghai Tongren Hospital for his outstanding dedication to curating the NHANES database. His remarkable contributions to the development of the “nhanesR” webpage and package have greatly streamlined our exploration of the NHANES database.
Zhao, L. , Shen, X. , Yang, L. , Wang, P. , Zhang, J. , Liu, N. , & Xie, Y. (2024). Association of prognostic nutritional index with mortalities in American adult cancer survivors: A cohort study based on NHANES, 1999–2018. Food Science & Nutrition, 12, 1834–1846. 10.1002/fsn3.3877
Li Zhao and Xia Shen are joint first authors.
Contributor Information
Ning Liu, Email: fjjln0818@163.com.
Yan Xie, Email: 2512714708@qq.com.
DATA AVAILABILITY STATEMENT
All the data are publicly accessible and can be obtained from the website: https://wwwn.cdc.gov/nchs/nhanes/search/default.aspx.
REFERENCES
- Bottomley, J. M. , & Raymond, F. D. (2007). Pharmaco‐economic issues for diabetes therapy. Best Practice & Research. Clinical Endocrinology & Metabolism, 21(4), 657–685. 10.1016/j.beem.2007.08.002 [DOI] [PubMed] [Google Scholar]
- Buzby, G. P. , Mullen, J. L. , Matthews, D. C. , Hobbs, C. L. , & Rosato, E. F. (1980). Prognostic nutritional index in gastrointestinal surgery. American Journal of Surgery, 139(1), 160–167. 10.1016/0002-9610(80)90246-9 [DOI] [PubMed] [Google Scholar]
- Deng, S. , Liu, S. , Jin, P. , Feng, S. , Tian, M. , Wei, P. , Zhu, H. , Tan, J. , Zhao, F. , & Gong, Y. (2021). Albumin reduces oxidative stress and neuronal apoptosis via the ERK/Nrf2/HO‐1 pathway after intracerebral hemorrhage in rats. Oxidative Medicine and Cellular Longevity, 2021, 8891373. 10.1155/2021/8891373 [DOI] [PMC free article] [PubMed] [Google Scholar]
- Eckart, A. , Struja, T. , Kutz, A. , Baumgartner, A. , Baumgartner, T. , Zurfluh, S. , Neeser, O. , Huber, A. , Stanga, Z. , Mueller, B. , & Schuetz, P. (2020). Relationship of nutritional status, inflammation, and serum albumin levels during acute illness: A prospective study. The American Journal of Medicine, 133(6), 713–722.e717. 10.1016/j.amjmed.2019.10.031 [DOI] [PubMed] [Google Scholar]
- Ellez, H. I. , Keskinkilic, M. , Semiz, H. S. , Arayici, M. E. , Kısa, E. , & Oztop, I. (2023). The prognostic nutritional index (PNI): A new biomarker for determining prognosis in metastatic castration‐sensitive prostate carcinoma. Journal of Clinical Medicine, 12(17), 5434. 10.3390/jcm12175434 [DOI] [PMC free article] [PubMed] [Google Scholar]
- Johnson, C. L. , Dohrmann, S. M. , Burt, V. L. , & Mohadjer, L. K. (2014). National health and nutrition examination survey: Sample design, 2011‐2014. Vital and Health Statistics. Series 2, Data Evaluation and Methods Research, 2(162), 1–33. [PubMed] [Google Scholar]
- Kocak, M. Z. , Coban, S. , Araz, M. , Eryilmaz, M. K. , & Artac, M. (2023). Prognostic biomarkers in metastatic colorectal cancer: Delta prognostic nutritional index, delta neutrophil to lymphocyte ratio, and delta platelet to lymphocyte ratio. Support Care Cancer, 31(6), 357. 10.1007/s00520-023-07829-w [DOI] [PubMed] [Google Scholar]
- Li, F. , Xing, Y. , Zhang, J. , Mu, J. , Ge, J. , Zhao, M. , Liu, L. , Gong, D. , & Geng, T. (2023). Goose hepatic IGFBP2 is regulated by nutritional status and participates in energy metabolism mainly through the cytokine‐cytokine receptor pathway. Animals: An Open Access Journal from MDPI, 13(14), 2336. 10.3390/ani13142336 [DOI] [PMC free article] [PubMed] [Google Scholar]
- Liu, Z. Y. , Wang, C. , Zhang, Y. J. , & Zhu, H. L. (2022). Combined lifestyle, mental health, and mortality in US cancer survivors: A national cohort study. Journal of Translational Medicine, 20(1), 376. 10.1186/s12967-022-03584-4 [DOI] [PMC free article] [PubMed] [Google Scholar]
- Lu, Y. , Ren, C. , & Jiang, J. (2021). The relationship between prognostic nutritional index and all‐cause mortality in critically ill patients: A retrospective study. International Journal of General Medicine, 14, 3619–3626. 10.2147/ijgm.S318896 [DOI] [PMC free article] [PubMed] [Google Scholar]
- Maejima, K. , Taniai, N. , & Yoshida, H. (2022). The prognostic nutritional index as a predictor of gastric cancer progression and recurrence. Journal of Nippon Medical School, 89(5), 487–493. 10.1272/jnms.JNMS.2022_89-507 [DOI] [PubMed] [Google Scholar]
- Miller, K. D. , Nogueira, L. , Mariotto, A. B. , Rowland, J. H. , Yabroff, K. R. , Alfano, C. M. , Jemal, A. , Kramer, J. L. , & Siegel, R. L. (2019). Cancer treatment and survivorship statistics, 2019. CA: A Cancer Journal for Clinicians, 69(5), 363–385. 10.3322/caac.21565 [DOI] [PubMed] [Google Scholar]
- Mirili, C. , Yılmaz, A. , Demirkan, S. , Bilici, M. , & Basol Tekin, S. (2019). Clinical significance of prognostic nutritional index (PNI) in malignant melanoma. International Journal of Clinical Oncology, 24(10), 1301–1310. 10.1007/s10147-019-01461-7 [DOI] [PubMed] [Google Scholar]
- Mohri, T. , Mohri, Y. , Shigemori, T. , Takeuchi, K. , Itoh, Y. , & Kato, T. (2016). Impact of prognostic nutritional index on long‐term outcomes in patients with breast cancer. World Journal of Surgical Oncology, 14(1), 170. 10.1186/s12957-016-0920-7 [DOI] [PMC free article] [PubMed] [Google Scholar]
- Mori, S. , Usami, N. , Fukumoto, K. , Mizuno, T. , Kuroda, H. , Sakakura, N. , Yokoi, K. , & Sakao, Y. (2015). The significance of the prognostic nutritional index in patients with completely resected non‐small cell lung cancer. PLoS One, 10(9), e0136897. 10.1371/journal.pone.0136897 [DOI] [PMC free article] [PubMed] [Google Scholar]
- Nazha, B. , Moussaly, E. , Zaarour, M. , Weerasinghe, C. , & Azab, B. (2015). Hypoalbuminemia in colorectal cancer prognosis: Nutritional marker or inflammatory surrogate? World Journal of Gastrointestinal Surgery, 7(12), 370–377. 10.4240/wjgs.v7.i12.370 [DOI] [PMC free article] [PubMed] [Google Scholar]
- NHANES . (2006). National Health and Nutrition Examination Survey: 1999–2000 Data Documentation, Codebook, and Frequencies. Retrieved August 2, 2023, from https://wwwn.cdc.gov/Nchs/Nhanes/1999‐2000/LAB25.htm
- Nogueiro, J. , Santos‐Sousa, H. , Pereira, A. , Devezas, V. , Fernandes, C. , Sousa, F. , Fonseca, T. , Barbosa, E. , & Barbosa, J. A. (2022). The impact of the prognostic nutritional index (PNI) in gastric cancer. Langenbeck's Archives of Surgery, 407(7), 2703–2714. 10.1007/s00423-022-02627-0 [DOI] [PubMed] [Google Scholar]
- Obermair, A. , Simunovic, M. , Isenring, L. , & Janda, M. (2017). Nutrition interventions in patients with gynecological cancers requiring surgery. Gynecologic Oncology, 145(1), 192–199. 10.1016/j.ygyno.2017.01.028 [DOI] [PubMed] [Google Scholar]
- Qiao, Y. , Liu, F. , Peng, Y. , Wang, P. , Ma, B. , Li, L. , Si, C. , Wang, X. , Zhang, M. , & Song, F. (2023). Association of serum klotho levels with cancer and cancer mortality: Evidence from National Health and nutrition examination survey. Cancer Medicine, 12(2), 1922–1934. 10.1002/cam4.5027 [DOI] [PMC free article] [PubMed] [Google Scholar]
- Ray‐Coquard, I. , Cropet, C. , Van Glabbeke, M. , Sebban, C. , Le Cesne, A. , Judson, I. , Tredan, O. , Verweij, J. , Biron, P. , Labidi, I. , Guastalla, J. P. , Bachelot, T. , Perol, D. , Chabaud, S. , Hogendoorn, P. C. , Cassier, P. , Dufresne, A. , Blay, J. Y. , European Organization for Research , … Bone Sarcoma Group . (2009). Lymphopenia as a prognostic factor for overall survival in advanced carcinomas, sarcomas, and lymphomas. Cancer Research, 69(13), 5383–5391. 10.1158/0008-5472.Can-08-3845 [DOI] [PMC free article] [PubMed] [Google Scholar]
- Shen, X. , Yang, L. , Gu, X. , Liu, Y. Y. , & Jiang, L. (2023). Geriatric nutrition risk index as a predictor of cardiovascular and all‐cause mortality in older Americans with diabetes. Diabetology and Metabolic Syndrome, 15(1), 89. 10.1186/s13098-023-01060-7 [DOI] [PMC free article] [PubMed] [Google Scholar]
- Shimizu, Y. , Ashida, R. , Sugiura, T. , Okamura, Y. , Ito, T. , Yamamoto, Y. , Ohgi, K. , Otsuka, S. , Notsu, A. , & Uesaka, K. (2022). Prognostic impact of indicators of systemic inflammation and the nutritional status of patients with resected carcinoma of the ampulla of Vater: A single‐center retrospective study. World Journal of Surgery, 46(1), 246–258. 10.1007/s00268-021-06346-3 [DOI] [PubMed] [Google Scholar]
- Tokunaga, R. , Sakamoto, Y. , Nakagawa, S. , Miyamoto, Y. , Yoshida, N. , Oki, E. , Watanabe, M. , & Baba, H. (2015). Prognostic nutritional index predicts severe complications, recurrence, and poor prognosis in patients with colorectal cancer undergoing primary tumor resection. Diseases of the Colon and Rectum, 58(11), 1048–1057. 10.1097/dcr.0000000000000458 [DOI] [PubMed] [Google Scholar]
- von Elm, E. , Altman, D. G. , Egger, M. , Pocock, S. J. , Gøtzsche, P. C. , & Vandenbroucke, J. P. (2007). The strengthening the reporting of observational studies in epidemiology (STROBE) statement: Guidelines for reporting observational studies. Lancet, 370(9596), 1453–1457. 10.1016/s0140-6736(07)61602-x [DOI] [PubMed] [Google Scholar]
- Walzik, D. , Joisten, N. , Zacher, J. , & Zimmer, P. (2021). Transferring clinically established immune inflammation markers into exercise physiology: Focus on neutrophil‐to‐lymphocyte ratio, platelet‐to‐lymphocyte ratio and systemic immune‐inflammation index. European Journal of Applied Physiology, 121(7), 1803–1814. 10.1007/s00421-021-04668-7 [DOI] [PMC free article] [PubMed] [Google Scholar]
- Wang, L. , Yu, Y. , Ni, S. , Li, D. , Liu, J. , Xie, D. , Chu, H. Y. , Ren, Q. , Zhong, C. , Zhang, N. , Li, N. , Sun, M. , Zhang, Z. K. , Zhuo, Z. , Zhang, H. , Zhang, S. , Li, M. , Xia, W. , Zhang, Z. , … Zhang, G. (2022). Therapeutic aptamer targeting sclerostin loop3 for promoting bone formation without increasing cardiovascular risk in osteogenesis imperfecta mice. Theranostics, 12(13), 5645–5674. 10.7150/thno.63177 [DOI] [PMC free article] [PubMed] [Google Scholar]
- Wen, J. , Pan, Q. , Du, L. L. , Song, J. J. , Liu, Y. P. , Meng, X. B. , Zhang, K. , Gao, J. , Shao, C. L. , Wang, W. Y. , Zhou, H. , & Tang, Y. D. (2023). Association of triglyceride‐glucose index with atherosclerotic cardiovascular disease and mortality among familial hypercholesterolemia patients. Diabetology and Metabolic Syndrome, 15(1), 39. 10.1186/s13098-023-01009-w [DOI] [PMC free article] [PubMed] [Google Scholar]
- Xu, S. , Zhu, H. , & Zheng, Z. (2023). Preoperative prognostic nutritional index predict survival in patients with Resectable adenocarcinoma of the gastroesophageal junction: A retrospective study based on propensity score matching analyses. Cancer Management and Research, 15, 591–599. 10.2147/cmar.S415618 [DOI] [PMC free article] [PubMed] [Google Scholar]
- Ying, H. , Gao, L. , Liao, N. , Xu, X. , Yu, W. , & Hong, W. (2022). Association between niacin and mortality among patients with cancer in the NHANES retrospective cohort. BMC Cancer, 22(1), 1173. 10.1186/s12885-022-10265-4 [DOI] [PMC free article] [PubMed] [Google Scholar]
- Yoshihisa, A. , Kanno, Y. , Watanabe, S. , Yokokawa, T. , Abe, S. , Miyata, M. , Sato, T. , Suzuki, S. , Oikawa, M. , Kobayashi, A. , Yamaki, T. , Kunii, H. , Nakazato, K. , Suzuki, H. , Ishida, T. , & Takeishi, Y. (2018). Impact of nutritional indices on mortality in patients with heart failure. Open Heart, 5(1), e000730. 10.1136/openhrt-2017-000730 [DOI] [PMC free article] [PubMed] [Google Scholar]
- Zhang, X. , Feng, X. , Huai, Q. , Zhu, C. , Sun, Y. , Li, X. , Dai, H. , Wang, H. , & Wang, H. (2023). Development of immune‐related cell‐based machine learning for disease progression and prognosis of alcoholic liver disease. Clinical and Translational Medicine, 13(7), e1322. 10.1002/ctm2.1322 [DOI] [PMC free article] [PubMed] [Google Scholar]
- Zheng, Z. , Zhu, H. , & Cai, H. (2022). Preoperative prognostic nutritional index predict survival in patients with Resectable esophageal squamous cell carcinoma. Frontiers in Nutrition, 9, 824839. 10.3389/fnut.2022.824839 [DOI] [PMC free article] [PubMed] [Google Scholar]
Associated Data
This section collects any data citations, data availability statements, or supplementary materials included in this article.
Data Availability Statement
All the data are publicly accessible and can be obtained from the website: https://wwwn.cdc.gov/nchs/nhanes/search/default.aspx.