

Abstract
INTRODUCTION
Genome‐wide association studies (GWAS) are fundamental for identifying loci associated with diseases. However, they require replication in other ethnicities.
METHODS
We performed GWAS on sporadic Alzheimer's disease (AD) including 539 patients and 854 controls from Argentina and Chile. We combined our results with those from the European Alzheimer and Dementia Biobank (EADB) in a meta‐analysis and tested their genetic risk score (GRS) performance in this admixed population.
RESULTS
We detected apolipoprotein E ε4 as the single genome‐wide significant signal (odds ratio = 2.93 [2.37–3.63], P = 2.6 × 10⁻²³). The meta‐analysis with EADB summary statistics revealed four new loci reaching GWAS significance. Functional annotations of these loci implicated endosome/lysosomal function. Finally, the AD‐GRS presented a similar performance in these populations, despite the score diminished when the Native American ancestry rose.
DISCUSSION
We report the first GWAS on AD in a population from South America. It shows shared genetics modulating AD risk between the European and these admixed populations.
Highlights
This is the first genome‐wide association study on Alzheimer's disease (AD) in a population sample from Argentina and Chile.
Trans‐ethnic meta‐analysis reveals four new loci involving lysosomal function in AD.
This is the first independent replication for TREM2L, IGH‐gene‐cluster, and ADAM17 loci.
A genetic risk score (GRS) developed in Europeans performed well in this population.
The higher the Native American ancestry the lower the GRS values.
Keywords: admixture, genetic risk score, genetics, genome‐wide association study, Hispanic, Latin America, Native‐American ancestry, South America
1. INTRODUCTION
Alzheimer's disease (AD) is a progressive neurodegenerative disorder responsible for most dementia cases worldwide in the elderly population. 1 Although there are numerous studies on AD with the most diverse approaches, the causes and etiology of the disease remain poorly understood. Among them, genome‐wide association studies (GWASs) and meta‐analyses thereof have led to the identification of more than 80 genetic variants contributing to the susceptibility of AD. 2 , 3 , 4 However, the majority of these studies have been performed in European and Asian populations, 5 hindering thereby their translation to populations with different or mixed ancestries, based on possible differences in the genomic structure and/or allele frequencies. These differences might also involve different causative variants across ancestries or allelic heterogeneity, therefore implicating alternative pathogenic and potentially population‐specific mechanisms.
Latin American populations are diverse, not only culturally, but also in their genetic ancestry composition. 6 South American populations present a large genetic diversity in Native American, African, and mestizo populations, between and within countries. 6 , 7 This diversity is likely to have an impact on the distribution of genetic determinants of AD risk across different geographic regions. Unfortunately, systematic genetic studies for translating findings from European to Latin American populations are scarce. 8 , 9 , 10 In fact, 1.3% of individuals in the NHGRI‐EBI GWAS Catalog are Hispanic or Latin American. 5 Consequently, we report here the first GWAS on AD in a population sample from the southern cone of South America. We explored the detected suggestive loci and the known AD variants, in terms of effect size and direction, in a population from Argentina and Chile. We performed a meta‐analysis of these populations with the previous results observed by the European Alzheimer and Dementia Biobank (EADB) 2 to search for additional AD risk signals. Finally, because combined effects of known variants in a genetic risk score (GRS) can identify individuals at the highest risk of future AD, 2 , 3 we tested the performance of the AD‐GRS reported by EADB 2 in this admixed population. Exploring different populations will likely contribute to a better understanding of the pathophysiology of AD. Importantly, understanding population‐shared genetic risk factors, and the allelic heterogeneity of AD, will translate into improved prevention and/or treatment for different populations via precision medicine.
1.1. METHODS
1.1.1. Data collection
Participants in this study were recruited from multiple sources. Further sample descriptions can be found in Table 1.
TABLE 1.
Descriptive characteristics of the samples across datasets.
| Cohort | AD cases | Controls | P‐value | |
|---|---|---|---|---|
| Argentina (N = 1018) | N | 416 | 602 | |
| Female (%) | 66.1 | 71.2 | 0.05 | |
| Age * (years) | 76.3 ± 6.6 | 72.5 ± 7.5 | 2.2e‐16 | |
| APOE ε4 † (%) | 42.8 | 19.1 | 2.9e‐16 | |
| NAM ancestry † (%) | 18.8 ± 21.6 | 24.8 ± 25.4 | 6.2e‐05 | |
| Chile (N = 375) | N | 123 | 252 | |
| Female (%) | 53.7 | 69.4 | 0.004 | |
| Age * (years) | 79.6 ± 10.9 | 81.7 ± 7.4 | 0.39 | |
| APOE ε4 † (%) | 50.4 | 18.7 | 1.5e‐9 | |
| NAM ancestry ‡ (%) | 37.0 ± 11.7 | 38.7 ± 10.5 | 0.16 |
Abbreviations: AD, Alzheimer's disease; APOE, apolipoprotein E; N, number of samples; NAM, Native American.
Mean ± standard deviation.
Percent frequency of APOE ε4 allele.
Mean ± standard deviation of NAM ancestry proportion.
The Argentinian samples were recruited in the context of the Alzheimer's Genetics in Argentina–Alzheimer Argentina consortium (AGA‐ALZAR, https://www.gaaindata.org/partner/AGA), from the following centers: Medical Research Institute A. Lanari (C1427ARO, Buenos Aires), Hospital de Clínicas José de San Martín (C1120AAF, Buenos Aires), Hospital HIGA‐Eva Perón (B1650NBN, General San Martín), Hospital El Cruce (B1888AAE, Florencio Varela), and several geriatric centers across Jujuy and Mendoza provinces, organized and coordinated by their respective Public Ministry of Health. The study (protocol CBFIL#22) was approved by the ethical committee (HHS IRB#00007572, IORG#006295, FWA00020769), and all participants and/or family members gave their informed consent. 11 Diagnosis of AD followed diagnostic criteria from the National Institute of Neurological and Communicative Disorders and Stroke and the Alzheimer's Disease and Related Disorders Association (NINCDS‐ADRDA). 12 , 13 Peripheral blood or saliva samples were processed to obtain DNA using the QIAmp DNA mini kit (Qiagen) and genotyped using the Illumina Infinium Global Screening Array (GSA) v.1.0 combined with a GSA shared custom content.
The Chilean samples recruited correspond to patients with AD and control subjects, from different studies. Control individuals (n = 791) were recruited from the Alexandros longitudinal study, 14 of community‐dwelling older adults (≥60 years old) of different demographic origins and socioeconomic levels, mainly in the study of healthy life expectancy, free of disability and dementia. All participants were randomly selected from 18 primary health care centers and signed an informed consent on enrolment after they had received written and verbal information about the study. The ethical committee of the Institute of Nutrition and Food Technology (INTA), University of Chile (Acta 23, 2012), approved the study protocol (FONDECYT n°1130947). Cognitive status was determined through the Mini‐Mental State Examination (MMSE) 15 with a cut‐off of 21/22, previously validated in Chile. 16 AD patients (n = 91) were recruited at Biomedica Research Group, a clinical research center performing industry‐sponsored international multicenter studies in Santiago. Subjects were comprehensively studied and diagnosed following the NINCDS‐ADRDA 12 , 13 criteria for AD. The GWAS study was approved by the ethics committee “Servicio de Salud Metropolitano Oriente” (SSMO). Additional AD cases and control individuals (32 AD and 20 controls) from Santiago were recruited from the GERO 17 (Geroscience Center for Brain Health and Metabolism) study at the Memory and Neuropsychiatric Center of the Hospital del Salvador and Faculty of Medicine of the University of Chile. The FONDAP GERO project n°15150012 was also approved by the ethics committee of the SSMO.
RESEARCH IN CONTEXT
Systematic review: The authors reviewed the literature using standard sources like PubMed. Genome‐wide association studies (GWAS) are fundamental for identifying loci associated with diseases. They have identified more than 80 variants associated with Alzheimer's disease (AD) risk. However, main studies have been performed on Caucasians, hindering thereby their translation to other populations. All relevant citations were included.
Interpretation: We report the first AD GWAS on the Argentinian and Chilean populations. Trans‐ethnic meta‐analysis revealed four new loci implicating lysosomal function in AD. The European‐developed AD genetic risk score (GRS) performed well in these South American populations, despite the score declines with the increase in Native American ancestry.
Future directions: To improve our knowledge of AD genetics, a large initiative in Latin American populations is ongoing to increase the studied sample size. This will refine the definition of personalized AD risk profiles by a population‐tailored GRS.
A total of 934 samples (n = 800 DNA and n = 134 frozen blood) were sent to Ace Alzheimer Center Barcelona (Barcelona, Spain) for processing. DNA was extracted from peripheral blood according to standard procedures using the Chemagic system (Perkin Elmer). For the starting DNA samples, a re‐extraction protocol using the Chemagic system was also followed to purify the DNA samples. Only samples reaching DNA concentrations of > 10 ng/μL and presenting high integrity were included for genotyping. Finally, AD cases (n = 123) and controls (n = 252) were randomized across sample plates to avoid batch effects. We used the Axiom 815K Spanish biobank array (Thermo Fisher) at the Spanish National Centre for Genotyping (CeGEN, Santiago de Compostela, Spain) for genotyping.
1.2. Quality control and imputation
Details on quality control (QC) and imputation procedures are provided in previous publications, 3 , 18 and performed using PLINK 2.0 19 (www.cog‐genomics.org/plink/2.0/). Briefly, individuals with low‐quality samples, excess of heterozygosity, sex discrepancies, duplicates, and familial relations between samples (PI‐HAT > 0.1875) were excluded from the analysis. Variants with a call rate below 97%, a deviation from the Hardy–Weinberg equilibrium (HWE, P < 1 × 10⁻⁶), or differential missingness between cases and controls were also removed from the analysis. A total number of 1018 samples from Argentina and 375 samples from Chile remained after QC. To maximize genetic coverage, we performed single‐nucleotide polymorphism (SNP) imputation on genome build GRCh38 using the Trans‐Omics for Precision Medicine (TOPMed) imputation server. 20 , 21 , 22 Statistical power was estimated using the Genetic Power Calculator tool 23 (https://zzz.bwh.harvard.edu/gpc/cc2.html), and PowerPlot.R (https://github.com/ilarsf/gwasTools).
1.3. Global ancestry analysis
Global ancestry was estimated as described previously. 11 Briefly, 446 ancestry informative markers (AIMs), specifically selected to estimate ancestry in Latin Americans, 24 were extracted from the Argentinian and Chilean datasets and the reference populations in 1000 Genomes (http://www.internationalgenome.org/): Caucasian (CEU, n = 85), Yorubas African (YRI, n = 88), and Native American 25 (NAM, n = 46). Only AIMs present in all populations and balanced distributed among reference populations and chromosomes, were used to estimate ancestry (n = 356). They were all merged in one PLINK v1.9 file (http://www.cog‐genomics.org/plink/1.9/), and ancestry was predicted using ADMIXTURE v1.3.0. 26 Plots and analysis were performed with R (www.R‐project.org/).
1.4. Association analysis
Several logistic regression models, adjusted for different combinations of age, sex, and the first six principal components (PCs), were evaluated using PLINK 2.0 19 in the Argentinian and Chilean populations. Models fitting were evaluated by Quantile‐plots (QQ‐plots) and genomic inflation factors, obtained using the R package qqman, 27 and distribution of cases and controls across different PCs on principal component analysis plots. The best model in both populations was using the first four PCs as covariates. Low imputation quality variants (R 2 < 0.3) or rare variants (minor allele frequency [MAF] < 1%) were excluded. After study‐specific variant filtering and QC procedures, a fixed effects inverse‐variance weighted meta‐analysis 28 with the Argentinian and Chilean summary statistics was performed for AD association. Plots and analysis were performed with R (www.R‐project.org/). Regional plots were generated with LocusZoom 29 and loci were annotated as the closest genomic feature.
In addition, these Latin populations were combined with EADB stage I summary statistics 2 in a fixed effects inverse‐variance weighted meta‐analysis. 28 Random effects meta‐analysis was also performed with METASOFT, 30 observing similar results.
1.5. Genetic risk score
A weighted individual GRS was calculated based on the AD genetic variants and effect size from the recent meta‐GWAS published 2 by the EADB consortium. Eighty of the selected variants presented high quality in the Argentinian and Chilean cohorts. The GRSs were generated by multiplying the genotype dosage of each risk allele for each variant by its respective weight and then summing across all variants. GRS association with AD cases was tested by a logistic regression model adjusted by 4 PCs in each cohort. The influence of NAM ancestry over GRS was estimated by a linear regression model adjusted by sex, age, and phenotype (control = 0, case = 1) in pooled Argentinian and Chilean samples. The linear model was plotted separately for cases and controls to test the interaction between NAM ancestry and disease. In addition, pooled samples were split in quintiles using NAM ancestry proportion. Differences in GRS values among quintiles were assessed by analysis of variance followed by Tukey post hoc test, and GRS association in each quintile was tested using the same logistic regression model described above. Differences in frequency between the most European (quintiles 1 and 2) and the most NAM individuals (quintiles 4 and 5) were estimated by a logistic regression model of ancestry (mostEUR = 0, mostNAM = 1) versus the 80 SNPs, adjusted by phenotype, sex, and age; P‐values were Bonferroni corrected. All analyses were performed with R (www.R‐project.org/).
2. RESULTS
2.1. Population admixture in Argentinian and Chilean samples
Genome‐wide genotyped data was generated in two samples from the southern cone of Latin America (Table 1), Argentina (n = 1018) and Chile (n = 375). We first explored the ancestry admixture of both populations, observing an admixture between EUR and NAM, without a significant contribution of African ancestry (Figure 1A). While the admixture of Chilean participants is more homogenous, with 75% of the samples showing 30% to 50% NAM ancestry, the Argentinian samples showed more diverse admixture along the NAM and EUR axis, with 32% of individuals having > 30% NAM ancestry (Figure 1A and B). Besides differences in recruitment between the Chilean (only one city, Santiago) and the Argentinian samples (different cities across the country), dissimilar migratory flows and policies between countries may explain these differences in ancestry proportions. Importantly, this admixture distribution is similar in cases and controls in both cohorts (Figure 1B).
FIGURE 1.
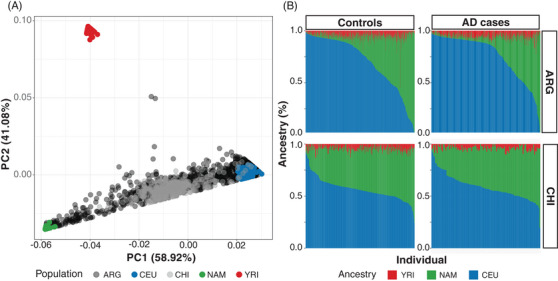
Ancestry analysis of the Argentinian and Chilean populations. A, Principal component analysis (PCA) of ancestry results for the Argentinian sample (ARG, black) and the Chilean sample (CHI, gray). Ancestral populations are Caucasians (CEU, blue), Yoruba (YRI, red), and Native Americans (NAM, green). B, Bar‐plots of each sample (x‐axis) versus their respective percent of Caucasian (CEU, blue), African (YRI, red), and Native American (NAM, green) ancestry (y‐axis).
2.2. Argentinian and Chilean GWAS meta‐analysis
GWAS was performed on each cohort separately and meta‐analyzed as described in Materials and Methods (Figure S1A in supporting information). The combined sample size was 539 patients with AD dementia and 854 controls. Four PCs corrected inflation (λ = 1.01, Figure S1B in supporting information). As expected for a sample size with limited statistical power (Figure S2 in supporting information), only the apolipoprotein E (APOE) locus showed an association with the risk of AD reaching genome‐wide significance (APOE ε4‐rs429358 odds ratio [OR] = 2.93 [2.37–3.63], P = 2.6 × 10⁻²³; APOE ε2‐rs7412 OR = 0.53 [0.34–0.84], P = 6.3 × 10⁻³, Figure S1A). Fifteen loci reached a suggestive P‐value, that is, 5 × 10⁻⁸ < P < 1 × 10⁻⁵ (Table 2). However, neither of these loci was previously reported in association with AD risk in case‐control GWASs nor showed nominal significance (P < 0.05) in the EADB stage I 2 , 3 , 4 (Figure S1A and Table S1 in supporting information). Among these suggestive signals, those at MRPL50P1 and GPX4 deserve further mention (Table 2). At the MRPL50P1 locus, a suggestive association (rs13002275) was previously reported in a GWAS of hippocampal volume in AD. 31 This variant is in linkage disequilibrium (LD) with our top signal rs36039096 at the same locus, with a D’ = 0.91 and low r 2 = 0.14 due to the difference in allele frequency (MAFrs13002275 = 0.39 vs. MAFrs36039096 = 0.21 in Ad Mixed American (AMR, https://www.ncbi.nlm.nih.gov/snp/ and https://ldlink.nci.nih.gov/). On the other hand, the suggestive signal in GPX4 is located close (52.6 Kb) to the known AD locus ABCA7. However, the top SNP signal in our study (rs8103283) does not show LD with the top signal described for ABCA7 in European ancestry (D’ = 0.19, r 2 = 0.02 in AMR, https://ldlink.nci.nih.gov/). In addition, expression quantitative trait loci analysis (https://gtexportal.org/) showed that rs8103283 is modulating the expression of GPX4, POLR2E, and SBNO2 expression but not of ABCA7. Hence, GPX4 might represent an independent signal, which needs further confirmation in larger samples.
TABLE 2.
Suggestive SNPs in Argentina–Chile meta‐analysis.
| Chr | Position * | Marker | Effect allele | Freq. | OR [95% CI] † | P‐value | Loci ‡ |
|---|---|---|---|---|---|---|---|
| 1 | 163485057 | rs2820864 | C | 0.65 | 0.68 [0.58–0.81] | 8.33e‐06 | RNA5SP62 |
| 2 | 35789890 | rs36039096 | A | 0.83 | 0.60 [0.48–0.74] | 2.93e‐06 | MRPL50P1 |
| 2 | 40071018 | rs35392935 | T | 0.02 | 3.49 [2.04–5.96] | 4.63e‐06 | SLC8A1‐AS1 |
| 2 | 67888895 | rs7595509 | A | 0.31 | 0.63 [0.52–0.76] | 3.35e‐06 | LINC01812 |
| 2 | 235676849 | rs12465126 | A | 0.69 | 1.60 [1.32–1.93] | 1.68e‐06 | AGAP1 |
| 5 | 6573819 | rs553467 | A | 0.70 | 1.60 [1.33–1.92] | 4.99e‐07 | LINC01018 |
| 5 | 31656661 | rs29745 | A | 0.89 | 0.52 [0.39–0.69] | 8.38e‐06 | PDZD2 |
| 8 | 77958623 | rs7016182 | C | 0.83 | 1.71 [1.36–2.14] | 4.31e‐06 | AC084706.1 |
| 9 | 92567110 | rs74457370 | A | 0.90 | 0.52 [0.40–0.68] | 1.21e‐06 | CENPP |
| 9 | 97591519 | rs2805792 | T | 0.18 | 0.61 [0.49–0.76] | 9.70e‐06 | TMOD1 |
| 9 | 134858932 | rs57464688 | A | 0.05 | 2.44 [1.65–3.59] | 6.59e‐06 | MIR3689F |
| 13 | 85053369 | rs9566005 | C | 0.87 | 0.58 [0.46–0.74] | 8.60e‐06 | AL356313.1 |
| 14 | 20490566 | rs949937 | A | 0.85 | 0.59 [0.47–0.74] | 5.65e‐06 | PNP |
| 19 | 1103523 | rs8103283 | A | 0.21 | 0.61 [0.49–0.76] | 8.18e‐06 | GPX4 |
| 21 | 34364698 | rs34532322 | A | 0.27 | 1.59 [1.31–1.91] | 1.41e‐06 | KCNE2 |
Abbreviations: Chr, chromosome; CI, confidence interval; OR, odds ratio; SNP, single nucleotide polymorphism.
Position in bp; Freq., effect allele frequency.
Odds ratio [95% confidence interval].
Name of loci is the closest feature.
In addition, we looked for the 83 sentinel signals reported by Bellenguez et al. 2 Nine of these variants were replicated in this population presenting a similar effect size and a P‐value < 0.05 (Table S2 in supporting information).
2.3. Comparison of Argentinian and Chilean GWAS to previous results in Caucasians
We looked for shared genetics between these South American populations with Caucasians, by meta‐analyzing EADB stage I with the Argentinian and Chilean summary statistics. First, we explored the 83 previously reported SNPs. 2 Fifty‐one of them were significant (P < 5 × 10⁻⁸) after meta‐analysis, while 50 were significant in EADB stage I (Table S2). The variant reaching significance was rs60755019 in TREM2L, meaning this signal is replicated in the Argentinian and Chilean populations (Table S2). In addition, we compared P‐values before and after meta‐analysis, despite significance. We observed that 48 out of the 83 SNPs 2 improved their P‐values after meta‐analysis, suggesting these variants are shared among Europeans and the populations studied here (Table S2). Then, we looked for significant signals besides the 83 known ones. Interestingly, we detected six significant SNPs, which were not significant in EADB stage I (Table 3). Two of these SNPs are in high LD with the sentinel variants previously reported 2 in the loci ADAM17 and IGH‐gene‐cluster (Table 3, Table S2). These two signals reached GWAS‐significance in EADB stage I+II 2 ; then, we provide the first independent replication confirming both loci. The other four SNPs are novel associations with AD risk (Table 3). Next, we did functional annotation for these novel loci. rs376291994 is a rare variant in chromosome (chr) 4, not close to any known coding gene. rs1531681 in chr6 seems to modulate brain expression of most zinc finger proteins in the locus (https://gtexportal.org/). These types of proteins have been linked to brain disorders 32 and in particular, ZKSCAN3 with AD in a mouse model. 33 rs115038899 in chr8 is closed to the gene TRIB1 and is in LD (D’ = 0.85, r 2 = 0.70) with rs17405319, which has been associated with several lipid‐related traits (https://www.ebi.ac.uk/gwas/variants/rs17405319). Finally, rs61392417 in chr18 seems to modulate the expression of RNF138 in whole blood (https://gtexportal.org/), which is an E3 ubiquitin‐protein ligase, phosphorylated upon DNA damage, mediating homologous recombination, involved in the innate immune system pathways.
TABLE 3.
Significant SNPs in EADB‐Argentina–Chile meta‐analysis.
| Chr | Position * | Marker | Effect allele | Freq | OR [95%CI] † | P‐value | Annotation ‡ | Direction § | Locus |
|---|---|---|---|---|---|---|---|---|---|
| 2 | 9409624 | rs10169262 | T | 0.202 | 0.95 [0.94‐0.96] | 4.70E‐08 | ITGB1BP1 | — | ADAM17 |
| 4 | 59984152 | rs376291994 | A | 0.997 | 0.65 [0.60–0.71] | 3.79E‐08 | AC097655.1 | –? | new |
| 6 | 28259100 | rs1531681 | A | 0.579 | 0.96 [0.95–0.96] | 4.11E‐08 | NKAPL | — | new |
| 8 | 125446584 | rs115038899 | T | 0.185 | 1.08 [1.06–1.09] | 3.27E‐08 | TRIB1 | +++ | new |
| 14 | 106669877 | rs11849532 | A | 0.131 | 0.93 [0.92—0.95] | 4.59E‐08 | IGHVII‐65‐1 | — | IGH gene |
| 18 | 32075509 | rs61392417 | T | 0.632 | 0.95 [0.95–0.96] | 3.89E‐08 | AC011825.3 | — | new |
Abbreviations: Chr, chromosome; CI, confidence interval; EADB, European Alzheimer and Dementia Biobank; OR, odds ratio; SNP, single nucleotide polymorphism.
Position in bp; Freq, effect allele frequency.
Odds ratio [95% confidence interval].
Closest feature in the genome.
Direction of the effect in EADB stage I, Argentina and Chile summary statistics, respectively; plus sign (+), OR > 1; minus sign (–), OR < 1; question mark (?), missing SNP.
2.4. EADB genetic risk score performance in the Argentinian and Chilean populations
Finally, we sought to explore whether the GRS reported by the EADB 2 consortium can classify cases and controls accurately in the studied populations. To compute the GRS in our sample, we included the 80 SNPs that passed quality controls in both the Argentinian and Chilean datasets, with the effect sizes reported in European ancestry (Table S3 in supporting information). GRS values were normally distributed and logistic regression analysis revealed an association with AD in both Argentinian (GRSmean = 50.4, GRSrange[40.1–61.8], OR = 1.06, P = 7.4 × 10⁻⁴) and Chilean (GRSmean = 49.5, GRSrange[39.3–60.9], OR = 1.16, P = 1.6 × 10⁻⁶) populations.
Because the South American populations analyzed here are genetic admixtures, we investigated whether the NAM ancestry was affecting the GRS values and/or association with the disease. A linear regression model showed that the proportion of NAM ancestry is indeed modulating the GRS values (effect size (β) = −4.84, P < 2 × 10⁻¹⁶), without interacting with the disease (Figure S3 in supporting information). To explore this observation in detail, we split the studied South American sample in quintiles depending on NAM ancestry proportion (Figure 2). Quintiles 1 to 3, containing a larger proportion of Caucasian ancestry individuals, showed GRS values not significantly different among them. Conversely, quintiles 4 and 5, containing a higher proportion of NAM samples, showed GRS values significantly different between them, and smaller than those observed in quintiles 1 through 3 (P < 0.001). While the GRS mean value decreases as the NAM ancestry proportion increases, the GRS association with AD remains similar in each quintile. The effect size for the GRS association is the same in quintile 1 as in quintile 5 (Figure 2).
FIGURE 2.
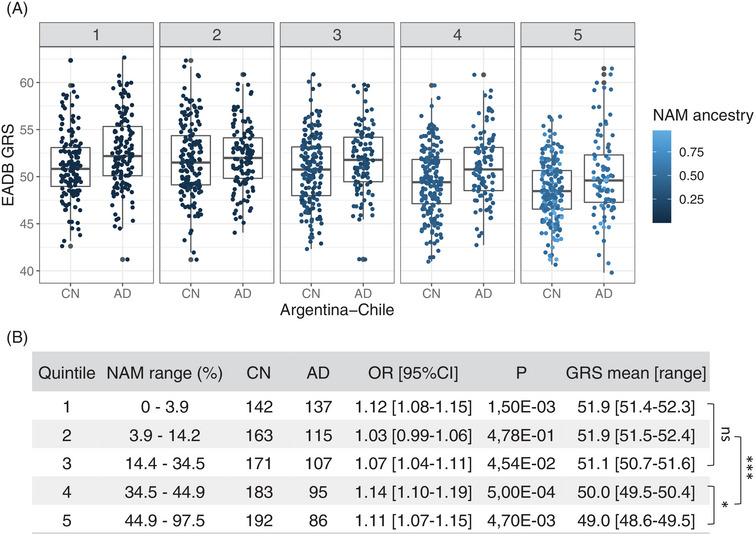
GRS performance and its association with NAM ancestry. GRSs of the samples from Argentina and Chile were split into five groups (quintiles) depending on their proportion of NAM ancestry. A, Boxplot of GRSs in cases (AD) and cognitively normal individuals (CN) present in each quintile (1 to 5). The dot color represents the degree of NAM ancestry of the sample, the lighter the higher the proportion of NAM ancestry. B, Quantitative information of the quintiles. NAM range (%), proportion of NAM ancestry range; CN, number of control samples; AD, number of cases samples; OR [95% CI], GRS effect expressed as odds ratio and 95% confidence interval; P, OR associated P‐value; GRS mean [range], mean value of GRSs and its respective range. At the right of the table, differences among GRS values estimated by two‐way analysis of variance (Tukey's multiple comparisons test) are represented; ns, not significant; *, P < 0.05; ***, P < 0.001. AD, Alzheimer's disease; CI, confidence interval; EADB, European Alzheimer and Dementia Biobank; GRS, genetic risk score; NAM, Native American; OR, odds ratio
Differences in GRS values depend on the frequency of risk alleles in the population analyzed. Consequently, the differences observed in the GRS values in samples with a higher proportion of NAM ancestry may be explained by differences in the risk allele frequency between European and NAM ancestries. To test this hypothesis, we combined quintiles 1 and 2 in one group (mostEUR) and quintiles 4 and 5 in the mostNAM group, and compared risk allele frequencies for each of the 80 SNPs included in the GRS between groups. This comparison showed that allele frequency between both groups was significantly different (P Bonferroni < 0.05) in 38 SNPs, of which 24 showed a lower frequency and 14 had a higher frequency in the mostNAM group (Tables S4 and S5 in supporting information).
3. DISCUSSION
Understanding the genetics of AD is one of the best ways to improve our knowledge about the underlying pathophysiological processes. In this regard, GWAS have been pivotal for the identification of genomic regions associated with the disease. Unfortunately, large international initiatives have focused their research on European ancestry, limiting the generalizability of genetic findings across populations with different ancestries. 5 , 34 Herein, admixture populations living in Latin America still represent a major gap for genetic research. 10 To begin filling this gap, we present here the kickoff study to elucidate AD genetics in the understudied South American population. We carried out the first AD GWAS using 1393 samples from Argentina and Chile, generating the first GWAS summary statistics accessible for these southernmost populations.
While our study lacks statistical power for claiming new population‐specific signals, it is suitable for replication and translation of previously validated loci. Consequently, we provide here an extensive analysis of the main associations reported in European AD GWAS. 2 , 3 , 4 We confirmed our previous observation for the APOE locus, and provided independent validation for several of the 83 SNPs tested, evidencing that they can be translated from Europeans to the Argentinian and Chilean populations. Among these translated signals, we provide the first independent replication for TREM2L, IGH‐gene‐cluster, and ADAM17 signals. Therefore, we confirm that these loci contribute to AD susceptibility in populations other than the Europeans. Additionally, we validate a common variant in the PLCG2 locus, which together with our previous observation 11 reinforces the contribution of this locus to the susceptibility of AD in Argentinians. In addition, we identified four new risk loci, involved in lipid metabolism, immune response, and autophagy, all mechanisms previously linked to AD. As our knowledge of the genetic architecture of AD increases, novel pathways are connected to the pathophysiology of AD including the endosome/lysosome trafficking/function. In our study, the novel genetic loci provide further support for the involvement of this pathway in the pathogenic mechanism operating in AD. Furthermore, we contribute additional evidence for the hypothesis that biological pathways involving lysosomal function might be a shared pathological mechanism across neurodegenerative diseases.
Several studies have shown that GRS generated from European ancestry GWAS works more accurately in Europeans than in non‐Europeans. 34 , 35 In our hands, the AD‐GRS developed in Europeans 2 presented a similar performance in the Argentinian and Chilean populations (OR = 1.09, P = 3.14 × 10⁻⁸) as in the European/Spanish population (GR@ACE 3 , OR = 1.095, P = 9.63 × 10−88), independently of the degree in NAM ancestry present in the target. This means that this GRS could be generalized also to Hispanics/Latinos, as it was observed for other phenotypes. 36 , 37 This can be explained because the admixture found in Argentinians and Chileans includes different proportions of European ancestry. On the other hand, GRS trans‐ethnic performance also seems to depend on the sample size of the discovery GWAS. Thus, it is also possible that this GRS performed well in our South American sample because the EADB GWAS 2 was large enough (> 500K individuals) to accurately calculate the effect sizes to be used as SNP weights.
Interestingly, GRS values decrease as the NAM ancestry proportion increases. While this observation could be a real difference between the risk of AD in the European, Argentinian, and Chilean populations, these reduced GRS values seem more likely caused by incorrect variant selection and/or genetic effects used in the GRS for the target population. In other words, the genetic variants included in the GRS explain apparently less of the genetics driving AD in this ethnic admixture. Supporting this hypothesis, we observed that several SNPs included in the GRS showed significantly different risk allele frequencies between NAM and European ancestry (Tables S4 and S5). This may complicate the direct practical use of the GRS score, and/or set up a pathological predictive threshold. Further studies are needed to understand how to overcome this difficulty.
Our work has some limitations. It does not have the statistical power for a discovery GWAS and/or validation of low‐frequency allelic associations, so we might have missed some genuine signals linked to the NAM ancestry, as well as true associations. In addition, this work might not be representative enough of the allelic variability present in Argentina and Chile, because of their vast territories and the limited number of recruitment centers included in the study. Still, our strength is to start generating genetic information on AD in the southern cone of South America and start identifying trans‐ethnic signals, which contributes to diversity studies.
4. CONCLUSIONS
In conclusion, we provide here the first of a series of AD GWAS to come involving populations originating from countries from Latin America. Our analysis clearly showed shared genetics among the European, Argentinian, and Chilean populations modulating the risk of AD. However, several of these loci probably carry different genetic risk variants that should be added when constructing a GRS in Native American ancestry. Furthermore, a larger initiative is now starting to increase the sample size studied in Latin America, which will lead to a definition of population‐specific estimators for the risk conferred by each variant included in the GRS. Finally, genetic research in the Latin American populations will help improve the definition of personalized risk profiles informing on the individual risk for progressing to dementia. This will likely improve our possibilities for early personalized intervention to prevent or postpone dementia.
AUTHOR CONTRIBUTIONS
Alfredo Ramírez: Laura Morelli: and Agustín Ruiz designed: conceptualized: and supervised the study; interpreted the data; and revised the manuscript. Maria Carolina Dalmasso and Itziar de Rojas contributed to data acquisition; the analysis and interpretation of the data; and co‐wrote the manuscript. Data generation and sample contribution—Argentina: Maria Carolina Dalmasso: Natividad Olivar: Carolina Muchnik: Pablo Galeano: Lorenzo Campanelli: MEC: CL: CF: MS: MF: GJ: Mariana Soledad Sanchez Abalos: Luis Eduardo Martinez: Nancy Medel: Julieta Lisso: Zulma Sevillano: MIB: FDG: Eduardo Miguel Castaño: Claudia Kairiyama: JSA: HS: FJ: Carlos Alberto Mangone: Patricia Solis: Daniel Gustavo Politis: Silvia Kochen: Luis Ignacio Brusco: Laura Montrreal: Alfredo Ramírez; Chile: Sergio Gloger: Bárbara Angel: M. Victoria Chacón: Paulina Orellana: Patricio Fuentes: Agustín Ruiz: and Itziar de Rojas. All authors critically revised the manuscript for important intellectual content and approved the final manuscript.
CONFLICT OF INTEREST STATEMENT
The authors declare that the research was conducted in the absence of any commercial or potential conflict of interest. Author disclosures are available in the supporting information
Supporting information
Supporting Information
Supporting Information
Supporting Information
Supporting Information
Supporting Information
ACKNOWLEDGMENTS
IdR is supported by a national grant from the Instituto de Salud Carlos III (ISCIII) FI20/00215. LC is supported by a doctoral fellowship from CONICET (Argentina). MCD, PG, EMC, SK, and LM are members of the Research Career of CONICET (Argentina). SK, PS, and MCD are supported by the Agencia Nacional de Promoción Científica y Tecnológica (PUE060, PICTO‐2021‐UCTH00005, PICTO‐2021‐UCTH00006). ARu and MB receive support from the European Union / EFPIA Innovative Medicines Initiative joint undertaking ADAPTED and MOPEAD projects (grant numbers 115975 and 115985, respectively). MB and ARu are also supported by national grants PI13/02434, PI16/01861, PI17/01474, PI19/01240, PI19/01301, and PI22/01403. Acción Estratégica en Salud is integrated into the Spanish National R+D+I Plan and funded by ISCIII–Subdirección General de Evaluación and the Fondo Europeo de Desarrollo Regional (FEDER—“Una manera de hacer Europa”). ARu is also funded by JPco‐fuND‐2 “Multinational research projects on Personalized Medicine for Neurodegenerative Diseases,” PREADAPT project (ISCIII grant: AC19/00097), and EURONANOMED III Joint Transnational call for proposals (2017) for European Innovative Research & Technological Development Projects in Nanomedicine (ISCIII grant: AC17/00100). Ace Alzheimer Center Barcelona researchers’ research receives support from Roche, Janssen, Life Molecular Imaging, Araclon Biotech, Alkahest, Laboratorio de Análisis Echevarne, and IrsiCaixa. AS, PO, and CG‐B are supported by grant ANID/FONDAP (ID15150012). JCL is supported by a grant (EADB) from the EU Joint Programme–Neurodegenerative Disease Research. INSERM UMR1167 is also funded by the INSERM, Institut Pasteur de Lille, Lille Métropole Communauté Urbaine, and the French government's LABEX DISTALZ program (development of innovative strategies for a transdisciplinary approach to AD). This study was supported by funding from the Alexander von Humboldt Foundation and International Society for Neurochemistry (ISN) to MCD; the Agencia Nacional de Promoción Científica y Tecnológica (PID‐2011‐0059, PIBT/09‐2013, PICT‐2016‐4647 and PICT2019‐0656 to LM), and from EU‐LAC Health‐Neurodegeneration JOINT CALL 2016 (EULACH16 to LM) of Argentina. The funding for the ALEXANDROS study was provided by the Chilean National Fund for Science and Technology (FONDECYT) grant 1130947. The genotyping for the Chilean series was funded by Genome Research @ Ace Alzheimer Center Barcelona project (GR@ACE), supported by Grifols SA, Fundación bancaria “La Caixa,” Ace Alzheimer Center Barcelona, and CIBERNED. The genotyping of Argentinian samples was funded by the JPND EADB grant (German Federal Ministry of Education and Research, BMBF: 01ED1619A.
Dalmasso MC, de Rojas I, Olivar N, et al. The first genome‐wide association study in the Argentinian and Chilean populations identifies shared genetics with Europeans in Alzheimer's disease. Alzheimer's Dement. 2024;20:1298–1308. 10.1002/alz.13522
Itziar de Rojas and Maria Carolina Dalmasso contributed equally to this work.
Agustín Ruiz, Laura Morelli and Alfredo Ramírez jointly supervised this work.
Contributor Information
Laura Morelli, Email: lmorelli@leloir.org.ar.
Alfredo Ramírez, Email: alfredo.ramirez-zuniga@uk-koeln.de.
DATA AVAILABILITY STATEMENT
The summary statistics of the meta‐analysis are available to the corresponding author upon request.
REFERENCES
- 1. Lane CA, Hardy J, Schott JM. “Alzheimer's disease,”. Eur J Neurol. 2018;25(1):59‐70. doi: 10.1111/ENE.13439 [DOI] [PubMed] [Google Scholar]
- 2. Bellenguez C, Küçükali F, Jansen IE, et al. “New insights into the genetic etiology of Alzheimer's disease and related dementias,”. Nat Genet. 2022:1‐25. doi: 10.1038/s41588-022-01024-z [DOI] [PMC free article] [PubMed] [Google Scholar]
- 3. de Rojas I, Moreno‐Grau S, Tesi N, et al. “Common variants in Alzheimer's disease and risk stratification by polygenic risk scores,”. Nat Commun. 2021;12(1):3417. doi: 10.1038/s41467-021-22491-8 [DOI] [PMC free article] [PubMed] [Google Scholar]
- 4. Wightman DP, Jansen IE, Savage JE, et al. ‘‘A genome‐wide association study with 1,126,563 individuals identifies new risk loci for Alzheimer's disease. Nat Genet. 2021;53(9):1276‐1282. doi: 10.1038/S41588-021-00921-Z [DOI] [PMC free article] [PubMed] [Google Scholar]
- 5. Morales J, Welter D, Bowler EH, et al. “A standardized framework for representation of ancestry data in genomics studies, with application to the NHGRI‐EBI GWAS Catalog,”. Genome Biol. 2018;19(1):1‐10. doi: 10.1186/S13059-018-1396-2/TABLES/2 [DOI] [PMC free article] [PubMed] [Google Scholar]
- 6. Homburger JR, Moreno‐Estrada A, Gignoux CR, et al. Genomic insights into the ancestry and demographic history of South America,’’. PLOS Genet. 2015;11(12):e1005602. doi: 10.1371/JOURNAL.PGEN.1005602 [DOI] [PMC free article] [PubMed] [Google Scholar]
- 7. Bodner M, et al. Rapid coastal spread of First Americans: novel insights from South America's Southern Cone mitochondrial genomes. Genome Res. 2012;22(5):811. doi: 10.1101/GR.131722.111 [DOI] [PMC free article] [PubMed] [Google Scholar]
- 8. Kunkle BW, Schmidt M, Klein HU, et al. “Novel Alzheimer disease risk loci and pathways in African American individuals using the african genome resources panel: a meta‐analysis,”. JAMA Neurol. 2021;78(1):1. doi: 10.1001/JAMANEUROL.2020.3536 [DOI] [PMC free article] [PubMed] [Google Scholar]
- 9. Kretzschmar GC, Antoniazzi AAH, Oliveira LC, et al. First report of CR1 polymorphisms and soluble CR1 levels associated with late onset Alzheimer's Disease (LOAD) in Latin America,’’. J Mol Neurosci. 2020;70(9):1338‐1344. doi: 10.1007/S12031-020-01547-2 [DOI] [PubMed] [Google Scholar]
- 10. Parra MA, , Baez S, Sedeño L, et al. “Dementia in Latin America: paving the way toward a regional action plan,”. Alzheimer's Dement. 2021;17(2):295. doi: 10.1002/ALZ.12202 [DOI] [PMC free article] [PubMed] [Google Scholar]
- 11. Dalmasso MC, Brusco LI, Olivar N, et al. “Transethnic meta‐analysis of rare coding variants in PLCG2, ABI3, and TREM2 supports their general contribution to Alzheimer's disease,”. Transl Psychiatry. 2019;9(1):1‐6. doi: 10.1038/s41398-019-0394-9 2019 91 [DOI] [PMC free article] [PubMed] [Google Scholar]
- 12. Jack CR, Albert MS, Knopman DS, et al. “Introduction to the recommendations from the National Institute on Aging‐Alzheimer's Association workgroups on diagnostic guidelines for Alzheimer's disease,”. Alzheimers Dement. 2011;7(3):257‐262. doi: 10.1016/J.JALZ.2011.03.004 [DOI] [PMC free article] [PubMed] [Google Scholar]
- 13. McKhann G, Drachman D, Folstein M, Katzman R, Price D, Stadlan EM. “Clinical diagnosis of Alzheimer's disease: report of the NINCDS‐ADRDA Work Group* under the auspices of department of health and human services task force on Alzheimer's disease,”. Neurology. 1984;34(7):939‐939. doi: 10.1212/WNL.34.7.939 [DOI] [PubMed] [Google Scholar]
- 14. Albala C, Angel B, Lera L, Sanchez H, Marquez C, Fuentes P. “Low leptin availability as a risk factor for dementia in chilean older people,”. Dement Geriatr Cogn Dis Extra. 2016;6(2):295‐302. doi: 10.1159/000447447 [DOI] [PMC free article] [PubMed] [Google Scholar]
- 15. Folstein MF, Folstein SE, McHugh PR. “‘Mini‐mental state’. A practical method for grading the cognitive state of patients for the clinician,”. J Psychiatr Res. 1975;12(3):189‐198. doi: 10.1016/0022-3956(75)90026-6 [DOI] [PubMed] [Google Scholar]
- 16. Quiroga P, Albala C, Klaasen G. “[Validation of a screening test for age associated cognitive impairment, in Chile],”. Rev Med Chil. 2004;132(4):467‐478. doi: 10.4067/S0034-98872004000400009 [DOI] [PubMed] [Google Scholar]
- 17. Slachevsky A, Zitko P, Martínez‐Pernía D, et al. “GERO cohort protocol, Chile, 2017‐2022: community‐based cohort of functional decline in subjective cognitive complaint elderly,”. BMC Geriatr. 2020;20(1):1‐13. doi: 10.1186/S12877-020-01866-4/TABLES/1 [DOI] [PMC free article] [PubMed] [Google Scholar]
- 18. Moreno‐Grau S, de Rojas I, Hernández I, et al. “Genome‐wide association analysis of dementia and its clinical endophenotypes reveal novel loci associated with Alzheimer's disease and three causality networks: the GR@ACE project,”. Alzheimer's Dement. 2019;0(0). doi: 10.1016/j.jalz.2019.06.4950 [DOI] [PubMed] [Google Scholar]
- 19. Chang CC, Chow CC, Tellier LCAM, Vattikuti S, Purcell SM, Lee JJ. “Second‐generation PLINK: rising to the challenge of larger and richer datasets,”. Gigascience. 2015;4(1):7. doi: 10.1186/s13742-015-0047-8 [DOI] [PMC free article] [PubMed] [Google Scholar]
- 20. Fuchsberger C, Abecasis GR, Hinds DA. “minimac2: faster genotype imputation,”. Bioinformatics. 2015;31(5):782‐784. doi: 10.1093/bioinformatics/btu704 [DOI] [PMC free article] [PubMed] [Google Scholar]
- 21. Taliun D, Harris DN, Kessler MD, et al. ‘‘Sequencing of 53,831 diverse genomes from the NHLBI TOPMed Program. Nat. 2021;5907845(7845):290‐299. doi: 10.1038/s41586-021-03205-y 590 [DOI] [PMC free article] [PubMed] [Google Scholar]
- 22. Das S, Forer L, Schönherr S, et al. “Next‐generation genotype imputation service and methods,”. Nat Genet. 2016;48(10):1284‐1287. doi: 10.1038/ng.3656 [DOI] [PMC free article] [PubMed] [Google Scholar]
- 23. Purcell S, Cherny SS, Sham PC. “Genetic Power Calculator: design of linkage and association genetic mapping studies of complex traits,”. Bioinform Appl NOTE. 2003;19(1):149‐150. Accessed: Jun. 29, 2022. [Online]. Available https://academic.oup.com/bioinformatics/article/19/1/149/316873 [DOI] [PubMed] [Google Scholar]
- 24. Galanter JM, Fernandez‐Lopez JC, Gignoux CR, et al. “Development of a panel of genome‐wide ancestry informative markers to study admixture throughout the Americas,”. PLoS Genet. 2012;8(3). doi: 10.1371/JOURNAL.PGEN.1002554 [DOI] [PMC free article] [PubMed] [Google Scholar]
- 25. Mao X, Bigham AW, Mei R, et al. “A genomewide admixture mapping panel for Hispanic/Latino populations,”. Am J Hum Genet. 2007;80(6):1171‐1178. doi: 10.1086/518564 [DOI] [PMC free article] [PubMed] [Google Scholar]
- 26. Alexander DH, Novembre J, Lange K. “Fast model‐based estimation of ancestry in unrelated individuals,”. Genome Res. 2009;19(9):1655‐1664. doi: 10.1101/GR.094052.109 [DOI] [PMC free article] [PubMed] [Google Scholar]
- 27. Turner SD. ‘‘qqman: an R package for visualizing GWAS results using Q‐Q and manhattan plots. J Open Source Softw. 2018;3(25):731. doi: 10.21105/JOSS.00731 [DOI] [Google Scholar]
- 28. Willer CJ, Li Y, Abecasis GR. “METAL: fast and efficient meta‐analysis of genomewide association scans,”. Bioinformatics. 2010. doi: 10.1093/bioinformatics/btq340 [DOI] [PMC free article] [PubMed] [Google Scholar]
- 29. Boughton AP, Welch RP, Flickinger M, et al. LocusZoom.js: interactive and embeddable visualization of genetic association study results,’’. Bioinformatics. 2021;37(18):3017‐3018. doi: 10.1093/BIOINFORMATICS/BTAB186 [DOI] [PMC free article] [PubMed] [Google Scholar]
- 30. Han B, Eskin E. “Random‐effects model aimed at discovering associations in meta‐analysis of genome‐wide association studies,”. Am J Hum Genet. 2011;88(5):586‐598. doi: 10.1016/j.ajhg.2011.04.014 [DOI] [PMC free article] [PubMed] [Google Scholar]
- 31. Chung J, Wang X, Maruyama T, et al. “Genome‐wide association study of Alzheimer's disease endophenotypes at prediagnosis stages,”. Alzheimers Dement. 2018;14(5):623‐633. doi: 10.1016/J.JALZ.2017.11.006 [DOI] [PMC free article] [PubMed] [Google Scholar]
- 32. Bu S, Lv Y, Liu Y, Qiao S, Wang H. “Zinc finger proteins in neuro‐related diseases progression,”. Front Neurosci. 2021;15:760567. doi: 10.3389/FNINS.2021.760567/BIBTEX [DOI] [PMC free article] [PubMed] [Google Scholar]
- 33. Li T, Yin L, Kang X, et al. “TFEB acetylation promotes lysosome biogenesis and ameliorates Alzheimer's disease–relevant phenotypes in mice,”. J Biol Chem. 2022;298(12):102649‐102650. doi: 10.1016/j.jbc.2022.102649 [DOI] [PMC free article] [PubMed] [Google Scholar]
- 34. Martin AR, Kanai M, Kamatani Y, Okada Y, Neale BM, Daly MJ. “Clinical use of current polygenic risk scores may exacerbate health disparities,”. Nat Genet. 2019;514(4):584‐591. doi: 10.1038/s41588-019-0379-x 51 [DOI] [PMC free article] [PubMed] [Google Scholar]
- 35. Grinde KE, Qi Q, Thornton TA, et al. “Generalizing polygenic risk scores from Europeans to Hispanics/Latinos,”. Genet Epidemiol. 2019;43(1):50‐62. doi: 10.1002/GEPI.22166 [DOI] [PMC free article] [PubMed] [Google Scholar]
- 36. Graff M, Graff M, Emery LS, Justice AE, et al. Genetic architecture of lipid traits in the Hispanic community health study/study of Latinos,’’. Lipids Health Dis. 2017;16(1):1‐12. doi: 10.1186/S12944-017-0591-6/FIGURES/2 [DOI] [PMC free article] [PubMed] [Google Scholar]
- 37. Qi Q, Stilp AM, Sofer T, et al. “Genetics of Type 2 Diabetes in U.S. Hispanic/Latino individuals: results from the hispanic community health study/study of Latinos (HCHS/SOL),”. Diabetes. 2017;66(5):1419‐1425. doi: 10.2337/DB16-1150 [DOI] [PMC free article] [PubMed] [Google Scholar]
Associated Data
This section collects any data citations, data availability statements, or supplementary materials included in this article.
Supplementary Materials
Supporting Information
Supporting Information
Supporting Information
Supporting Information
Supporting Information
Data Availability Statement
The summary statistics of the meta‐analysis are available to the corresponding author upon request.