

Abstract
INTRODUCTION
Identification of psychosocial‐behavioral phenotypes to understand within‐group heterogeneity in risk and resiliency to Alzheimer's disease (AD) within Black/African American and Hispanic/Latino older adults is essential for the implementation of precision health approaches.
METHODS
A cluster analysis was performed on baseline measures of socioeconomic resources (annual income, social support, occupational complexity) and psychiatric distress (chronic stress, depression, anxiety) for 1220 racially/ethnically minoritized adults enrolled in the Health and Aging Brain Study‐Health Disparities (HABS‐HD). Analyses of covariance adjusting for sociodemographic factors examined phenotype differences in cognition and plasma AD biomarkers.
RESULTS
The cluster analysis identified (1) Low Resource/High Distress (n = 256); (2) High Resource/Low Distress (n = 485); and (3) Low Resource/Low Distress (n = 479) phenotypes. The Low Resource/High Distress phenotype displayed poorer cognition and higher plasma neurofilament light chain; differences between the High Resource/Low Distress and Low Resource/Low Distress phenotypes were minimal.
DISCUSSION
The identification of psychosocial‐behavioral phenotypes within racially/ethnically minoritized older adults is crucial to the development of targeted AD prevention and intervention efforts.
Keywords: Alzheimer's disease, psychosocial‐behavioral phenotypes, racial disparities, social determinants of health
1. BACKGROUND
As we continue to make important strides toward increasing the representation of Black/African American (henceforth Black) and Hispanic/Latino (henceforth Latino) community members in Alzheimer's disease (AD) research studies, it is essential that we move beyond racial/ethnic group comparison studies to non‐Latino White (NLW) older adults and focus on characterizing heterogeneity in risk and resilience to AD within communities of color. 1 , 2 Although Black and Latino older adults are disproportionately affected by AD, they are severely underrepresented in AD research and clinical trial initiatives, 3 and our understanding of varied biological manifestations of the disease in these communities of color is limited. 4 , 5 , 6 The National Institute on Aging (NIA) health disparities research framework highlights that AD is shaped by exposure to an array of risk and resiliency factors that fall within discrete domains of influence (sociocultural, behavioral, environmental, and biological). 7 Racially/ethnically minoritized adults are more likely to be exposed to risk factors within each of these domains of influence and are less likely to be exposed to positive factors that may ultimately enhance cognitive or neural reserve. 8 , 9 , 10 , 11 This increased exposure to domain‐specific risk factors is tied to systems of power and oppression that have created barriers intentionally designed to deprive racially/ethnically minoritized communities of resources and opportunity. 10 , 12 , 13 Most studies characterizing AD disparities have focused on examining associations between pathologic aging outcomes and factors within a single domain of influence. For example, lower levels of neighborhood economic resources and higher levels of chronic stress have been independently linked to an increased risk for dementia. 14 , 15 , 16 , 17 , 18 However, there may also be unique interactions between risk factors within these domains that ultimately accelerate cognitive aging trajectories for certain community members. 8 , 19
RESEARCH IN CONTEXT
Systematic review: The identification of distinct psychosocial‐behavioral phenotypes may help clarify important targeted prevention and intervention that reduce racial/ethnic disparities in Alzheimer's disease.
Interpretation: Our study identified three distinct psychosocial‐behavioral phenotypes (Low Resource/High Distress, High Resource/Low Distress [n = 485], and Low Resource/Low Distress) within Black and Latino older adults enrolled in Health and Aging Brain Study‐Health Disparities (HABS‐HD) that displayed varied cognitive and biomarker outcomes.
Future directions: AD risk may be elevated in individuals that belong to the Low Resource/High Distress, but individuals in the Low Resource/Low Distress phenotype appeared to be resilient and displayed similar outcomes to those in the High Resource/Low Distress phenotype. Future work should continue to explore the underlying mechanisms of resiliency that could be leveraged for health equity‐based prevention initiatives and examine longitudinal cognitive and biomarker trajectories of these phenotypes.
Precision health initiatives may help to identify groups of individuals with varying degrees of susceptibility to AD and assist with targeted prevention and intervention efforts that reduce population‐level racial/ethnic disparities. Data‐driven approaches employing machine learning, latent class, or cluster analytic techniques have identified distinct biological and cognitive subgroups of patients with mild cognitive impairment (MCI) that have been shown progress to AD at different rates and display varied patterns of neurodegeneration. 20 , 21 , 22 , 23 , 24 , 25 While these investigations have supported theories that tailored AD pharmacotherapy interventions may be more effective in certain biological and cognitive subgroups, this research has largely taken place in racially homogeneous samples of NLW older adults and has generally not included the modeling other critical factors of influence. Since racial/ethnic disparities in AD are the consequence of social and structural inequities, there is a need to look beyond biological and genetic factors into other multidomain factors. 26 , 27 , 28
Several recent research investigations started the practice of employing data‐driven psychosocial‐behavioral phenotyping methods that incorporate multidomain data pertaining to health behaviors, social determinants of health, environmental resources, and psychological functioning. 29 , 30 , 31 , 32 , 33 These studies have revealed that (1) unique psychosocial phenotypes and combinations of modifiable risk factors can be identified in several samples of older adults and (2) risk for poor cognitive outcomes differ as a function of these identified phenotypes. 29 , 30 , 31 , 32 , 33 For example, in a large sample of community‐dwelling Southeast Asians a latent profile analysis of psychiatric symptom, quality of life, social support, and life satisfaction inventories revealed three psychosocial phenotypes (Positive, Negative, and Neutral); while these groups did not differ in cognitive outcomes, individuals with MCI in the sample were more likely to have lower levels of education and perceived social support and report more severe depressive symptoms. 29 Similarly, in a large sample of Latino older adults, a principal component analysis on several acculturation and socioenvironmental variables revealed three composites (acculturation, socioenvironmental, and familism) that displayed varied associations with cognition. 30 Results revealed the acculturation composite was positively associated with baseline cognition (global, perceptual speed, and episodic memory), whereas the socioenvironmental was negatively associated with baseline cognition (global, perceptual speed, episodic memory, working memory) and faster longitudinal cognitive decline (visuospatial ability). Interestingly, no associations between the familism composite with level and rate of cognitive decline were observed. Although cognitive outcomes were not explored, data from the psychosocial assessment within the Health and Retirement Study was recently used to identify empirically derived adversity profiles among Black, Latino, and NLW middle‐aged and older adults. 34 Results illustrate that across the racial/ethnic groups, individuals with low adversity profiles displayed better mental health outcomes, although the frequency of these adversity profiles was found to differ as a function of nativity and racial/ethnic group status. 35 Taken together, these studies suggest that there is incredible heterogeneity in psychosocial and behavioral factors and that collective considerations of these factors may yield insight into varied cognitive outcomes of adults.
Characterizing psychosocial‐behavioral phenotypes within racially/ethnically minoritized older adults may help with targeted public health prevention efforts, as the identification of socially patterned and multidomain upstream drivers of health disparities, before they become biologically embedded, is ultimately needed to improve health equity and reduce risk for AD in late life. This study sought to extend psychosocial‐behavioral phenotyping methods into a large community‐based study of Black and Latino middle‐aged and older adults (age range 37 to 87) and add to the existing literature by enhancing our understanding of whether the identified psychosocial‐behavioral phenotypes differed on plasma AD biomarkers in an effort to clarify the link between lived experiences and the biology of AD risk within the ethnoracially diverse community members. We (1) conducted a cluster analysis on measures of economic/social resources and psychiatric distress to identify distinct psychosocial‐behavioral phenotypes and (2) compared cross‐sectional cognitive and plasma AD biomarker outcomes of these phenotypes. Importantly, we leveraged key concepts from precision health and the NIA Health Disparities Research Framework that call for multidomain investigations and include measures of risk and resiliency in our modeling to ensure the characterization of prevention points rooted in the lived experiences of racially/ethnically minoritized older adults. 7 , 8 Our goal was to better understand important elements of within‐group heterogeneity that shape or protect against pathologic aging outcomes of racially/ethnically diverse older adults. We hypothesized that the exploratory cluster analysis would identify groups in which high resources/low distress would buffer against poorer cognitive outcomes and groups with low resources/high distress that would display poorer cognitive and worse AD plasma biomarker outcomes.
2. METHODS
2.1. Data availability
This study leveraged data from Health and Aging Brain Study‐Health Disparities (HABS‐HD), 36 a large‐scale research study centered on understanding key drivers of racial/ethnic disparities in AD. HABS‐HD data are publicly available to qualified researchers upon request and were previously described in detail. 36 Participants in the study complete comprehensive neuropsychological testing, medical clinical labs, brain magnetic resonance imaging (MRI) scans, positron emission tomography (PET) scans (amyloid and tau), questionnaires, and functional exams. Participants enrolled in the HABS‐HD study could complete the entire protocol in Spanish or English in accordance with their preferred language. Written informed consent was obtained for all study participants, and HABS‐HD was approved by the University of North Texas Health Science Center Institutional Review Board.
2.2. Inclusion/exclusion criteria
Inclusion criteria for the HABS‐HD study were as follows: community‐dwelling adults ages 30 and older; self‐reported race or ethnicity of Black/African American, Latino, and NLW; fluency in English or Spanish; willingness to provide blood samples; willingness to provide an informant to answer questions regarding daily functioning; and eligible to undergo brain MRI and PET scans. Exclusion criteria included type 1 diabetes, current cancer diagnosis, severe mental illness or an active medical condition that could impact cognition (eg, end stage renal disease), traumatic brain injury with a loss of consciousness within the past 12 months, and current alcohol or substance abuse consistent with Diagnostic And Statistical Manual Of Mental Disorders, Fifth Edition (DSM‐V) diagnostic criteria. 37
2.3. Study participants
Baseline data for 1479 participants were available for use and downloaded on December 1, 2022. This study included 1220 participants (810 Latino and 410 Black adults) that were without dementia at their baseline study visit that also had available psychosocial and psychiatric questionnaire data of interest. Self‐described racial and ethnic groupings were used to categorize participants. Of note, one participant's race and ethnicity were self‐reported as Black and Latino, respectively (the participant was also bilingual in English and Spanish), and this was coded as Latino in the present study.
2.4. Objective cognition, subjective cognitive concerns, and cognitive diagnoses
Cognitive composites were created using sample‐based z‐scores from the entire HABS‐HD sample. Raw scores from each test were converted to z‐scores that were adjusted for age (stratified by ≤ 65 or ≥ 66), education (stratified by 0 to 7, 8 to 12, and ≥ 13 years) and primary language (English vs Spanish). These demographically adjusted sample‐based z‐scores were then used to create a z‐score composite of memory and executive functioning. The adjusted z‐scores from the immediate and delayed recall trials from the Wechsler Memory Scale, 3rd Edition (WMS‐III), Logical Memory, and the Spanish‐English Verbal Learning Test were averaged to create a memory composite. 38 , 39 The adjusted z‐scores for the WMS‐III Digit Span total score, Trail Making Test Parts A & B total time, and the Letter fluency (FAS) total scores were averaged to create an executive functioning composite. 39 , 40 Subjective memory concerns were assessed with the 14‐item Subjective Memory Complaints Questionnaire. 41
Cognitively unimpaired (CU) and mild cognitive impairment (MCI) status was based on consensus diagnoses by expert study clinicians. The Mini‐Mental Status Examination (MMSE) total score was used to characterize general cognition. Participants were determined to be CU if they had a Clinical Dementia Rating (CDR) sum of boxes score of 0, neuropsychological test scores considered broadly within normal limits (demographically adjusted cognitive z‐scores > −1.5), and no self‐ or informant‐reported complaints of cognitive change. Participants were determined to meet MCI criteria if they had a CDR sum of boxes score of 0.5 to 2, one or more demographically adjusted cognitive z‐scores ≤ 1.5, and endorsed self‐ or informant‐reported complaints of cognitive change.
2.5. Psychosocial resources and psychiatric functioning
With regard to psychosocial resources, participants completed a background question that collected annual household income and occupational history data; local study staff (N.O.) used industry classification data to complete occupational complexity ratings for each subject. 42 , 43 , 44 The Interpersonal Support and Evaluation List was used to characterize perceived social support. 45 With regard to psychiatric functioning, worry was assessed using the Penn State Worry Questionnaire, 46 the Geriatric Depression Scale (GDS) characterized depressive symptoms 47 , and the Chronic Burden Scale assessed chronic stress. 36 , 48
2.6. Plasma AD biomarkers, genetic risk, and vascular burden
Plasma amyloid beta 40 (Aβ40)/42 (Aβ42) ratio, neurofilament light chain (NfL), and total tau (t‐tau) were assessed using the ultra‐sensitive Simoa technology platform (Quanterix.com). Higher plasma NfL and t‐tau but lower plasma Aβ42/Aβ40 are associated with poor clinical and cognitive outcomes. 49 , 50 , 51 APOE ε4 positivity was determined by the possession of at least one ε4 allele (i.e., ε2/ε4; ε3/ε4; ε4/ε4 carriers were coded as positive). Assay preparation was completed using a custom automatic StarPlus system from Hamilton Robotics. 36 Elevated waist circumference (WC; women > 35, men > 40 inches), blood pressure (systolic > 129 or diastolic > 84 mm Hg), triglycerides (> 149 mg/dL), glucose (> 100 mg/dL), and low levels of high‐density lipoprotein (HDL; < 50 mg/dL in women, < 40 mg/dL in men), consistent with the clinical criteria for metabolic syndrome, 52 were summed into a cardiometabolic vascular burden variable that ranged from 0 to 5.
2.7. Statistical analyses
All analyses were performed with the Statistical Package for the Social Sciences (SPSS) version 26 and R version 3.5.0 (https://cran.r‐project.org/). Data were screened to ensure basic assumptions were met. Independent and dependent variables of interest were z‐scored, and values that physiologically implausible values or determined to be outliers per Grubb's test were excluded from analyses. Sample sizes differed slightly for biomarker data given these data are released in biannual batches, and some subjects may not have had available data at the time. See Supplemental Figure 1 for a visual schematic of data included in the study.
Psychosocial resource and psychiatric functioning variables were converted to standardized z‐scores, and hierarchical cluster analysis using Ward's methods was performed on these scores. 53 The cluster analysis was performed in an iterative fashion with k set to 2, 3, and 4 in order to yield a predetermined set of groupings that were maximally different from each other. A discriminant function analysis then tested whether each psychosocial resource and psychiatric functioning variable could predict the k = 2, 3, and 4 group membership. The stability of the cluster solution was also examined using leave‐one‐out cross‐validation in an effort to reduce the potential bias of utilizing the same participants to develop the classification matrix and compute the discriminant function. 54 The k = 3 solution was considered to be statistically and theoretically meaningful relative to the other iterations; this determination was based on visual inspection on each cluster solution and the classification statistics for the discriminant functional analysis, as the cluster solution with the greatest leave‐one‐out cross‐validation statistics that also resulted in the classification of each participant was chosen.
Analyses of variance (ANOVAs) were used to determine whether the cluster groups differed on continuous demographic and clinical variables. Chi‐squared analyses examined group differences on categorical demographic and clinical variables. Analyses of covariance (ANCOVAs) were used to determine whether the clusters differed on cognition and AD plasma biomarkers. Covariates included age, sex, education, race, and vascular risk burden.
3. RESULTS
3.1. Cluster‐derived psychosocial‐behavioral phenotypes
The cluster analysis resulted in 3‐group solution that included a (1) Low Resource/High Distress group (n = 256), (2) High Resource/Low Distress group (n = 485), and Low Resource/Low Distress group (n = 479). A discriminate function analysis using the standardized psychosocial resource and psychiatric functioning variables to predict cluster group membership correctly classified 83.3% of the participants. Cross‐validation of the solution using the leave‐one‐out method correctly classified 82.7% of the participants (Figure 1). The cluster analysis was repeated within the Latino and Black participant groups separately to ensure the general pattern of clusters was similar.
FIGURE 1.
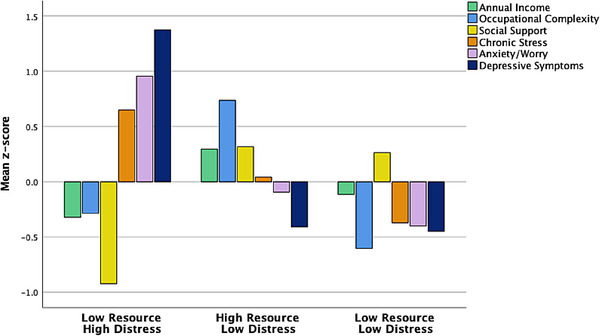
Psychosocial‐behavioral phenotypes of all racially/ethnically minoritized HABS‐HD older adults. Top: bar graph of mean resource and psychiatric factors across identified clusters. Bottom: violin plot showing distribution across mean resource and psychiatric factors across identified clusters.
Within the Latino participant group, the 3‐group solution included a (1) Low Resource/High Distress group (n = 170), (2) High Resource/Low Distress group (n = 344), and a Low Resource/Low Distress group (n = 296). A discriminate function analysis using the standardized psychosocial resource and psychiatric functioning variables to predict cluster group membership correctly classified 91.0% of the participants. Cross‐validation of the solution using the leave‐one‐out method correctly classified 90.6% of the participants (Figure 2).
FIGURE 2.
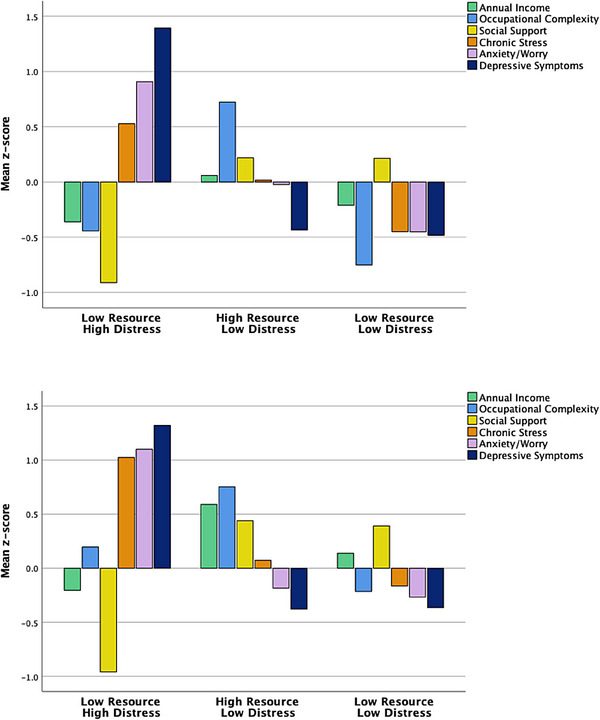
Psychosocial‐behavioral phenotypes of Latino and Black older adults only. Top: bar graph of mean resource and psychiatric factors across identified clusters in Latino older adults. Bottom: bar graph of mean resource and psychiatric factors across identified clusters in Black older adults.
Within the Black participant group, the cluster analysis resulted in a 3‐group solution that included a (1) Low Resource/High Distress group (n = 162), (2) High Resource/Low Distress group (n = 63), and (3) Low Resource/Low Distress group (n = 185). With regard to the Low Resource/Low Distress group, there was some variability in the overall levels of the resource and distress variables when compared to the larger sample, but these were still in the low/average range. A discriminate function analysis using the standardized psychosocial resource and psychiatric functioning variables to predict cluster group membership correctly classified 86.1% of the participants. Cross‐validation of the solution using the leave‐one‐out method correctly classified 85.1% of the participants. Given the consistency and acceptable classification statistics of the racial/ethnic subgroup analyses, all subsequent analyses were conducted with the cross‐sample 3‐cluster solution (Figure 2).
3.2. Demographic comparisons of cluster‐derived psychosocial‐behavioral phenotypes
Demographic and clinical characteristics by cluster group are shown in Table 1. ANOVAs revealed the cluster groups significantly differed on education (F = 82.57, p < .001, η 2 = 0.12), MMSE total score (F = 37.44, p < .001, η 2 = 0.06), and cardiovascular risk (F = 5.19, p = .004, η 2 = 0.008); there were no cluster group differences in age (F = 0.53, p = .591, η 2 = 0.009). There were significant cluster group differences in the proportion of Black older adults (χ2 = 42.14, p < .001, V = 0.19) and women (χ2 = 14.27, p < .001, V = 0.11) across clusters; however, the groups did not significantly differ in the proportion of APOE‐e4 carriers (χ2 = 2.02, p = .36, V = 0.06) or individuals diagnosed with MCI (χ2 = 4.21, p = .12, V = 0.06).
TABLE 1.
Sociodemographic characteristics of psychosocial‐behavioral phenotypes.
|
Cluster 1: Low Resource/High Distress n = 256 |
Cluster 2: High Resource/Low Distress n = 485 |
Cluster 3: Low Resource/Low Distress n = 479 |
Omnibus test result | Pairwise comparisons | |||||
|---|---|---|---|---|---|---|---|---|---|
| Variable | Test statistic | P value |
Effect size (V or η 2) |
𝜑1‐2 | 𝜑1‐3 | 𝜑2‐3 | |||
| Age, M (SD) | 63.72 (8.02) | 63.11 (7.88) | 63.34 (7.30) | F = 0.53 | .60 | 0.001 | – | – | – |
| Female, n (%) | 180 (70.31) | 323 (66.60) | 276 (57.62) | χ2 = 14.27 | <.001 | 0.11 | 0.30 | <0.001 | 0.004 |
| Race/ethnicity | |||||||||
| Latino, n (%) | 193 (75.40) | 270 (55.67) | 347 (72.44) | χ2 = 42.14 | <.001 | 0.19 | <0.001 | 0.39 | <0.001 |
| Black, n (%) | 63 (24.61) | 215 (44.33) | 132 (27.56) | ||||||
| Years of education, M (SD) | 9.94 (4.52) | 13.79 (3.97) | 11.06 (4.51) | F = 82.57 | <.001 | 0.12 | <0.001 | <0.001 | <0.001 |
| Spanish speaking, n (%) | 132 (51.56) | 131(27.01) | 233 (48.64) | χ2 = 62.72 | <.001 | 0.23 | <0.001 | 0.45 | <0.001 |
| MCI, n (%) | 72 (28.13) | 104 (21.44) | 111 (23.17) | χ2 = 4.21 | .12 | 0.06 | – | – | – |
| APOE e4 carrier, n (%) | 23 (14.84) | 41 (20.20) | 44 (16.36) | χ2 = 2.02 | .36 | 0.06 | – | – | – |
| Cardiometabolic burden, M (SD) | 2.66 (1.31) | 2.33 (1.29) | 2.43 (1.29) | F = 5.19 | .004 | 0.008 | 0.001 | 0.03 | 0.23 |
| Psychosocial Resources/Psychiatric Functioning | |||||||||
|---|---|---|---|---|---|---|---|---|---|
| Annual household income, M(SD) | 28,259.93 (23,712.43) | 71,513.55 (63,123.41) | 42,809.62 (33,574.07) | F = 85.91 | <.001 | 0.12 | <0.001 | <0.001 | <0.001 |
| Occupational complexity total score, M (SD) | 5.76 (4.30) | 9.90 (2.64) | 4.47 (2.96) | F = 372.15 | <.001 | 0.38 | <0.001 | <0.001 | <0.001 |
| Social support total score, M (SD) | 34.65 (6.28) | 42.47 (5.17) | 42.13 (5.10) | F = 203.73 | <.001 | 0.25 | <0.001 | <0.001 | 0.33 |
| Chronic stress total score, M (SD) | 11.89 (7.58) | 7.77 (6.55) | 4.97 (4.74) | F = 105.76 | <.001 | 0.15 | <0.001 | <0.001 | <0.001 |
| Anxiety/worry total score, M (SD) | 52.77 (13.23) | 37.61 (13.79) | 33.18 (10.32) | F = 212.87 | <.001 | 0.26 | <0.001 | <0.001 | <0.001 |
| Depressive symptoms total score, M (SD) | 14.08 (5.50) | 3.73 (3.16) | 3.49 (2.82) | F = 825.50 | <.001 | 0.58 | <0.001 | <0.001 | 0.32 |
| Cognition | |||||||||
|---|---|---|---|---|---|---|---|---|---|
| MMSE total score, M (SD) | 26.31 (3.30) | 27.91 (2.01) | 26.92 (2.56) | F = 37.44 | <.001 | 0.06 | <0.001 | 0.002 | <0.001 |
| SMC (z‐score), M (SD) a | 0.89 (1.10) | ‐0.19 (0.83) | ‐0.29 (0.81) | F = 143.14 | <.001 | 0.19 | <0.001 | <0.001 | 0.012 |
| Memory composite (z‐score), M (SD) a | −0.02 (0.76) | 0.14 (0.74) | 0.13 (1.91) | F = 1.68 | .19 | 0.003 | – | – | – |
| Executive composite (z‐score), M(SD) a | −0.40 (0.84) | 0.05 (0.74) | ‐0.05 (0.82) | F = 15.43 | <.001 | 0.025 | <0.001 | <0.001 | 0.91 |
| Plasma AD Biomarkers | |||||||||
|---|---|---|---|---|---|---|---|---|---|
| Aβ42/Aβ40 ratio (z‐score), M (SD) a | −0.07 (0.79) | 0.04 (1.25) | ‐0.004 (0.82) | F = 0.05 | .95 | <0.001 | – | – | – |
| NfL pg/ml (z‐score), M (SD) a | −0.04 (0.55) | ‐0.12 (0.54) | ‐0.19 (0.42) | F = 7.47 | <.001 | 0.016 | 0.91 | 0.003 | <0.001 |
| Total tau pg/ml (z‐score), M (SD) a | 0.14 (0.89) | ‐0.06 (0.82) | ‐0.08 (0.80) | F = 2.07 | .13 | 0.004 | – | – | – |
Denotes estimated marginal means reported from ANCOVA models adjusted for age, sex, education, cardiometabolic burden, and race/ethnicity.
M = mean; SD = standard deviation; MCI = mild cognitive impairment, APOE = apolipoprotein; MMSE = Mini‐Mental Status Examination; SMC = subjective memory concerns; Aβ = amyloid beta; NfL = plasma neurofilament light chain; Tau = plasma total tau. Missing data: Of the 1220 participants, 593 (48.61%) had missing APOE genotyping. Of the 256 participants from the Low Resource/High Distress phenotype, 101 (39.45%) had missing APOE genotyping. Of the 485 participants from the High Resource/Low Distress phenotype, 282 (58.14%) had missing APOE genotyping. Of the 479 participants from the Low Resource/Low Distress group, 210 (43.84%) had missing APOE genotyping. Of the 256 participants from the Low Resource/High Distress phenotype, 64 (25%) had missing Aβ42/Aβ40 ratio data, 60 (23%) had missing plasma NfL data, and 60 (23%) had missing plasma total tau data.Of the 485 participants from the High Resource/Low Distress phenotype, 122 (25%) had missing Aβ42/Aβ40 ratio data, 118 (24%) had missing plasma NfL data, and 116 (24%) had missing plasma total tau data. Of the 479 participants from the Low Resource/Low Distress group, 95 (19%) had missing Aβ42/Aβ40 ratio data, 93 (19%) had missing plasma NfL data, and 89 (29%) had missing plasma total tau data.
3.3. Cognitive comparisons of cluster‐derived psychosocial‐behavioral phenotypes
ANCOVAs adjusted for age, sex, education, vascular risk, and race/ethnicity revealed that the cluster groups significantly differed on the executive functions composite (F = 15.43, p < .001, partial η 2 = 0.025). Pairwise comparisons revealed that the Low Resource/High Distress group performed significantly worse than the High Resource/Low Distress and Low Resource/Low Distress groups (ps < 0.001). There were no significant differences between the High Resource/Low Distress and Low Resource/Low Distress groups (p = .91). There were no significant group differences on the memory composite (F = 1.68, p = .19, partial η 2 = 0.003). However, the groups significantly differed on subjective memory concerns (F = 143.14, p < .001, partial η 2 = 0.19). Pairwise comparisons revealed that the Low Resource/High Distress group had significantly greater memory concerns relative to the High Resource/Low Distress and Low Resource/Low Distress groups (ps < 0.001). Additionally, the High Resource/Low Distress group had significantly greater memory concerns relative to the Low Resource/Low Distress group (p = .012) (Figure 3).
FIGURE 3.
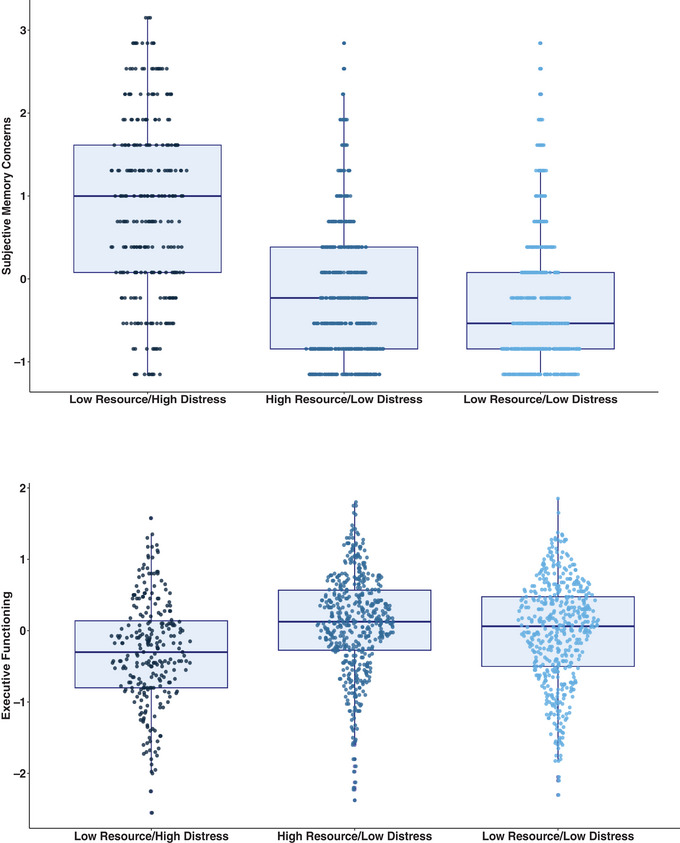
Psychosocial‐behavioral phenotypes and subjective/objective cognition. Top: boxplot of subjective memory concerns across clusters. Bottom: boxplot of performance on executive functioning composite across clusters.
3.4. AD plasma biomarker comparisons of cluster‐derived psychosocial‐behavioral phenotypes
ANCOVAs adjusted for age, sex, education, vascular risk, and race/ethnicity revealed the groups differed significantly on plasma NfL (F = 7.47, p < .001, partial η 2 = 0.016). Pairwise comparisons revealed that the Low Resource/High Distress (p = .003) and High Resource/Low Distress (p < .001) groups had significantly higher levels of plasma NfL relative to the Low Resource/Low Distress group. However, there was no significant differences in plasma NfL levels between the Low Resource/High Distress and High Resource/Low Distress groups (p = .91) (Figure 4). Finally, no significant group differences in plasma total tau (F = 2.07, p = .13, partial η 2 = 0.004) or AB42/40 levels (F = 0.05, p = .95, partial η 2 < 0.001) were observed.
FIGURE 4.
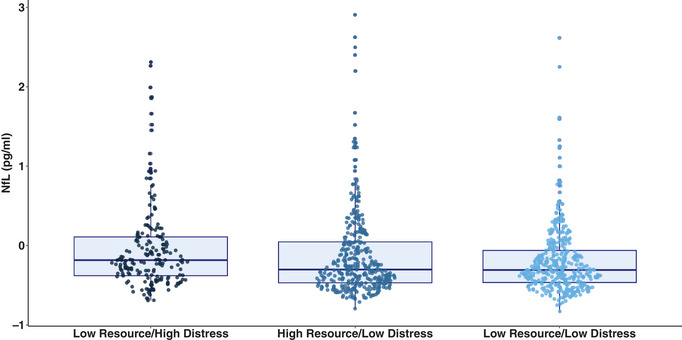
Boxplot of neurofilament light chain across psychosocial phenotypes.
4. DISCUSSION
In this study we employed a data‐driven approach to identify distinct psychosocial phenotypes in an effort to better understand risk of and resiliency to AD in Black and Latino older adults. Our analyses revealed three distinct phenotypes: Low Resource/High Distress, High Resource/Low Distress, and a Low Resource/Low Distress. The Low Resource/High Distress phenotype made up the smallest proportion of the sample but represented a vulnerable group that displayed the worst cognitive outcomes and had the highest levels of plasma NfL relative to the other phenotypes. Interestingly, analyses also revealed a resilient Low Resource/Low Distress phenotype that did not differ from the High Resource/Low Distress phenotype on several biomarker or objective cognitive outcomes. Results from this study revealed that cluster analysis techniques can be used to explain within‐group heterogeneity in the lived experiences of minoritized adults and that these distinct psychosocial phenotypes may have varying degrees of susceptibility to AD and poor cognitive outcomes.
Data‐driven approaches to phenotyping have primarily included biological characterizations of individuals “at risk” for AD due to the advancement of high‐throughput multi‐omics methods. 55 , 56 This emphasis on biology has centered on (1) the development of therapeutic targets and enrichment of clinical trial recruitment efforts that may optimize outcomes and reduce costs and (2) the characterization of biological processes associated with racial/ethnic differences in AD risk. For example, the identification of amyloid‐positive individuals that may be more likely to benefit from anti‐amyloid agents prior to the onset of cognitive impairment has been used to direct some clinical trial initiatives. 57 , 58 Furthermore, as illustrated by another recent HABS‐HD investigation, there are distinct proteomic profiles of neurodegeneration in NHL and Latino older adults, and the biological factors underlying neurodegeneration within each racial/ethnic group differ across the MCI and AD phases. 59 While limited, several recent efforts have been made to engage in psychosocial and behavioral phenotyping methods within middle‐aged and older adult samples, with specific efforts to take into account the cumulative influence of multiple socioeconomic, contextual, and behavioral factors on cognitive outcomes. 31 , 32 One recent study employed machine learning methods within a large cohort study of Australian adults (n = 4141, age range 34 to 97) and identified that the collective influence of a number of sociodemographic (eg, age, income, education) and lifestyle (eg, sedentary behavior, exercise) factors were predictive of cognitive classes. 32 Notably, the authors in that study observed no associations between environmental factors (eg, population density, aerial distance to parkland) and cognition. 32 Collectively, our results suggest empirical psychosocial‐behavioral phenotyping methods may allow for a more nuanced understanding of how AD risk is shaped and, ultimately, prove useful for the development of individualized interventions essential to promoting longevity and health equity within racially/ethnically minoritized older adults.
Although other studies have employed similar empirical methods, 29 , 30 , 34 a comparative strength of our study was that we performed our cluster analyses both across and within each racial/ethnic group. Results revealed the Low Resource/High Distress, High Resource/Low Distress, and Low Resource/Low Distress phenotypes emerged within each set of analyses and that classification statistics were high within each racial/ethnic group as well. However, more nuanced patterns to our findings warrant recognition, as Black adults were overrepresented in the High Resource/Low Distress phenotype relative to the other two phenotypes. Additionally, ancillary exploratory analyses revealed that within the High Resource/Low Distress phenotype, Black adults had significantly higher levels of income and social support relative to Latinos; within the Low Resource/Low Distress phenotype, Black adults had significantly lower symptoms of stress, worry, and depression but higher levels of income, social support, and occupational complexity compared to Latinos. In other words, while overall patterns of phenotypes are similar across the groups, measured levels of these variables may also differ within each group. It is also critical to recognize that there is also incredible variability in precisely which risk factors Black and Latino community members are exposed to across the life course and that these racial/ethnic groups may face unique barriers (eg, anti‐Black or anti‐immigrant sentiments, language barriers) and have distinct lived experiences (eg, acculturation, John Henryism). Indeed, as noted by Lamar and colleagues (2021), culture‐specific psychosocial‐behavioral factors may differentially contribute to cognitive outcomes in Latino older adults, and there is a need to further delineate these within the context of AD research initiatives centered on communities of color. 4 , 5 , 60 , 61
Although the Low Resource/High Distress phenotype was a smaller subset of the larger sample, the individuals in this group displayed poorer performance on the executive functioning composite and endorsed more severe subjective memory concerns relative to the Low Resource/ Low Distress and High Resource/Low Distress phenotypes. In contrast, there were no differences in performance on the memory composite across the phenotypes. The larger literature has highlighted that executive dysfunction is commonly observed within these ethnoracial groups, and elevated rates of vascular risk and psychiatric symptoms may represent mechanisms underlying this observation. 62 , 63 , 64 , 65 , 66 With regard to memory, the relationship between subjective concerns and objective performance is small, 67 , 68 and investigators have noted differences in the frequency and severity of subjective cognitive concerns between ethnoracial groups. 69 , 70 Since subjective memory concerns have been tightly linked with affective symptoms, 7 we suspect the notable differences in subjective, but not objective, memory performance may have been a function of psychiatric distress within the Low Resource/High Distress phenotype. Targeted management of psychiatric symptoms and enhanced access to socioeconomic or care‐support resources may help mitigate poor future outcomes within this group.
The Low Resource/High Distress phenotype also displayed higher levels of plasma NfL, although there were no differences between any of the groups in plasma markers of amyloid or tau. Importantly, socially patterned inequities can become biologically embedded, negatively impact cognitive and neural reserve, and accelerate cognitive decline. 7 , 9 Furthermore, higher levels of psychiatric symptomatology have been linked to neurodegeneration and accelerated cognitive decline in older adults. 71 , 72 , 73 While NfL levels have been shown to increase across the preclinical to clinical phase of AD, 74 , 75 this is a non‐specific marker of neurodegeneration, and other pathologic processes may be at play. 76 Thus, it is possible that the observed cognitive outcomes and elevated levels of NfL observed are indicative of a neurodegenerative process that is fundamentally tied to the underlying lived experiences of this psychosocial phenotype, including the increased anxiety, depressive symptoms, and stress in the context of lack of social support or other financial resources to help manage cognitive challenges. However, it is important to note that plasma AD biomarkers also have varied degrees of prognostic utility and that plasma phosphorylated tau, which was not available in the HABS‐HD study, has been shown to be a more reliably correlated with amyloid PET neuroimaging metrics of AD pathology. 77 , 78 , 79 Future work exploring the longitudinal cognitive, biomarker, and neuroimaging trajectories of this psychosocial phenotypes is also needed.
Our study also identified two resilient groups that had low levels of psychiatric distress in the presence of varied levels of resources. While these two groups did not differ on objective neuropsychological measures and plasma markers of amyloid and tau, there were some notable differences in subjective cognition and plasma AD markers. Interestingly, the identified Low Resource/Low Distress group had fewer subjective memory concerns and lower levels of plasma NfL relative to the High Resource/Low Distress group. While the economic and occupation resources were generally much lower in the Low Resource/Low Distress group, it is important to recognize that the levels of social support was largely comparable to the observed levels in the High Resource/Low Distress group. Results suggest that social support may be an important mechanism of resiliency within the Low Resource/Low Distress group that warrants close attention and may ultimately buffer against the other low resources. 80 , 81 Given that loneliness and social isolation may accelerate cognitive decline, 82 enhanced social support and interaction may represent an important modifiable prevention and intervention factor within minoritized older adults.
Notable limitations of the study include the need to model multidomain psychosocial factors that do not transcend multiple socioecological levels of influence, and future studies that include geocoded variables may help provide more insight into other important elements of these psychosocial phenotypes. This sample consisted largely of cognitively unimpaired individuals, and base rates of MCI were low; as such, studies examining whether these phenotypes emerge and display different biomarker and cognitive trajectories is needed. While MCI was diagnosed in a consensus meeting by trained study staff and was consist with conventional Petersen/Winblad criteria, 83 other criteria have been shown to lead to a better balance of sensitivity and reliability in MCI; 84 , 85 , 86 additional research in more racially/ethnically representative samples is ultimately needed to confirm the utility of these MCI criteria, especially given they have been primarily developed in homogeneous samples of largely educated White older adults. A subset of individuals (n = 258) that did not have psychiatric or resource data of interest were excluded from the study, and sensitivity analyses revealed these individuals were slightly younger, more likely to be Black or Spanish speaking, and less educated relative to those that were included. While we adjust for many of these factors in our analyses and HABS‐HD allows for the completion of the study in a participant's preferred language, it is important to acknowledge that observed cluster patterns and outcomes might have changed if these individuals had had available data and had been included. Similarly, plasma biomarker data were missing for around 20% of the sample given constraints surrounding the batched processing of these data, and replication of observed patterns with these individuals will be included in the future. Plasma AD markers can be easily implemented in traditionally underserved populations, but neuroimaging markers of amyloid, tau, or neurodegeneration may provide more insight into ongoing patterns of neural change across the groups. It is important to note that while NfL levels have been shown to increase across the preclinical to clinical phase of AD, 74 , 75 this is a non‐specific marker of neurodegeneration, and other pathologic processes may be at play. 76 Given vascular health disparities, future work may need to look beyond traditional plasma AD markers to assessing vascular, inflammatory, and metabolic biomarkers that may play an important role in accelerated aging trajectories across the sample. Finally, modeling longitudinal change or variation in socioeconomic resources and psychiatric functioning across the life course and its association with cognition may ultimately improve our understanding of modifiable risk factors in AD risk in late life.
There are several notable strengths of the study, including its data‐driven approach and novel psychosocial characterization of distinct phenotypes. Importantly, these analyses were conducted within a large sample (N ≈ 1400) of racially/ethnically diverse adults that included individuals in mid‐to‐late life (age range 37 to 87), whereas most studies exploring psychosocial‐behavioral phenotyping methods within these groups have largely taken place in adults above the age of 50 or used data reduction techniques that do not allow for a more nuanced pattern of how variables are behaving within each cluster. Furthermore, cluster analysis was conducted both across and within these racial/ethnic groups to ensure these phenotypes were not specific to one group. Finally, our psychosocial‐behavioral phenotyping provides insight into sociobiological pathways (ie, Low Resource/High Distress and neurodegeneration as indexed by NfL) that is important for identifying prevention and intervention points specific to minoritized older adults. In conclusion, distinct patterns of psychosocial variables can be identified within racially/ethnically minoritized older adults, and these clusters show varied cognitive and AD biomarker profiles. The identification of psychosocial phenotypes within large samples of racially/ethnically minoritized older adults is crucial to the development of targeted prevention and intervention efforts rooted in health equity.
CONFLICTS OF INTEREST STATEMENTS
The authors have no conflicts of interest to report. Author conflict of interest disclosures are available in the supporting information.
CONSENT STATEMENT
Informed consent was not necessary for this study.
Supporting information
Supporting Information
Supporting Information
ACKNOWLEDGMENTS
The authors thank all the HABS‐HD participants and study staff for their commitment to advancing representative aging research and for publicly sharing these data with other researchers. Research reported in this publication was supported by the National Institute on Aging (NIA) of the National Institutes of Health (NIH) under Awards R01AG054073 and R01AG058533. The consent is the sole responsibility of the authors and does not necessarily represent the official views of the NIH. Dr. Clark received support from the HABS‐HD Faculty Fellowship (U19AG078109), NIH/NIA (R03 AG085241), Shiley‐Marcos Alzheimer's Disease Research Education Center Grant (P30AG062429), and the Alzheimer's Association (AARG‐22‐723000). Dr. Thomas was supported by the U.S. Department of Veterans Affairs Clinical Sciences Research and Development Service (1IK2CX001865), NIH/NIA grants (R03 AG070435), and the Alzheimer's Association (AARG‐22‐723000). Research reported in this publication was also supported by NIA awards (R01AG054073, R01AG058533, P41EB015922, and U19AG078109).
Clark AL, Thomas KR, Ortega N, Haley AP, Duarte A, O'Bryant S. Empirically derived psychosocial‐behavioral phenotypes in Black/African American and Hispanic/Latino older adults enrolled in HABS‐HD: Associations with AD biomarkers and cognitive outcomes. Alzheimer's Dement. 2024;20:1360–1373. 10.1002/alz.13544
DATA AVAILABILITY STATEMENT
Data used in preparation of this article were obtained from the HABS‐HD database (https://apps.unthsc.edu/itr/researchers). HABS‐HD MPIs include Sid E. O'Bryant, Kristine Yaffe, Arthur Toga, Robert Rissman, and Leigh Johnson and the HABS‐HD investigators Meredith Braskie, Kevin King, James R. Hall, Melissa Petersen, Raymond Parlmer, Robert Barber, Yonggang Shi, Fan Zhang, Rajesh Nandy, Roderick McColl, Monica Rivera Mindt, Amrita Cheema, Lisa Barnes, Mark Mapstone, Annie Cohen, Amy Kind, Ozioma Okonkwo, Raul Vintimilla, Zhengyang Zhou, Michael Donohue, Rema Raman, Matthew Borzage, Michelle Miekle, Beau Ances, Ganesh Babulal, Jorge Llibre‐Guerra, Carl Hill, and Rocky Vig. The consent is solely the responsibility of the authors and does not necessarily represent the official views of the National Institutes of Health.
REFERENCES
- 1. Barnes LL, Bennett DA. Alzheimer's disease in African Americans: risk factors and challenges for the future. Health Aff (Millwood). 2014;33:580‐586. doi: 10.1377/hlthaff.2013.1353 [DOI] [PMC free article] [PubMed] [Google Scholar]
- 2. Thomas Tobin CS, Gutiérrez Á, Farmer HR, Erving CL, Hargrove TW. Intersectional approaches to minority aging research. Curr Epidemiol Rep. 2023;10:33‐43. doi: 10.1007/s40471-022-00317-5 [DOI] [PMC free article] [PubMed] [Google Scholar]
- 3. Canevelli M, Bruno G, Grande G, et al. Race reporting and disparities in clinical trials on Alzheimer's disease: a systematic review. Neurosci Biobehav Rev. 2019;101:122‐128. doi: 10.1016/j.neubiorev.2019.03.020 [DOI] [PubMed] [Google Scholar]
- 4. Babulal GM, Quiroz YT, Albensi BC, et al. Perspectives on ethnic and racial disparities in Alzheimer's disease and related dementias: update and areas of immediate need. Alzheimer's Dementia. 2019;15:292‐312. doi: 10.1016/j.jalz.2018.09.009 [DOI] [PMC free article] [PubMed] [Google Scholar]
- 5. Barnes LL. Alzheimer disease in African American individuals: increased incidence or not enough data? Nat Rev Neurol. 2022;18:56‐62. doi: 10.1038/s41582-021-00589-3 [DOI] [PMC free article] [PubMed] [Google Scholar]
- 6. Filshtein TJ, Dugger BN, Jin L‐W, et al. Neuropathological diagnoses of demented hispanic, black, and non‐hispanic white decedents seen at an Alzheimer's disease center. JAD. 2019;68:145‐158. doi: 10.3233/JAD-180992 [DOI] [PMC free article] [PubMed] [Google Scholar]
- 7. Hill CV, Pérez‐Stable EJ, Anderson NA, Bernard MA. The national institute on aging health disparities research framework. Ethn Dis. 2015;25:245‐254. 10.18865/ed.25.3.245 [DOI] [PMC free article] [PubMed] [Google Scholar]
- 8. Alvidrez J, Castille D, Laude‐Sharp M, Rosario A, Tabor D. The national institute on minority health and health disparities research framework. Am J Public Health. 2019;109:S16‐S20. doi: 10.2105/AJPH.2018.304883 [DOI] [PMC free article] [PubMed] [Google Scholar]
- 9. Glymour MM, Manly JJ. Lifecourse social conditions and racial and ethnic patterns of cognitive aging. Neuropsychol Rev. 2008;18:223‐254. doi: 10.1007/s11065-008-9064-z [DOI] [PubMed] [Google Scholar]
- 10. Yearby R. Structural racism and health disparities: reconfiguring the social determinants of health framework to include the root cause. J Law Med Ethics. 2020;48:518‐526. doi: 10.1177/1073110520958876 [DOI] [PubMed] [Google Scholar]
- 11. Zahodne LB. Biopsychosocial pathways in dementia inequalities: introduction to the michigan cognitive aging project. Am Psychol. 2021;76:1470‐1481. doi: 10.1037/amp0000936 [DOI] [PMC free article] [PubMed] [Google Scholar]
- 12. Adkins‐Jackson PB, Chantarat T, Bailey ZD, Ponce NA. Measuring structural racism: a guide for epidemiologists and other health researchers. Am J Epidemiol. 2022;191:539‐547. doi: 10.1093/aje/kwab239 [DOI] [PMC free article] [PubMed] [Google Scholar]
- 13. Zhang Z, Hayward MD, Yu Y‐L. Life course pathways to racial disparities in cognitive impairment among older Americans. J Health Soc Behav. 2016;57:184‐199. doi: 10.1177/0022146516645925 [DOI] [PMC free article] [PubMed] [Google Scholar]
- 14. Camacho A, Tarraf W, Jimenez DE, et al. Anxious depression and neurocognition among middle‐aged and older Hispanic/Latino adults: hispanic community health study/study of latinos (HCHS/SOL) results. Am J Geriatr Psychiatry. 2018;26:238‐249. doi: 10.1016/j.jagp.2017.06.002 [DOI] [PMC free article] [PubMed] [Google Scholar]
- 15. Clay OJ, Ball KK, Wheeler KM, et al. Evaluating social determinants of health domains and their predictive validity within black/African American and white older adults from the active trial. J Aging Health. 2022:08982643221111205. doi: 10.1177/08982643221111205 [DOI] [PMC free article] [PubMed] [Google Scholar]
- 16. Kaup AR, Byers AL, Falvey C, et al. Trajectories of depressive symptoms in older adults and risk of dementia. JAMA Psychiatry. 2016;73:525‐531. doi: 10.1001/jamapsychiatry.2016.0004 [DOI] [PMC free article] [PubMed] [Google Scholar]
- 17. Meyer OL, Besser L, Mitsova D, et al. Neighborhood racial/ethnic segregation and cognitive decline in older adults. Soc Sci Med. 2021;284:114226. doi: 10.1016/j.socscimed.2021.114226 [DOI] [PMC free article] [PubMed] [Google Scholar]
- 18. Gilsanz P, Quesenberry CP, Mayeda ER, Glymour MM, Farias ST, Whitmer RA. Stressors in midlife and risk of dementia: the role of race and education. Alzheimer Dis Assoc Disord. 2019;33:200‐205. doi: 10.1097/WAD.0000000000000313 [DOI] [PMC free article] [PubMed] [Google Scholar]
- 19. Dover DC, Belon AP. The health equity measurement framework: a comprehensive model to measure social inequities in health. Int J Equity Health. 2019;18:36. doi: 10.1186/s12939-019-0935-0 [DOI] [PMC free article] [PubMed] [Google Scholar]
- 20. Edmonds EC, Smirnov DS, Thomas KR, et al. Data‐driven vs consensus diagnosis of MCI: enhanced sensitivity for detection of clinical, biomarker, and neuropathologic outcomes. Neurology. 2021;97:e1288‐e1299. doi: 10.1212/WNL.0000000000012600 [DOI] [PMC free article] [PubMed] [Google Scholar]
- 21. Gamberger D, Lavrač N, Srivatsa S, Tanzi RE, Doraiswamy PM. Identification of clusters of rapid and slow decliners among subjects at risk for Alzheimer's disease. Sci Rep. 2017;7:6763. doi: 10.1038/s41598-017-06624-y [DOI] [PMC free article] [PubMed] [Google Scholar]
- 22. Nettiksimmons J, DeCarli C, Landau S, Beckett L. Alzheimer's disease neuroimaging initiative biological heterogeneity in ADNI amnestic mild cognitive impairment. Alzheimers Dement. 2014;10:511‐521.e1. doi: 10.1016/j.jalz.2013.09.003 [DOI] [PMC free article] [PubMed] [Google Scholar]
- 23. Thomas KR, Bangen KJ, Weigand AJ, et al. Cognitive heterogeneity and risk of progression in data‐driven subtle cognitive decline phenotypes. J Alzheimers Dis. 2022;90:323‐331. doi: 10.3233/JAD-220684 [DOI] [PMC free article] [PubMed] [Google Scholar]
- 24. Yokoyama JS, Bonham LW, Sears RL, et al. Decision tree analysis of genetic risk for clinically heterogeneous Alzheimer's disease. BMC Neurol. 2015;15:47. doi: 10.1186/s12883-015-0304-6 [DOI] [PMC free article] [PubMed] [Google Scholar]
- 25. Eavani H, Habes M, Satterthwaite TD, et al. Heterogeneity of structural and functional imaging patterns of advanced brain aging revealed via machine learning methods. Neurobiol Aging. 2018;71:41‐50. doi: 10.1016/j.neurobiolaging.2018.06.013 [DOI] [PMC free article] [PubMed] [Google Scholar]
- 26. Khoury MJ, Iademarco MF, Riley WT. Precision public health for the era of precision medicine. Am J Prev Med. 2016;50:398‐401. doi: 10.1016/j.amepre.2015.08.031 [DOI] [PMC free article] [PubMed] [Google Scholar]
- 27. Prosperi M, Min JS, Bian J, Modave F. Big data hurdles in precision medicine and precision public health. BMC Med Inform Decis Mak. 2018;18:139. doi: 10.1186/s12911-018-0719-2 [DOI] [PMC free article] [PubMed] [Google Scholar]
- 28. Ramaswami R, Bayer R, Galea S. Precision medicine from a public health perspective. Annu Rev Public Health. 2018;39:153‐168. doi: 10.1146/annurev-publhealth-040617-014158 [DOI] [PubMed] [Google Scholar]
- 29. Siew SKH, Yu J, Kua EH, Mahendran R. Psychosocial profiles within community‐dwelling older adults with mild cognitive impairment: a prevalence and latent profile analysis study. Asian J Psych. 2023;82:103503. doi: 10.1016/j.ajp.2023.103503 [DOI] [PubMed] [Google Scholar]
- 30. Lamar M, Barnes LL, Leurgans SE, et al. Acculturation in context: the relationship between acculturation and socioenvironmental factors with level of and change in cognition in older Latinos. J Gerontol Ser B. 2021;76:e129‐e139. doi: 10.1093/geronb/gbaa156 [DOI] [PMC free article] [PubMed] [Google Scholar]
- 31. Borella E, Ghisletta P, Carbone E, Aichele S. The current and retrospective cognitive reserve (2CR) survey and its relationship with cognitive and mood measures. Eur J Ageing. 2023;20:23. doi: 10.1007/s10433-023-00766-x [DOI] [PMC free article] [PubMed] [Google Scholar]
- 32. Poudel GR, Barnett A, Akram M, et al. Machine learning for prediction of cognitive health in adults using sociodemographic, neighbourhood environmental, and lifestyle factors. Int J Environ Res Public Health. 2022;19:10977. doi: 10.3390/ijerph191710977 [DOI] [PMC free article] [PubMed] [Google Scholar]
- 33. Dingle SE, Bowe SJ, Bujtor M, et al. Associations between data‐driven lifestyle profiles and cognitive function in the ausdiab study. BMC Public Health. 2022;22:1990. doi: 10.1186/s12889-022-14379-z [DOI] [PMC free article] [PubMed] [Google Scholar]
- 34. Guo M, Wang Y, Carter K. Racial/ethnic and nativity differences in adversity profiles among middle‐aged and older adults. Aging Ment Health. 2023:1‐10. doi: 10.1080/13607863.2023.2251421 [DOI] [PubMed] [Google Scholar]
- 35. Guo Y, Chan KST, Chan CH, Chang Q, Lee RS, Yip PSF. Combined effects of individual and neighbourhood socioeconomic status on older adults’ mortality: a retrospective follow‐up study in Hong Kong. BMJ Open. 2021;11:e043192. doi: 10.1136/bmjopen-2020-043192 [DOI] [PMC free article] [PubMed] [Google Scholar]
- 36. O'Bryant SE, Johnson LA, Barber RC, et al. The health & aging brain among latino elders (HABLE) study methods and participant characteristics. Alzheimers Dement (Amst). 2021;13:e12202. doi: 10.1002/dad2.12202 [DOI] [PMC free article] [PubMed] [Google Scholar]
- 37. American Psychiatric Association Diagnostic and Statistical Manual of Mental Health Disorders; 5th ed. 2013; ISBN ISBN 978‐0‐89042‐554‐1.
- 38. González HM, Mungas D, Haan MN. A verbal learning and memory test for english‐ and spanish‐speaking older mexican‐american adults. Clin Neuropsychol. 2002;16:439‐451. doi: 10.1076/clin.16.4.439.13908 [DOI] [PubMed] [Google Scholar]
- 39. The Psychological Corporation . WAIS–III WMS–III Technical Manual. 1997. [Google Scholar]
- 40. Lezak MD. Neuropsychological assessment. Oxford University Press; 2004. ISBN 978‐0‐19‐511121‐7. [Google Scholar]
- 41. Youn JC, Kim KW, Lee DY, et al. Development of the subjective memory complaints questionnaire. Dement Geriatr Cogn Disord. 2009;27:310‐317. doi: 10.1159/000205512 [DOI] [PubMed] [Google Scholar]
- 42. Jonaitis E, La Rue A, Mueller K, Koscik R, Hermann B, Sager MA. Cognitive activities and cognitive performance in middle‐aged adults at risk for Alzheimer's disease. Psychol Aging. 2013;28:1004‐1014. doi: 10.1037/a0034838 [DOI] [PMC free article] [PubMed] [Google Scholar]
- 43. Roos P, Treiman D. Work, jobs, and occupations: a critical review of the dictionary of occupational titles. National Academies Press; 1980:92. ISBN 978‐0‐309‐03093‐9. [Google Scholar]
- 44. Smart EL, Gow AJ, Deary IJ. Occupational complexity and lifetime cognitive abilities. Neurology. 2014;83:2285‐2291. doi: 10.1212/WNL.0000000000001075 [DOI] [PMC free article] [PubMed] [Google Scholar]
- 45. Cohen S, Mermelstein R, Kamarck T, Hoberman HM. Measuring the functional components of social support. In: Sarason IG, Sarason BR, eds. Social support: theory, research and applications. Springer Netherlands; 1985:73‐94. ISBN 978‐94‐010‐8761‐2. [Google Scholar]
- 46. Meyer TJ, Miller ML, Metzger RL, Borkovec TD. Development and validation of the penn state worry questionnaire. Behav Res Ther. 1990;28:487‐495. doi: 10.1016/0005-7967(90)90135-6 [DOI] [PubMed] [Google Scholar]
- 47. Yesavage JA. Geriatric depression scale. In Psychopharmacology Bulletin. 1988;24:709‐711. [PubMed] [Google Scholar]
- 48. Bromberger JT, Matthews KA. A longitudinal study of the effects of pessimism, trait anxiety, and life stress on depressive symptoms in middle‐aged women. Psychol Aging. 1996;11:207‐213. doi: 10.1037/0882-7974.11.2.207 [DOI] [PubMed] [Google Scholar]
- 49. Chen T‐B, Lee Y‐J, Lin S‐Y, et al. Plasma Aβ42 and total tau predict cognitive decline in amnestic mild cognitive impairment. Sci Rep. 2019;9:13984. doi: 10.1038/s41598-019-50315-9 [DOI] [PMC free article] [PubMed] [Google Scholar]
- 50. O'Bryant S, Petersen M, Hall J, et al. Characterizing plasma NfL in a community‐dwelling multi‐ethnic cohort: results from the HABLE study. Alzheimers Dement. 2022;18:240‐250. doi: 10.1002/alz.12404 [DOI] [PMC free article] [PubMed] [Google Scholar]
- 51. West T, Kirmess KM, Meyer MR, et al. A blood‐based diagnostic test incorporating plasma Aβ42/40 ratio, ApoE proteotype, and age accurately identifies brain amyloid status: findings from a multi cohort validity analysis. Molecular Neurodegeneration. 2021;16:30. doi: 10.1186/s13024-021-00451-6 [DOI] [PMC free article] [PubMed] [Google Scholar]
- 52. Eckel RH, Alberti K, Grundy SM, Zimmet PZ, The metabolic syndrome. Lancet 2010;375:3. [DOI] [PubMed] [Google Scholar]
- 53. Ward JH. Hierarchical grouping to optimize an objective function. J Am Statist Assoc. 1963;58:236‐244. doi: 10.1080/01621459.1963.10500845 [DOI] [Google Scholar]
- 54. Edmonds EC, Delano‐Wood L, Clark LR, et al. Susceptibility of the conventional criteria for mild cognitive impairment to false‐positive diagnostic errors. Alzheimer's Dementia. 2015;11:415‐424. doi: 10.1016/j.jalz.2014.03.005 [DOI] [PMC free article] [PubMed] [Google Scholar]
- 55. Hampel H, O'Bryant SE, Castrillo JI, et al. PRECISION MEDICINE—the golden gate for detection, treatment and prevention of Alzheimer's disease. J Prev Alzheimers Dis. 2016;3:243‐259. 10.14283/jpad.2016.112 [DOI] [PMC free article] [PubMed] [Google Scholar]
- 56. Li Z, Jiang X, Wang Y, Kim Y. Applied machine learning in Alzheimer's disease research: omics, imaging, and clinical data. Emerg Top Life Sci. 2021;5:765‐777. doi: 10.1042/ETLS20210249 [DOI] [PMC free article] [PubMed] [Google Scholar]
- 57. Insel PS, Donohue MC, Sperling R, Hansson O, Mattsson‐Carlgren N. The A4 study: β‐Amyloid and cognition in 4432 cognitively unimpaired adults. Ann Clin Transl Neurol. 2020;7:776‐785. doi: 10.1002/acn3.51048 [DOI] [PMC free article] [PubMed] [Google Scholar]
- 58. Jack CR, Bennett DA, Blennow K, et al. NIA‐AA research framework: toward a biological definition of Alzheimer's disease. Alzheimers Dement. 2018;14:535‐562. doi: 10.1016/j.jalz.2018.02.018 [DOI] [PMC free article] [PubMed] [Google Scholar]
- 59. O'Bryant SE, Zhang F, Petersen M, et al. A blood screening tool for detecting mild cognitive impairment and Alzheimer's disease among community‐dwelling Mexican Americans and non‐hispanic whites: a method for increasing representation of diverse populations in clinical research. Alzheimers Dement. 2022;18:77‐87. doi: 10.1002/alz.12382 [DOI] [PMC free article] [PubMed] [Google Scholar]
- 60. Chin AL, Negash S, Hamilton R. Diversity and disparity in dementia: the impact of ethnoracial differences in Alzheimer disease. Alzheimer Dis Assoc Disord . 2011;25:187‐195. doi: 10.1097/WAD.0b013e318211c6c9 [DOI] [PMC free article] [PubMed] [Google Scholar]
- 61. Lamar M, Glover CM, Capuano AW, et al. Stability and change in acculturation‐related characteristics in older latinos: implications for culturally compatible ADRD research. A&D Transl Res & Clin Interv. 2023;9:e12380. doi: 10.1002/trc2.12380 [DOI] [PMC free article] [PubMed] [Google Scholar]
- 62. Rotblatt LJ, Aiken‐Morgan AT, Marsiske M, Horgas AL, Thomas KR. Do associations between vascular risk and mild cognitive impairment vary by race? J Aging Health. 2021:898264320984357. doi: 10.1177/0898264320984357 [DOI] [PMC free article] [PubMed] [Google Scholar]
- 63. Garrett SL, Kennedy RE, Sawyer P, Williams CP, Brown CJ, Allman RM. Association between executive dysfunction and instrumental activities of daily living: racial and ethnic differences among community‐dwelling older adults in the southeastern US. J Natl Med Assoc. 2019;111:320‐327. doi: 10.1016/j.jnma.2018.11.002 [DOI] [PMC free article] [PubMed] [Google Scholar]
- 64. Dotson VM, Szymkowicz SM, Kim JU, McClintock SM. Cognitive functioning in late‐life depression: a critical review of sociodemographic, neurobiological, and treatment correlates. Curr Behav Neurosci Rep. 2018;5:310‐318. doi: 10.1007/s40473-018-0159-4 [DOI] [Google Scholar]
- 65. O'Bryant SE, Petersen M, Hall J, Johnson LA. Depression is differentially related to cognitive and biomarker outcomes among Mexican Americans. Front Psychiatry. 2022;13:901403. doi: 10.3389/fpsyt.2022.901403 [DOI] [PMC free article] [PubMed] [Google Scholar]
- 66. Grober E, Hall CB, Hahn SR, Lipton RB. Memory impairment and executive dysfunction are associated with inadequately controlled diabetes in older adults. J Prim Care Community Health. 2011;2:229‐233. doi: 10.1177/2150131911409945 [DOI] [PMC free article] [PubMed] [Google Scholar]
- 67. Crumley JJ, Stetler CA, Horhota M. Examining the relationship between subjective and objective memory performance in older adults: a meta‐analysis. Psychol Aging. 2014;29:250‐263. doi: 10.1037/a0035908 [DOI] [PubMed] [Google Scholar]
- 68. Parisi JM, Sharifian N, Rebok GW, Aiken‐Morgan AT, Gross AL, Zahodne LB. Subjective memory, objective memory, and race over a 10‐year period: findings from the ACTIVE study. Psychol Aging. 2021;36:572‐583. doi: 10.1037/pag0000622 [DOI] [PMC free article] [PubMed] [Google Scholar]
- 69. Jackson JD, Rentz DM, Aghjayan SL, et al. Subjective cognitive concerns are associated with objective memory performance in caucasian but not African‐American persons. Age Ageing. 2017;46:988‐993. doi: 10.1093/ageing/afx077 [DOI] [PMC free article] [PubMed] [Google Scholar]
- 70. Pluim CF, Anzai JAU, Martinez JE, et al. Associations among loneliness, purpose in life and subjective cognitive decline in ethnoracially diverse older adults living in the United States. J Appl Gerontol. 2023;42:376‐386. doi: 10.1177/07334648221139479 [DOI] [PMC free article] [PubMed] [Google Scholar]
- 71. Dotson VM, Resnick SM, Zonderman AB. Differential association of concurrent, baseline, and average depressive symptoms with cognitive decline in older adults. Am J Geriatr Psychiatry. 2008;16:318‐330. doi: 10.1097/JGP.0b013e3181662a9c [DOI] [PMC free article] [PubMed] [Google Scholar]
- 72. Dotson VM, Davatzikos C, Kraut MA, Resnick SM. Depressive symptoms and brain volumes in older adults: a longitudinal magnetic resonance imaging study. J Psychiatry Neurosci. 2009;34:367‐375. [PMC free article] [PubMed] [Google Scholar]
- 73. Wilson RS, Begeny CT, Boyle PA, Schneider JA, Bennett DA. Vulnerability to stress, anxiety, and development of dementia in old age. Am J Geriatr Psychiatry. 2011;19:327‐334. doi: 10.1097/JGP.0b013e31820119da [DOI] [PMC free article] [PubMed] [Google Scholar]
- 74. Giacomucci G, Mazzeo S, Bagnoli S, et al. Plasma neurofilament light chain as a biomarker of Alzheimer's disease in subjective cognitive decline and mild cognitive impairment. J Neurol. 2022;269:4270‐4280. doi: 10.1007/s00415-022-11055-5 [DOI] [PMC free article] [PubMed] [Google Scholar]
- 75. Hu H, Chen K‐L, Ou Y‐N, et al. Neurofilament light chain plasma concentration predicts neurodegeneration and clinical progression in nondemented elderly adults. Aging. 2019;11:6904‐6914. 10.18632/aging.102220 [DOI] [PMC free article] [PubMed] [Google Scholar]
- 76. Khalil M, Teunissen CE, Otto M, et al. Neurofilaments as biomarkers in neurological disorders. Nat Rev Neurol. 2018;14:577‐589. doi: 10.1038/s41582-018-0058-z [DOI] [PubMed] [Google Scholar]
- 77. Milà‐Alomà M, Ashton NJ, Shekari M, et al. Plasma P‐Tau231 and p‐Tau217 as state markers of amyloid‐β pathology in preclinical Alzheimer's disease. Nat Med. 2022. doi: 10.1038/s41591-022-01925-w [DOI] [PMC free article] [PubMed] [Google Scholar]
- 78. Pais MV, Forlenza OV, Diniz BS. Plasma biomarkers of Alzheimer's disease: a review of available assays, recent developments, and implications for clinical practice. ADR. 2023;7:355‐380. doi: 10.3233/ADR-230029 [DOI] [PMC free article] [PubMed] [Google Scholar]
- 79. Benedet AL, Brum WS, Hansson O, et al, Alzheimer's Disease Neuroimaging Initiative . The accuracy and robustness of plasma biomarker models for amyloid PET positivity. Alz Res Therapy. 2022;14:26. doi: 10.1186/s13195-021-00942-0 [DOI] [PMC free article] [PubMed] [Google Scholar]
- 80. Kuiper JS, Zuidersma M, Zuidema SU. Social relationships and cognitive decline: a systematic review and meta‐analysis of longitudinal cohort studies. Int J Epidemiol. 2016;45:1169‐1206. doi: 10.1093/ije/dyw089 [DOI] [PubMed] [Google Scholar]
- 81. Zahodne LB. Psychosocial protective factors in cognitive aging: a targeted review. Arch Clin Neuropsychol. 2021;36:1266‐1273. doi: 10.1093/arclin/acab051 [DOI] [PMC free article] [PubMed] [Google Scholar]
- 82. Lara E, Caballero FF, Rico‐Uribe LA, et al. Are loneliness and social isolation associated with cognitive decline? Int J Geriatr Psychiatry. 2019;34:1613‐1622. doi: 10.1002/gps.5174 [DOI] [PubMed] [Google Scholar]
- 83. Petersen RC, Doody R, Kurz A, et al. Current concepts in mild cognitive impairment. Arch Neurol. 2001;58:1985. doi: 10.1001/archneur.58.12.1985 [DOI] [PubMed] [Google Scholar]
- 84. for the Alzheimer's Disease Neuroimaging Initiative ; Bondi MW, Edmonds EC, Jak AJ, et al, for the Alzheimer's Disease Neuroimaging Initiative . Neuropsychological criteria for mild cognitive impairment improves diagnostic precision, biomarker associations, and progression rates. JAD. 2014;42:275‐289. doi: 10.3233/JAD-140276 [DOI] [PMC free article] [PubMed] [Google Scholar]
- 85. Wong CG, Thomas KR, Edmonds EC, et al. Neuropsychological criteria for mild cognitive impairment in the framingham heart study's old‐old. Dement Geriatr Cogn Disord. 2018;46:253‐265. doi: 10.1159/000493541 [DOI] [PMC free article] [PubMed] [Google Scholar]
- 86. Graves LV, Edmonds EC, Thomas KR, Weigand AJ, Cooper S, Bondi MW. Evidence for the utility of actuarial neuropsychological criteria across the continuum of normal aging, mild cognitive impairment, and dementia. JAD. 2020;78:371‐386. doi: 10.3233/JAD-200778 [DOI] [PMC free article] [PubMed] [Google Scholar]
Associated Data
This section collects any data citations, data availability statements, or supplementary materials included in this article.
Supplementary Materials
Supporting Information
Supporting Information
Data Availability Statement
This study leveraged data from Health and Aging Brain Study‐Health Disparities (HABS‐HD), 36 a large‐scale research study centered on understanding key drivers of racial/ethnic disparities in AD. HABS‐HD data are publicly available to qualified researchers upon request and were previously described in detail. 36 Participants in the study complete comprehensive neuropsychological testing, medical clinical labs, brain magnetic resonance imaging (MRI) scans, positron emission tomography (PET) scans (amyloid and tau), questionnaires, and functional exams. Participants enrolled in the HABS‐HD study could complete the entire protocol in Spanish or English in accordance with their preferred language. Written informed consent was obtained for all study participants, and HABS‐HD was approved by the University of North Texas Health Science Center Institutional Review Board.
Data used in preparation of this article were obtained from the HABS‐HD database (https://apps.unthsc.edu/itr/researchers). HABS‐HD MPIs include Sid E. O'Bryant, Kristine Yaffe, Arthur Toga, Robert Rissman, and Leigh Johnson and the HABS‐HD investigators Meredith Braskie, Kevin King, James R. Hall, Melissa Petersen, Raymond Parlmer, Robert Barber, Yonggang Shi, Fan Zhang, Rajesh Nandy, Roderick McColl, Monica Rivera Mindt, Amrita Cheema, Lisa Barnes, Mark Mapstone, Annie Cohen, Amy Kind, Ozioma Okonkwo, Raul Vintimilla, Zhengyang Zhou, Michael Donohue, Rema Raman, Matthew Borzage, Michelle Miekle, Beau Ances, Ganesh Babulal, Jorge Llibre‐Guerra, Carl Hill, and Rocky Vig. The consent is solely the responsibility of the authors and does not necessarily represent the official views of the National Institutes of Health.