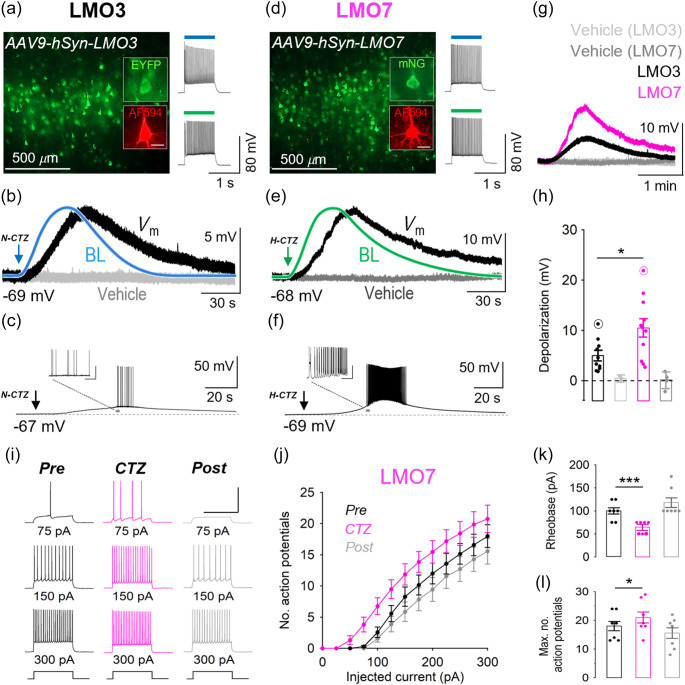
Fig. 3.
Comparison of LMO3 and LMO7 in acute mouse brain slices. (a) LMO3 expression in L5 neocortical neurons from fronto-parietal coronal slices (insets show a pipette-filled pyramidal cell visualized with AlexaFluor 594 and the EYFP tag post hoc). Right, firing response of the cell in response to 480 and 540 nm excitation. (b) Example trace showing the membrane potential response of the cell in to N-CTZ (black trace, Vm) normalized to the recorded peak bioluminescence (blue, BL) and relative to control (vehicle, light gray trace). (c) Example trace showing a suprathreshold Vm response recorded from an LMO3-expressing L5 pyramidal neuron to CTZ. (d) LMO7 expression in L5 neocortical neurons from fronto-parietal coronal slices (insets show a pipette-filled pyramidal cell visualized with AlexaFluor 594 and mNeonGreen post hoc). Right, firing response of the cell in response to 480 and 540 nm excitation. (e) Example trace showing the membrane potential response of the cell in to H-CTZ (black trace, Vm) normalized to the recorded peak bioluminescence (green, BL) and relative to control (vehicle, dark gray trace). (f) Example trace showing a suprathreshold Vm response recorded from an LMO7-expressing L5 pyramidal neuron to CTZ. (g) Representative example traces of CTZ-induced depolarization amplitude in LMO3 and LMO7-expressing cells relative to controls. (h) Summary graph showing the average CTZ-induced depolarization (circled data points represent recordings in c and f). (i)–(l) Effect of H-CTZ on the input-output function of LMO7-expressing L5 pyramidal neurons. (i) Example traces showing effect of CTZ on firing rate at indicated levels of square current injection. (j) Summary graph showing the frequency-current response of LMO7-expressing cells pre, during-, and post CTZ application. (k), (l) Summary bar graphs showing effect of CTZ on rheobase (k) and maximum number of action potentials (l) in LMO7-expressing L5 pyramidal neurons. Scale bars (insets a, d): . Data are presented as mean ± SEM. * , *** .

