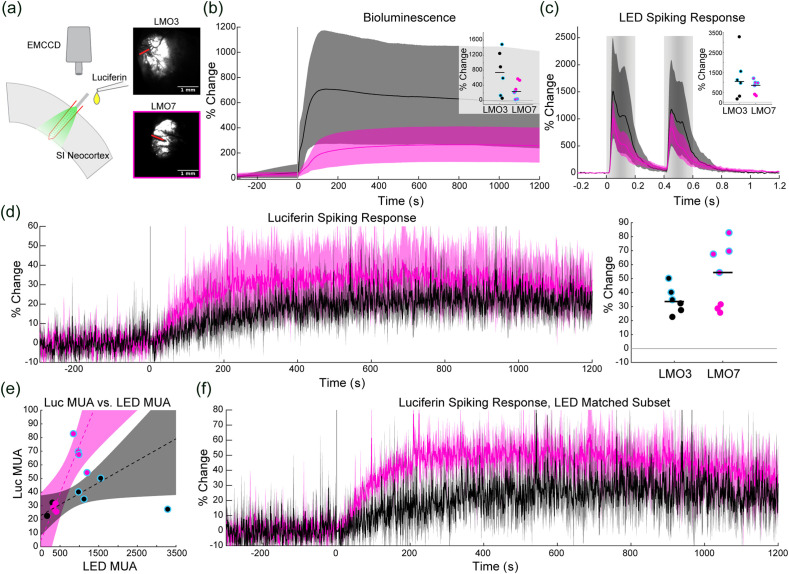
Fig. 4.
In vivo comparison of LMO3 and LMO7 (black and magenta throughout, respectively). (a) Schematic of the in vivo experimental setup. The laminar probe was inserted perpendicularly to the primary somatosensory cortex. A fiber attached to the electrode delivered light stimuli. The luciferin (native or H-CTZ) was infused over the top of the cortex, and BL light output was recorded using an EMCCD camera. Example images of bioluminescence for each group are depicted to the right of the schematic. The red lines indicate the location of the electrode in each instance. (b) Average BL light output for the two groups expressed as the percent change from baseline. Shaded error bars indicate the bootstrapped 95% confidence interval (same convention throughout). Inset: Dots are individual animal’s peak BL output, dots outlined in cyan are the LED response in matched animals, and horizontal black lines indicate the median for each group (same convention throughout). (c) Average MUA response to the external LED stimulus for each group. Light gray vertical bars indicate the timing of the LED pulses. Inset: Individual animal’s peak MUA response to the LED stimulus. (d) Left, the average MUA response to luciferin delivery for the two groups. The onset of the 60 s luciferin infusion began at time 0. Right, Individual animal’s peak MUA response. (e) The linear fit of animals’ LED evoked MUA to luciferin evoked MUA. (f) The average luciferin evoked MUA activity recorded in LED matched animal subsets.

