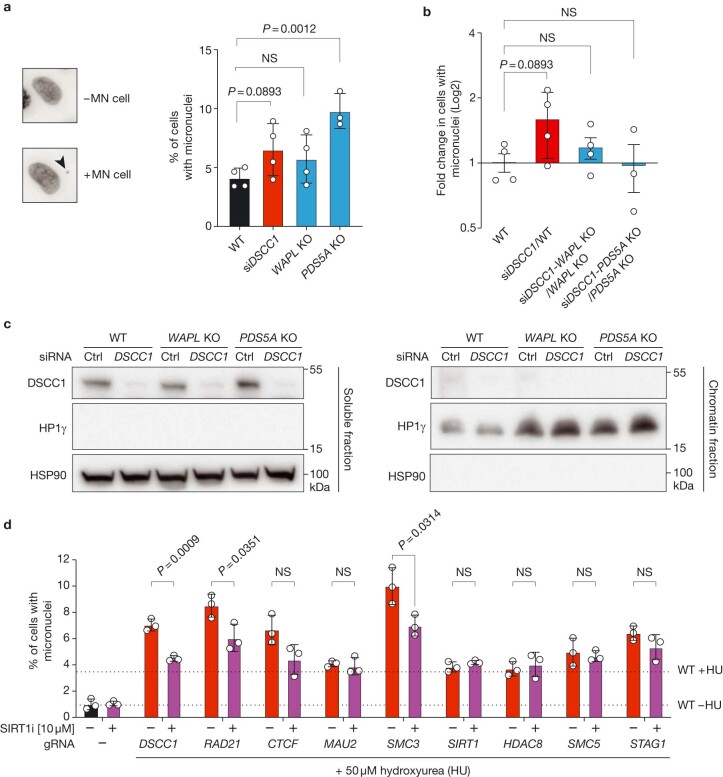
Extended Data Fig. 8. Validation of the DSCC1 suppressor CRISPR screen.
a, Quantification of the % of cells with micronuclei (MN) in HAP1 cells. Depletion of DSCC1 (siDSCC1) or PDS5A (KO), but not WAPL (KO), resulted in a significant increase in %MN. Each point on the graph represents and independent experiment where more than 50 cells were counted. Representative images are presented on the left hand side; arrow head points at DAPI positive MN. Significance was assessed using a two-tailed Student’s t-test. n = 3 biological replicates with n ≥ 50 cells counted each. Bars represent mean with s.d. b, Quantification of the fold-change in MN formation in siDSCC1/WT as compared to siDSCC1-WAPL KO and siDSCC1-PDS5A KO relative to WAPL KO and PDS5A KO alone, respectively (HAP1 background). Significance was assessed using a two-tailed Student’s t-test (NS, not significant; P > 0.05). n = 3 biological replicates with n ≥ 50 cells counted per replicate. Bars represent mean with s.d. c, Representative western blot images from soluble and chromatin fraction extracts from HAP1 cells depicting siRNA depletion of DSCC1. This experiment was repeated three times and the uncropped images are presented in Supplementary Fig. 2. d, Quantification of the effect of SIRT1 inhibition with Selisistat (EX 527; SIRT1i; 10 µM) on the MN formation when the cohesion-associated genes RAD21, CTCF, MAU2, SMC3, HDAC8, SMC5 and STAG1 were disrupted using CRISPR-Cas9 (see Methods) in RPE-1 cells. DSCC1 KO and SIRT1 KO were used as controls. To increase the dynamic range, MN were induced by a 3-day chronic treatment with 50 µM hydroxyurea (HU) (see HU titration for the different cell lines in Supplementary Table 7). Significance was assessed using Student’s two-tailed t-test (NS, not significant; P > 0.05). n = 3 biological replicates with n ≥ 50 cells per replicate counted. Bars represent mean with s.d.

