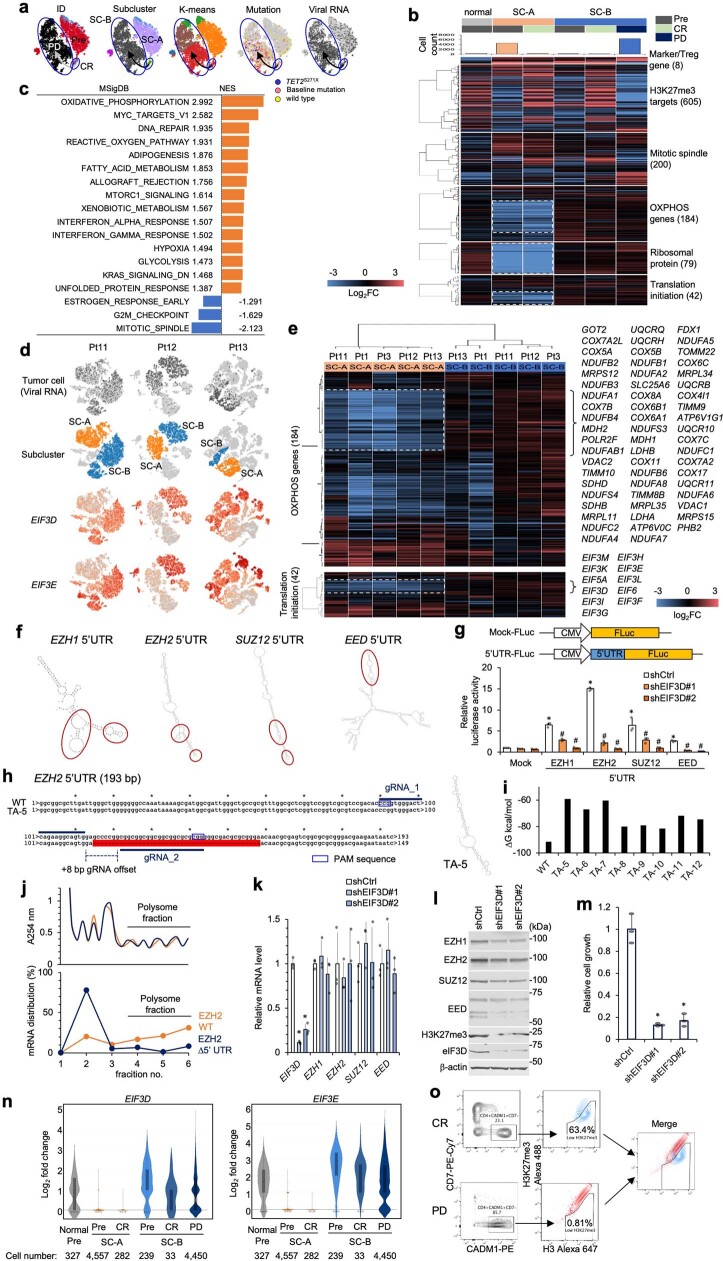
Extended Data Fig. 10. Intrinsic subpopulations and translational regulation of PRC2 genes.
a, t-SNE projection of scRNA-seq data in Pt3, with cells colored according to sample ID, sub-clustering based on clinical time order or K-means, and profiles of mutations and virus reads. b, Clustered heatmaps depict expression levels of genes involved in differentially enriched categories in subclusters SC-A and SC-B in Pt3. c, Hallmark GSEA of scRNA-seq data from Pt3 SC-B before valemetostat treatment compared with SC-A. For all pathways shown, significantly enriched gene sets were evaluated by normalized enrichment score (NES) and nominal P value (P < 0.001). d, t-SNE projection of scRNA-seq data in Pt11, Pt12, and Pt13, with cells colored according to subclusters, viral reads, and expression of EIF3D and EIF3E. e, Clustered heatmaps depict expression levels of genes involved in OXPHOS and translation initiation in subclusters SC-A and SC-B in ATL patients (n = 5). f, Secondary structures of 5′UTR of PRC2 factor genes. Red circles indicate representative stem-loop structures easily recognized by eIF3. g, Reporter-based 5′UTR activity screening. A series of 5′UTR -luciferase reporters was transfected in 293 T cells with or without shEIF3D shRNA vector. Relative values of dual-luciferase assay are presented. n = 3, independent experiments, mean ± SD. *, versus Mock, P < 0.05; #, versus shCtrl, P < 0.05. h, i, CRISPR-nickase (Cas9 D10A)-based deletion of endogenous EZH2 5′UTR. Representative EZH2 5′UTR sequence of an established clone (TA-5) and gRNA regions are illustrated (h). Estimated mfold free energies (ΔG kcal/mol) of established Δ5′UTR clones are shown by bar graph (i). j, Translation activity was evaluated by polysome analysis. The amount of mRNA in the ribosomal and polysomal fractions was quantified using sucrose density gradient centrifugation. Absorbance at 254 nM of collected fractions (upper) and EZH2 mRNA level (% distribution, lower) are shown (representative data, n = 2 biological replicates). k–m, Effect of eIF3D knockdown (KD) in TL-Om1 cells. The qRT-PCR (k) and immunoblotting (l) showed reduced expression of PRC2 genes and H3K27me3 at the protein level. The eIF3D KD cells showed reduced growth activity (m). n = 3 independent experiments, mean ± SD, * P < 0.05. n, Violin and box plots show scRNA-seq expression distribution of eIF3D and eIF3E genes in Pt3. o, H3K27me3 staining of PBMCs in Pt3 gated on CD4+/CADM1+/CD7− tumor cell populations at 16 weeks (CR) and 118 weeks (PD) post valemetostat treatment. The middle lines within box plots correspond to the medians; lower and upper hinges correspond to the first and third quartiles. The upper whisker extends from the hinge to the largest value no further than 1.5 * IQR. The lower whisker extends from the hinge to the smallest value at most 1.5 * IQR. Statistics and reproducibility are described in Methods. For gel source data, see Supplementary Fig. 1.

