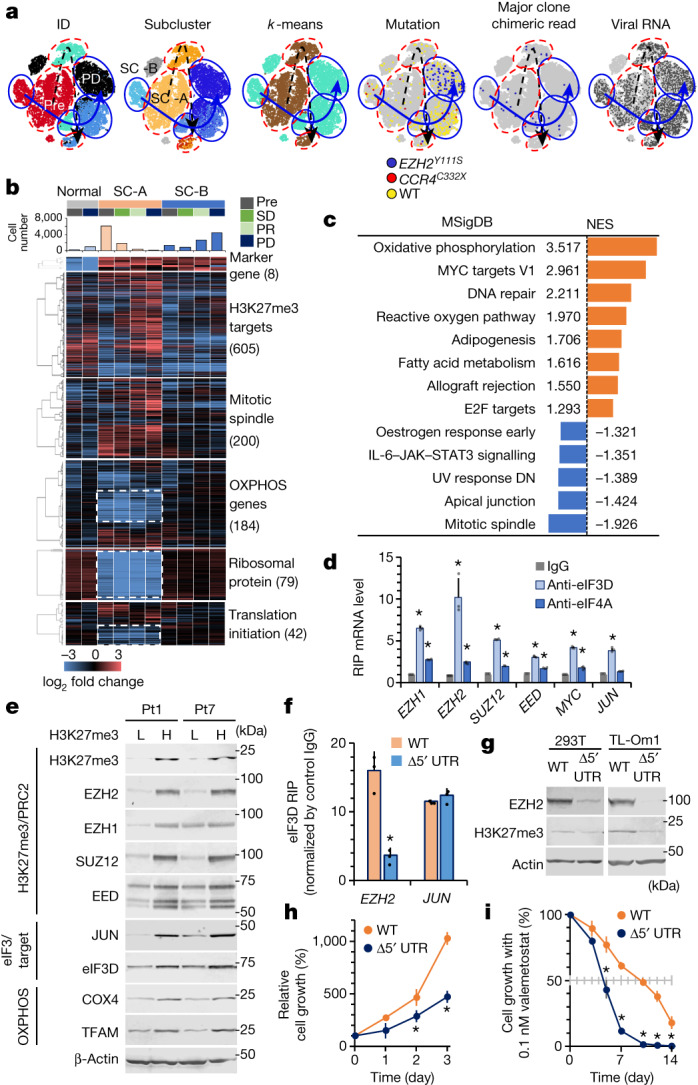
Fig. 5. Intrinsic subpopulations with differential susceptibility.

a, t-SNE projection of scRNA-seq data in Pt1, with cells coloured according to sample ID, subclustering based on clinical time order or k-means, and profiles of mutations and virus reads. Black dashed arrows indicate clinical time order of SC-A; blue solid arrows indicate clinical time order of SC-B. b, Clustered heat maps depict expression levels of genes involved in differentially enriched categories in subclusters SC-A and SC-B in Pt1. Genes highlighted by white dashed lines indicate genes significantly decreased in SC-A. SD, stable disease. c, Hallmark gene set enrichment analysis of scRNA-seq data from Pt1 SC-B before valemetostat treatment compared with SC-A. For all pathways shown, significantly enriched gene sets were evaluated by normalized enrichment score (NES) and nominal P value (P < 0.001). DN, down-regulated. d, RIP assay for PRC2 gene mRNA. eIF complexes were immunopurified from TL-Om1 cells using antibodies to eIF3D and eIF4A. eIF-associated mRNA was quantified by quantitative PCR. The graph shows the fold change in the enrichment relative to the control IgG. n = 3 independent experiments, mean ± s.d., *P < 0.05. e, Immunoblots show protein levels of H3K27me3, PRC2, eIF3D and OXPHOS mitochondrial factors in H3K27me3 higher (H) and lower (L) cells from Pt1 and Pt7 after valemetostat treatment. Electrophoresis experiments with independent patient samples were performed once. f, Quantification of eIF3D-bound PRC2 gene mRNA in 293T cells with EZH2 WT and EZH2 Δ5′ UTR by RIP assay. n = 3 independent experiments, mean ± s.d., *P = 0.00861. g, Protein levels of EZH2 and H3K27me3 in cells with EZH2 WT and EZH2 Δ5′ UTR. h, Relative cell growth rate (%) over time in TL-Om1 cells with EZH2 WT and EZH2 Δ5′ UTR. n = 3 independent experiments, mean ± s.d., *P < 0.05. i, Growth inhibition rate (%) over time by 0.1 nM valemetostat in TL-Om1 cells with EZH2 WT and EZH2 Δ5′ UTR. n = 3 independent experiments, mean ± s.d., *P < 0.05. Statistics and reproducibility are described in the Methods. For gel source data, see Supplementary Fig. 1.
