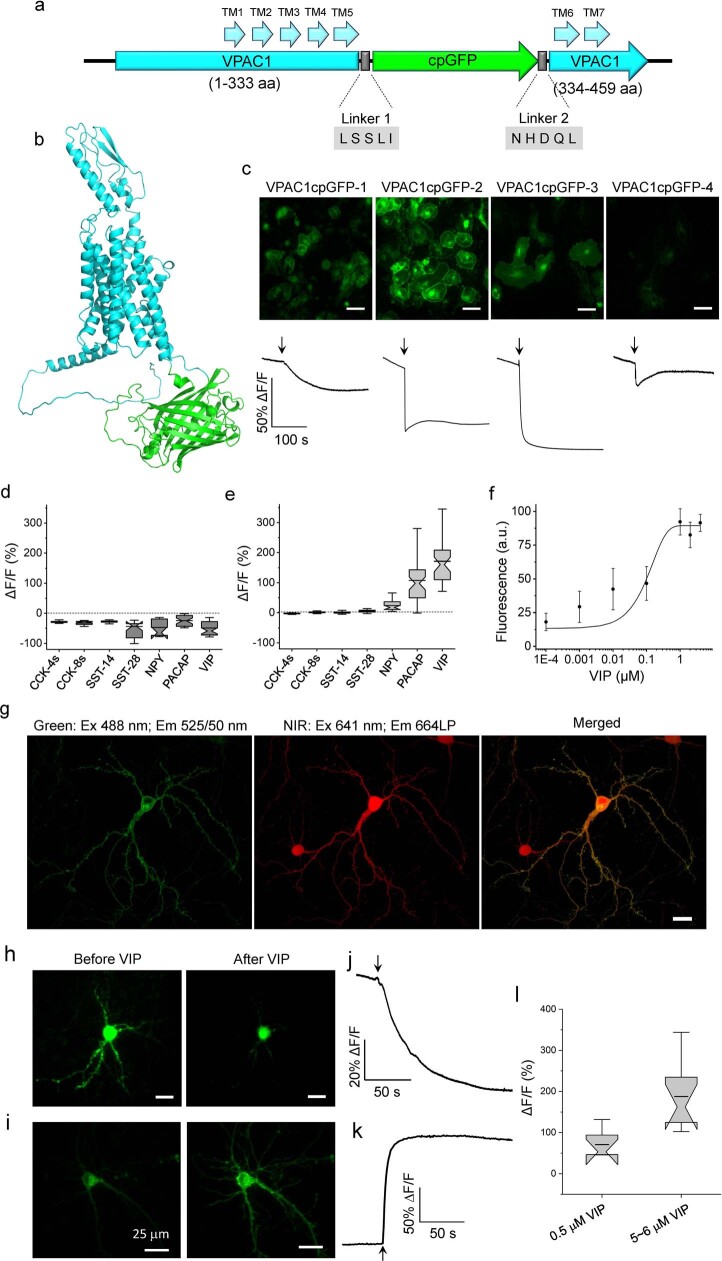
Extended Data Fig. 11. Development and validation of a genetically encoded sensor for vasoactive intestinal peptide (VIP).
a. Molecular design of VIP sensor used for in vivo recordings. b. Prediction of the VIP sensor 3D structure using Alphafold v2.1 (computed on Galaxy provided by High-performance computing center at Westlake University). c. Optimization VIP sensor in HeLa cells; (top) representative images of HeLa cells expressing different variants of VIP sensor (n = 2 FOVs from two independent transfections each), (bottom) representative fluorescence traces for each tested variant of VIP sensor (n = 30, 37, 46, and 23 cells from 1, 2, 3, and 2 independent transfections, respectively; arrow indicates time point of VIP administration). d. Fluorescence changes of the VPAC1L sensor expressed in HEK293T cells in response to the indicated compounds applied to the extracellular solution (n > 19 cells from two independent transfections). e. Fluorescence changes of the VIP1.0 sensor expressed in HEK293T cells in response to the indicated compounds applied to the extracellular solution (n > 32 cells from two independent transfections). f. Normalized dose-response curve of the VIP1.0 sensor expressed in HEK cells to VIP (n = 50 cells from two independent transfections). Squares represent the mean, error bars represent the standard deviation. g. Representative image of a cultured primary neuron co-expressing the VIP sensor and miRFP (n = 31 neurons from two independent cultures). h. Representative image of a cultured primary neuron expressing the VIP sensor before and after VIP administration (n = 31 neurons from two independent cultures). i. Representative image of a cultured primary neuron expressing the VIP1.0 sensor before and after VIP administration (n = 10 neurons from four independent cultures). j. Fluorescence trace for neuron shown in h (arrow indicates time point of VIP administration). k. Fluorescence trace for neuron shown in i (arrow indicates time point of VIP administration). l. Fluorescence changes of the VIP1.0 sensor expressed in cultured neurons in response to VIP at the indicated concentrations (n = 6 and 10 neurons from four independent transfections). Box plots with notches: narrow part of notch, median; top and bottom of the notch, 95% confidence interval for the median; top and bottom horizontal lines, 25% and 75% percentiles for the data; whiskers extend 1.5-fold the interquartile range from the 25th and 75th percentiles; horizontal line, mean.

