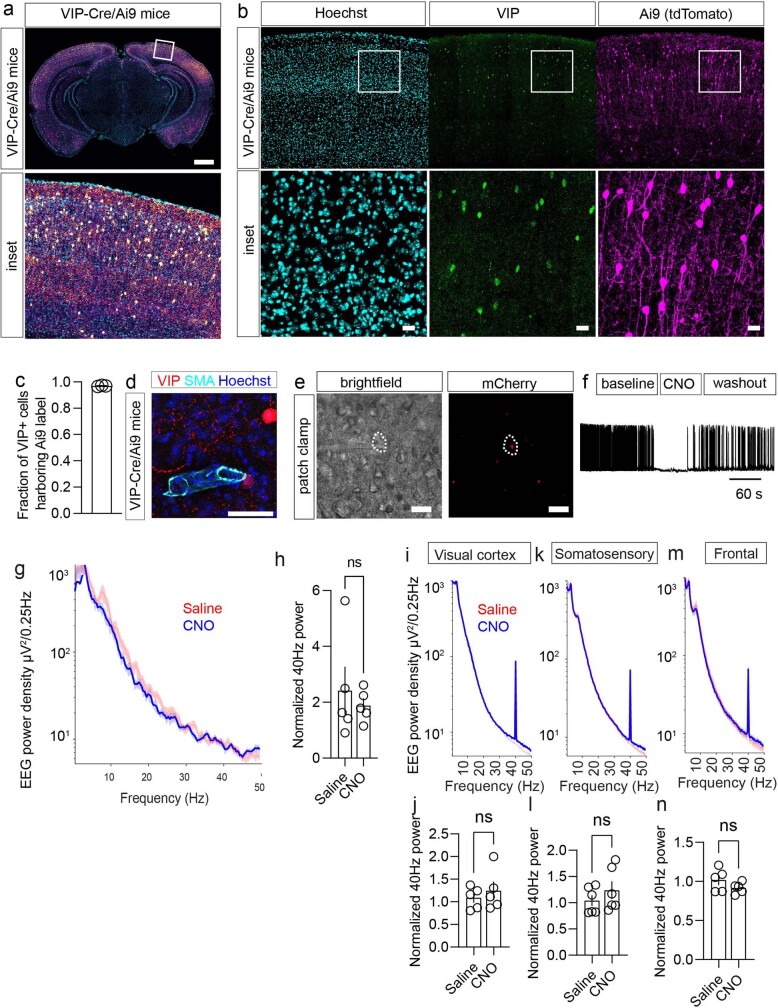
Extended Data Fig. 13. VIP-Cre mouse validation and effects on 40 Hz neuronal activity.
a. Example coronal section of VIP-Cre/Ai9 mouse acquired with confocal microscopy. VIP-IRES-Cre mice have Cre recombinase expression directed to VIP-expressing cells by the endogenous promoter/enhancer elements of the vasoactive intestinal polypeptide locus. The experiment was repeated twice. Scale bar, 1000 um. b. Example confocal z-stack maximum intensity projection image of immunohistochemistry for VIP (green) and tdTomato using a primary antibody against mCherry (magenta), with Hoechst (cyan) from a VIP-Cre/Ai9 mouse cortex. Scale bar, 20 um. c. Quantification of cells expressing both Ai9 and VIP (n = 3 mice; data is presented as the mean ± s.e.m.). d. Example of VIP neuronal processes (red, VIP-Cre tdTomato) adjacent to arterial smooth muscle (cyan, labeled with SMA-22). Scale bar, 50 µm. e. Example brightfield (left) and fluorescent (right) images of the patched neuron expressing mCherry. A giga-ohm seal was achieved for recording. VIP-Cre/5XFAD mice were retro-orbitally injected with PHP.eB-AAV-DIO-hM4Di-mCherry. Virus was allowed to express for ~4 weeks. Scale bar, 50 um. f. Whole cell current clamp recording of VIP neurons expressing Gi-coupled DREADDs from prefrontal cortex. Represented sweep shows bath application of CNO (20 uM) following washout. g. Poewr density in the frontal EEG showing the effect of VIP chemogenetic inhibition on baseline state. VIP-Cre/5XFAD mice received PHPeb-AAV-DIO-hM4Di-mCherry, EEG implants were placed, then recordings were obtained such that mice received either CNO or saline prior to recording during multisensory 40 Hz stimulation (n = 5 6-month-old 5XFAD mice; data is present as the mean; shaded region represents the s.e.m.). h. Quantification of normalized 40 Hz power (n = 5 6-month old VIP-Cre/5XFAD mice; data is presented as mean ± s.e.m.; paired two-tailed t-test was used for analysis). i. Mean EEG power density measured in the visual cortex of VIP-cre during 1 h of multisensory 40 Hz stimulation performed after the injection of either saline or CNO (n = 5 6-month old VIP-Cre/5XFAD mice; mean across mice; shaded area = SEM). j. Normalized 40 Hz EEG power following saline or CNO in visual cortex (n = 5 6-month old VIP-Cre/5XFAD mice; data is presented as the mean ± s.e.m. paired two-tailed t-test was used for analysis). k. Mean EEG power density measured in the somatosensory cortex of VIP-cre during 1 h of multisensory 40 Hz stimulation performed after the injection of either saline or CNO. (Mean across mice; shaded area = SEM). l. Normalized 40 Hz EEG power following saline or CNO in somatosensory cortex (n = 5 6-month old VIP-Cre/5XFAD mice data is presented as the mean ± s.e.m.; paired two-tailed t-test was used for analysis). m. Mean EEG power density measured in the frontal cortex of VIP-cre during 1 h of multisensory 40 Hz stimulation performed after the injection of either saline or CNO (mean across mice; shaded area= SEM). n. Normalized 40 Hz EEG power following saline or CNO in frontal cortex (n = 5 6-month old VIP-Cre/5XFAD mice; data is presented as the mean ± s.e.m.; paired two-tailed t-test was used for analysis).

