

Abstract
Aim: A high level of directly measured small dense low-density lipoprotein cholesterol (sdLDL-C) is a strong risk factor for ischemic heart disease (IHD). However, it remains unclear whether estimated sdLDL-C level is a predictor for IHD. We investigated the associations of new onset of IHD with levels of total cholesterol (TC), high-density lipoprotein cholesterol (HDL-C), non-HDL-C, triglycerides (TG), LDL-C and calculated sdLDL-C by Sampson’s equation.
Methods: After exclusion of subjects with IHD or those with TG ≥ 800 mg/dL, a total of 18,176 subjects (men/women: 11,712/6,464, mean age: 46 years) were recruited among 28,990 Japanese individuals who received annual health checkups.
Results: During the 10-year follow-up period, 456 men (3.9%) and 121 women (1.9%) newly developed IHD. Multivariable Cox proportional hazard analyses after adjustment of age, sex, obesity, smoking habit, family history of IHD, estimated glomerular filtration rate, hypertension and diabetes mellitus at baseline showed that the hazard ratio (HR) (1.38 [95% confidence interval: 1.03-1.85]) for new onset of IHD in subjects with the 4th quartile (Q4) of sdLDL-C (≥ 42 mg/dL) was significantly higher than that in subjects with the 1st quartile (Q1) (≤ 24 mg/dL) as the reference, though the adjusted HRs in subjects with Q2-Q4 of TC, HDL-C, non-HDL-C, LDL-C and TG were comparable with those in subjects with Q1 of the respective lipid fractions. The adjusted HR with a restricted cubic spline increased with a higher level of calculated sdLDL-C as a continuous value at baseline.
Conclusions: sdLDL-C level calculated by Sampson’s equation is a predominant predictor for the development of IHD in a general Japanese population.
Keywords: Small dense low-density lipoprotein cholesterol, Ischemic heart disease
Masafumi Inyaku and Marenao Tanaka contributed equally to this work.
Introduction
Ischemic heart disease (IHD) is a life-threatening cardiovascular disease that shortens healthy life expectancy. The identification of accurate, simple, and powerful risk factors for the development of IHD is important for public health 1) . Numerous epidemiological studies showed that metabolic abnormalities including diabetes mellitus, hypertension, obesity and dyslipidemia are associated with the development of IHD 2 , 3) . Regarding the treatment for dyslipidemia, reduction of low-density lipoprotein (LDL) cholesterol (LDL-C) is essential for the prevention of atherosclerotic cardiovascular disease including IHD 2 , 3) . However, it is necessary to note that LDL contains lipoproteins that are composed of multiple subfractions with different particle sizes and with specific gravities ranging from 1.019 to 1.063 g/mL 4) . In addition, careful interpretation is needed for evaluation of levels of LDL-C in patients with hypertriglyceridemia. When levels of triglycerides (TG) ≥ 400 mg/dL are used, LDL-C levels calculated by Friedewald’s equation, a conventionally used formula for estimation of LDL-C level, are inaccurate 5) . A new calculation by Sampson’s equation using values of total cholesterol (TC), high-density lipoprotein cholesterol (HDL-C) and non-HDL-C has been reported to accurately estimate LDL-C level in individuals with TG <800 mg/dL 6) .
It has been shown that particle size of LDL is particularly important in the pathogenesis of atherosclerosis 7 , 8) . LDL particles with small sizes of 25.5 nm or less and heavier gravity of 1.044-1.063 g/mL are defined as small dense LDL (sdLDL) particles, and sdLDL cholesterol (sdLDL-C) level has been suggested to be a potent risk factor for cardiovascular diseases 7 , 8) . Electrophoresis is the gold standard method for measurement of LDL particle size to evaluate sdLDL 9 , 10) , but it is time-consuming and labor-intensive. A convenient method for estimating sdLDL-C has recently been proposed using levels of TG and non-HDL-C 11 , 12) . Logically, the number of LDL particles is positively correlated with non-HDL-C concentration, and the size of LDL particles is negatively correlated with TG concentration 13) . Therefore, high levels of non-HDL-C and TG can predict a high level of sdLDL-C 13) . Furthermore, Sampson et al. recently developed a calculation method to estimate sdLDL-C using levels of TC, HDL-C, non-HDL-C, TG and calculated LDL-C 14) . However, it remains unclear whether a high level of sdLDL-C calculated by using Sampson’s equation is a useful marker for the development of IHD.
In the present study, we carried out longitudinal analyses for determining the associations of new onset of IHD during a 10-year follow-up period with levels of sdLDL-C calculated by Sampson’s equation 14) and with levels of TC, HDL-C, non-HDL-C, TG and LDL-C calculated by Sampson’s equation 6) at baseline in a large number of Japanese individuals who underwent annual health checkups.
Methods
Study Subjects and Clinical Endpoint
This study was a retrospective cohort study in which data had been prospectively collected in Japanese individuals who received annual health checkups in Keijinkai Maruyama Clinic, a major health checkup institute in Sapporo, Japan. All individuals who received annual health checkups in 2006 were initially analyzed in the present study (n=28,990) ( Supplementary Fig.1 ) . Subjects with no data for examinations of TC, TG and HDL-C, those with TG levels ≥ 800 mg/dL and those with IHD at baseline were excluded. After exclusion, data for 18,176 subjects (men/women: 11,712/6,464) who received health checkups at least once during the period from 2007 to 2016 contributed to the present analyses. The clinical endpoint was new onset of IHD determined by a self-reported questionnaire in annual health checkups during a 10-year follow up period. This study conformed to the principles outlined in the Declaration of Helsinki and was approved by the institutional ethical committee of Sapporo Medical University (Number: 30-2-32). Written informed consent was obtained from all subjects.
Supplementary Fig.1. Selection of study participants.
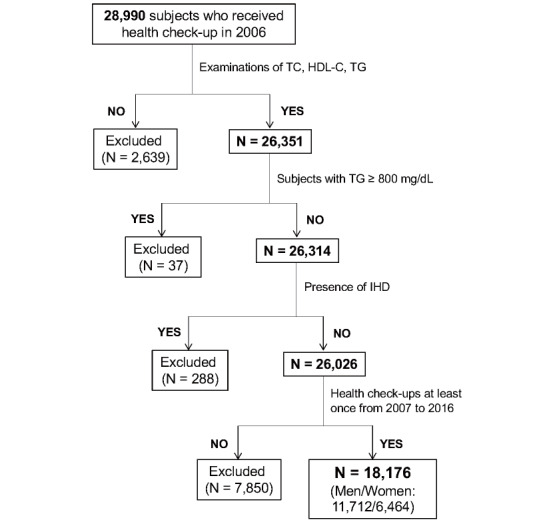
Among 28,990 individuals who received health examinations in 2006, a total of 18,176 subjects (men/women: 11,712/6,464) were finally recruited for analyses in the present study.
HDL-C, high-density lipoprotein cholesterol; IHD, ischemic heart disease; TC, total cholesterol; TG, triglycerides.
Measurements
Medical examinations and samplings of urine and blood were performed after an overnight fast. Blood pressure was measured twice consecutively on the upper arm in the sitting position using a sphygmomanometer (#601, Kenzmedico, Saitama, Japan) by a nurse, and average blood pressure was used for analysis. Body mass index (BMI) was calculated as body weight in kilograms divided by height in meters squared. Estimated glomerular filtration rate (eGFR) was calculated by using the following equation for Japanese people: eGFR (mL/min/1.73m2)=194×serum creatinine−1.094×age−0.287×0.782 (if female) 15) . Levels of TC, HDL-C and TG were measured by enzymatic assays. Non-HDL-C level was calculated by subtracting HDL-C level from TC level. LDL-C, large buoyant LDL-C (lbLDL-C) and sdLDL-C were calculated by using Sampson’s formulas: LDL-C 6) =TC/0.948−HDL-C/0.971−(TG/8.56+[TG×non-HDL-C]/2140−TG2 /16100)−9.44; lbLDL-C 14) =1.43×LDL-C−(0.14×(In [TG]×LDL-C)−8.99; sdLDL-C 14) =LDL-C−lbLDL-C. LDL-C level was also measured by a direct enzymatic assay in 12,960 subjects among the 18,176 enrolled subjects. The correlation coefficient of the direct method and the Sampson equation of LDL-C was 0.967, and the regression equation was ‘y=0.98x+0.21’ ( Supplementary Fig.2 ) .
Supplementary Fig.2. Correlation of levels of directly measured LDL-C and estimated LDL-C calculated by Sampson’s equation (n=12,960) .
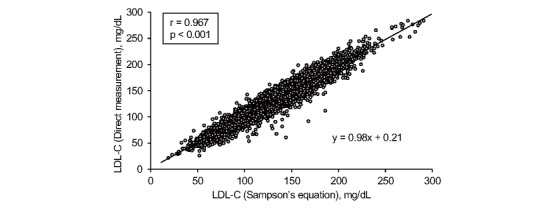
LDL-C, low-density lipoprotein cholesterol
A self-administered questionnaire survey was performed to obtain information on habits of smoking and alcohol drinking, family history of IHD and medical histories including treatment for hypertension, diabetes mellitus, dyslipidemia and IHD at baseline. Obesity was defined as BMI ≥ 25 in accordance with the Japan Society for the Study of Obesity 16) . Hypertension was diagnosed in accordance with the guidelines of the Japanese Society of Hypertension 17) : systolic blood pressure ≥ 140 mmHg, diastolic blood pressure ≥ 90 mmHg or self-reported use of anti-hypertensive drugs. Diabetes mellitus was diagnosed in accordance with the guidelines of the Japan Diabetes Society 18) : a combination of fasting plasma glucose ≥ 126 mg/dL and hemoglobin A1c ≥ 6.5% or self-reported use of anti-diabetic drugs.
Statistical Analysis
Numeric variables are expressed as means±SD for normal distributions or medians (interquartile ranges) for skewed distributions. The distribution of each parameter was tested for its normality using the Shapiro-Wilk W test. Comparisons between two groups for parametric and nonparametric factors were performed by using Student’s t-test and the Mann-Whitney U test, respectively. Subjects were divided by quartiles of TC, HDL-C, non-HDL-C, calculated LDL-C, TG or calculated sdLDL-C at baseline (Q1~Q4). Intergroup differences in percentages of demographic parameters were examined by the chi-square test. One-way analysis of variance was used for detecting significant differences between data in multiple groups. The ability of TC, HDL-C, non-HDL-C, LDL-C, TG or sdLDL-C at baseline to predict new onset of IHD was investigated by using receiver operating characteristic (ROC) curve analysis. The area under the curve (AUC) was calculated, and the cutoff values of TC, HDL-C, non-HDL-C, calculated LDL-C, TG and calculated sdLDL-C were obtained by the Youden index 19) . The associations of the development of IHD with levels of TC, HDL-C, non-HDL-C, LDL-C, TG and sdLDL-C were investigated by multivariable Cox proportional hazard models with a restricted cubic spline after adjustment of confounders including age, sex, obesity, smoking habit, family history of IHD, eGFR, hypertension and diabetes mellitus at baseline. In addition, Cox proportional hazard models in four subgroups according to quartiles of lipid fractions were analyzed by using the Q1 group as reference. Interaction of sex and level of each lipid fraction for the development of IHD was also investigated, and hazard ratios (HRs), 95% confidence intervals (CIs) and Akaike’s information criterion (AIC) were calculated. A p value of less than 0.05 was considered statistically significant. All data were analyzed by using EZR 20) , R version 4.0.3 (R Core Team, R Foundation for Statistical Computing, Vienna, Austria, 2020, https://www.R-project.org) and Python version 3.10.7.
Results
Characteristics of the Study Subjects
Basal characteristics of the enrolled and excluded subjects are shown in Supplementary Table 1 . The excluded subjects were significantly younger than the enrolled subjects, included a lower percentage of men, had lower levels of TC, non-HDL-C, LDL-C, TG and sdLDL-C, and had a higher level of HDL-C than did the recruited subjects. Basal characteristics of the recruited subjects are shown in Table 1 . Men had higher systolic and diastolic blood pressures, higher levels of TC, non-HDL-C, LDL-C, TG and sdLDL-C and a lower level of HDL-C than did women.
Supplementary Table 1. Characteristics of the enrolled and excluded subjects.
|
Enrolled n = 18,176 |
Excluded n = 10,814 |
p | |
|---|---|---|---|
| Age (years) | 48±10 | 40±14 | <0.001 |
| Sex, Men | 11,712 (64.4) | 6,176 (57.1) | <0.001 |
| Body mass index | 23±3 | 22±4 | <0.001 |
| Obesity* | 5,739 (31.6) | 2,477 (24.4) | <0.001 |
| Systolic blood pressure (mmHg) | 117±17 | 114±17 | <0.001 |
| Diastolic blood pressure (mmHg) | 74±11 | 72±11 | <0.001 |
| Smoking habit | 6,387 (35.1) | 3,848 (35.6) | 0.446 |
| Alcohol drinking habit | 8,260 (45.4) | 3,557 (32.9) | <0.001 |
| Comorbidity | |||
| Hypertension | 3,118 (17.2) | 1,233 (11.4) | <0.001 |
| Diabetes mellitus | 829 (4.6) | 312 (2.9) | <0.001 |
| IHD | 0 (0) | 296 (2.7) | <0.001 |
| Family history | |||
| IHD | 1,620 (8.9) | 679 (6.3) | <0.001 |
| Biochemical data | |||
| Hemoglobin (g/dL) | 14.3±1.5 | 14.3±1.6 | <0.001 |
| Albumin (g/dL) | 4.4±0.2 | 4.4±0.2 | <0.001 |
| Blood urea nitrogen (mg/dL) | 14.3±3.6 | 14.2±3.5 | 0.768 |
| Creatinine (mg/dL) | 0.74±0.28 | 0.71±0.15 | <0.001 |
| eGFR (mL/min/1.73m2) | 85±15 | 86±15 | <0.001 |
| Uric acid (mg/dL) | 5.5±1.4 | 5.4±0.8 | <0.001 |
| FPG (mg/dL) | 93±20 | 92±20 | <0.001 |
| Hemoglobin A1c (%) | 5.3±0.7 | 5.4±0.8 | <0.001 |
| TC (mg/dL) | 204±34 | 198±36 | <0.001 |
| HDL-C (mg/dL) | 61±16 | 63±16 | <0.001 |
| non-HDL-C (mg/dL) | 143±36 | 134±38 | <0.001 |
| LDL-C (mg/dL) | 123±32 | 116±33 | <0.001 |
| TG (mg/dL) | 92 [63-137] | 81 [55-123] | <0.001 |
| sdLDL-C (mg/dL) | 34 [25-43] | 30 [22-40] | <0.001 |
Variables are expressed as number (%), means±SD or medians [interquartile ranges].
*Body mass index ≥ 25.
eGFR, estimated glomerular filtration rate; FPG, fasting plasma glucose; HDL-C, high-density lipoprotein cholesterol; IHD, ischemic heart disease; LDL-C, low-density lipoprotein cholesterol; sdLDL-C, small dense LDL-C; TC, total cholesterol; TG, triglycerides.
Table 1. Characteristics of the recruited subjects at baseline.
| All n= 18,176 | Men n= 11,712 | Women n= 6,464 | p | |
|---|---|---|---|---|
| Age (years) | 48±10 | 48±10 | 47±11 | <0.001 |
| Body mass index | 23±3 | 24±3 | 22±3 | <0.001 |
| Obesity* | 5,739 (31.6) | 4,647 (39.7) | 1,092 (16.9) | <0.001 |
| Systolic blood pressure (mmHg) | 117±17 | 120±16 | 110±17 | <0.001 |
| Diastolic blood pressure (mmHg) | 74±11 | 77±11 | 69±11 | <0.001 |
| Smoking habit | 6,387 (35.1) | 5,192 (44.3) | 1,195 (18.5) | <0.001 |
| Alcohol drinking habit | 8,260 (45.4) | 6,595 (56.3) | 1,665 (25.8) | <0.001 |
| Comorbidity | ||||
| Hypertension | 3,118 (17.2) | 2,436 (20.8) | 682 (10.6) | <0.001 |
| Diabetes mellitus | 829 (4.6) | 717 (6.1) | 112 (1.7) | <0.001 |
| Family history | ||||
| IHD | 1,620 (8.9) | 975 (8.3) | 645 (10.0) | <0.001 |
| Biochemical data | ||||
| Hemoglobin (g/dL) | 14.3±1.5 | 15.1±1.1 | 12.9±1.2 | <0.001 |
| Albumin (g/dL) | 4.4±0.2 | 4.4±0.2 | 4.3±0.2 | <0.001 |
| Blood urea nitrogen (mg/dL) | 14.3±3.6 | 14.8±3.6 | 13.3±3.4 | <0.001 |
| Creatinine (mg/dL) | 0.74±0.28 | 0.81±0.29 | 0.60±0.17 | <0.001 |
| eGFR (mL/min/1.73m2) | 85±15 | 84±15 | 87±16 | <0.001 |
| Uric acid (mg/dL) | 5.5±1.4 | 6.1±1.2 | 4.4±1.0 | <0.001 |
| FPG (mg/dL) | 93±20 | 96±21 | 87±14 | <0.001 |
| Hemoglobin A1c (%) | 5.3±0.7 | 5.4±0.8 | 5.2±0.5 | <0.001 |
| TC (mg/dL) | 204±34 | 205±34 | 203±34 | <0.001 |
| HDL-C (mg/dL) | 61±16 | 56±14 | 69±15 | <0.001 |
| non-HDL-C (mg/dL) | 143±36 | 149±35 | 133±35 | <0.001 |
| LDL-C (mg/dL) | 123±32 | 125±31 | 119±32 | <0.001 |
| TG (mg/dL) | 92 [63-137] | 110 [78-160] | 67 [49-93] | <0.001 |
| sdLDL-C (mg/dL) | 34 [25-43] | 37 [29-46] | 27 [21-35] | <0.001 |
Variables are expressed as number (%), means±SD or medians [interquartile ranges]. *Body mass index ≥ 25.
eGFR, estimated glomerular filtration rate; FPG, fasting plasma glucose; HDL-C, high-density lipoprotein cholesterol; IHD, ischemic heart disease; LDL-C, low-density lipoprotein cholesterol; sdLDL-C, small dense LDL-C; TC, total cholesterol; TG, triglycerides.
Basal characteristics of subjects divided into the four subgroups according to quartiles of calculated sdLDL-C at baseline are shown in Table 2 . Higher quartiles of sdLDL-C were accompanied by older age, higher percentage of men, larger BMI, higher frequencies of smoking habit, family history of IHD, hypertension and diabetes mellitus, higher systolic and diastolic blood pressures, higher levels of TC, non-HDL-C, LDL-C and TG and lower levels of eGFR and HDL-C.
Table 2. Characteristics of subjects with quartiles of basal sdLDL-C (n = 18,176) .
| Quartiles of sdLDL-C (mg/dL) | Q1 (~24) n= 4,155 | Q2 (25~31) n=4,219 | Q3 (32~41) n=4,870 | Q4 (42~) n= 4,932 | p |
|---|---|---|---|---|---|
| Age (years) | 43±10 | 48±11 | 49±10 | 49±10 | <0.001 |
| Sex, Men | 1,550 (37.3) | 2,506 (59.4) | 3,542 (72.7) | 4,114 (83.4) | <0.001 |
| Body mass index | 21±3 | 23±3 | 24±3 | 25±3 | <0.001 |
| Obesity* | 395 (9.5) | 976 (23.1) | 1,829 (37.6) | 2,539 (51.5) | <0.001 |
| Systolic blood pressure (mmHg) | 110±16 | 115±17 | 119±16 | 121±16 | <0.001 |
| Diastolic blood pressure (mmHg) | 69±11 | 73±11 | 76±11 | 78±11 | <0.001 |
| Smoking habit | 1,065 (25.6) | 1,431 (33.9) | 1,751 (36.0) | 2,140 (43.4) | <0.001 |
| Alcohol drinking habit | 1,649 (39.7) | 1,886 (44.7) | 2,331 (47.9) | 2,394 (48.5) | <0.001 |
| Family history | |||||
| IHD | 313 (7.5) | 384 (9.1) | 419 (8.6) | 504 (10.2) | <0.001 |
| Comorbidity | |||||
| Hypertension | 313 (7.5) | 669 (15.9) | 1,026 (21.1) | 1,110 (22.5) | <0.001 |
| Diabetes mellitus | 70 (1.7) | 172 (4.1) | 275 (5.6) | 312 (6.3) | <0.001 |
| Biochemical data | |||||
| Hemoglobin (g/dL) | 13.5±1.5 | 14.1±1.5 | 14.6±1.4 | 15.1±1.3 | <0.001 |
| Albumin (g/dL) | 4.3±0.2 | 4.4±0.2 | 4.4±0.2 | 4.4±0.2 | <0.001 |
| Blood urea nitrogen (mg/dL) | 13.6±3.7 | 14.2±3.7 | 14.5±3.5 | 14.6±3.5 | <0.001 |
| Creatinine (mg/dL) | 0.67±0.28 | 0.72±0.31 | 0.76±0.28 | 0.79±0.24 | <0.001 |
| eGFR (mL/min/1.73m2) | 89±15 | 86±15 | 83±15 | 82±15 | <0.001 |
| Uric acid (mg/dL) | 4.7±1.2 | 5.2±1.3 | 5.7±1.3 | 6.1±1.4 | <0.001 |
| FPG (mg/dL) | 87±14 | 91±18 | 94±20 | 98±23 | <0.001 |
| Hemoglobin A1c (%) | 5.1±0.5 | 5.3±0.6 | 5.4±0.7 | 5.5±0.8 | <0.001 |
| TC (mg/dL) | 177±26 | 192±25 | 206±24 | 235±28 | <0.001 |
| HDL-C (mg/dL) | 71±15 | 65±15 | 58±14 | 51±11 | <0.001 |
| non-HDL-C (mg/dL) | 106±21 | 128±28 | 148±17 | 183±26 | <0.001 |
| LDL-C (mg/dL) | 95±23 | 113±22 | 128±23 | 151±28 | <0.001 |
| TG (mg/dL) | 49 [41-58] | 74 [63-89] | 104 [87-130] | 163 [129-219] | <0.001 |
Variables are expressed as number (%), means±SD or medians [interquartile ranges]. *Body mass index ≥ 25.
eGFR, estimated glomerular filtration rate; FPG, fasting plasma glucose; HDL-C, high-density lipoprotein cholesterol; IHD, ischemic heart disease; LDL-C, low-density lipoprotein cholesterol; sdLDL-C, small dense LDL-C; TC, total cholesterol; TG, triglycerides.
Incident Rate for New Onset of IHD during a Follow-Up Period
Among the 18,176 recruited subjects (men/women: 11,712/6,464), 577 subjects (men/women: 456/121) developed new onset of IHD during a 10-year follow-up period ( Supplementary Table 2 ) . The follow-up summation was 119,192 (men/women: 76,771/42,421) person-years, and incident rate was 4.8 (men/women: 5.9/2.9) per 1,000 person-years.
Supplementary Table 2. Development of IHD during the follow-up period.
| All | Men | Women | |
|---|---|---|---|
| Number | 18,176 | 11,712 | 6,464 |
| New onset of IHD, number (%) | 577 (3.2) | 456 (3.9) | 121 (1.9) |
| Observed person-years | 119,192 | 76,771 | 42,421 |
| Incidence rate, per 1,000 person-years | 4.8 | 5.9 | 2.9 |
IHD, ischemic heart disease.
Prediction of New Onset of IHD by Levels of Lipid Fractions at Baseline
ROC curve analyses for predicting new onset of IHD showed that cutoff points of lipid fractions at baseline were as follows: TC: 201 mg/dL (AUC: 0.54) ( Fig.1A ) ; HDL-C: 57 mg/dL (AUC: 0.58) ( Fig.1B ) ; non-HDL-C: 148 mg/dL (AUC: 0.57) ( Fig.1C ) ; LDL-C: 119 mg/dL (AUC: 0.56) ( Fig.1D ) ; TG: 85 mg/dL (AUC: 0.59) ( Fig.1E ) ; and sdLDL-C: 30 mg/dL (AUC: 0.60) ( Fig.1F ) . The AUC of sdLDL-C was the highest among AUCs of lipid fractions.
Fig.1. Prediction of new onset of IHD by levels of lipids at baseline.
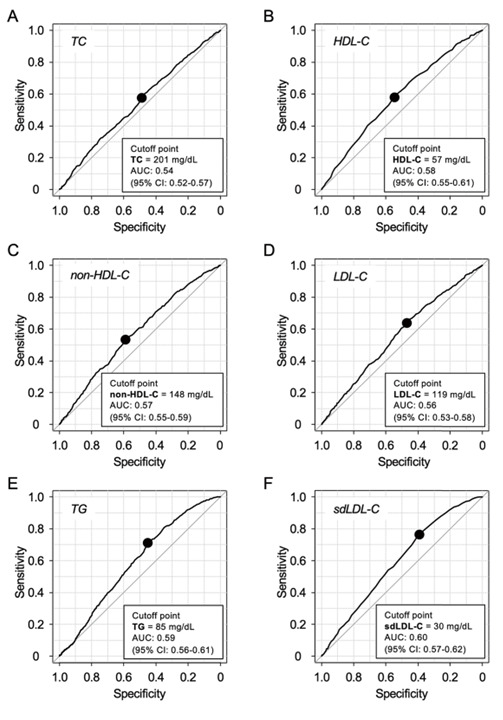
A-F. Receiver operating characteristic curves of total cholesterol (TC) (A), high-density lipoprotein cholesterol (HDL-C) (B), non-HDL-C (C), calculated low-density lipoprotein cholesterol (LDL-C) (D), triglycerides (TG) (E), and calculated small dense LDL-C (sdLDL-C) (F) at baseline to predict new onset of ischemic heart disease (IHD).
AUC, area under the curve; CI, confidence interval.
Hazard Risks for New Onset of IHD by Quartiles of Lipid Fractions
In unadjusted analyses ( Supplementary Fig.3 ) , HRs in the Q3 and Q4 groups of TC ( Supplementary Table 3 ) and LDL-C ( Supplementary Table 4 ) were significantly higher than those in the Q1 group of each lipid fraction. HRs in the Q3 and Q4 groups of HDL-C were significantly lower than that in the Q1 group ( Supplementary Table 5 ) . HRs in the Q2, Q3 and Q4 groups of non-HDL-C ( Supplementary Table 6 ) , TG ( Supplementary Table 7 ) and sdLDL-C ( Table 3 ) were significantly higher than those in the Q1 group of each lipid fraction.
Supplementary Fig.3. Hazard ratios for the development of IHD in quartiles of lipid fractions at baseline.
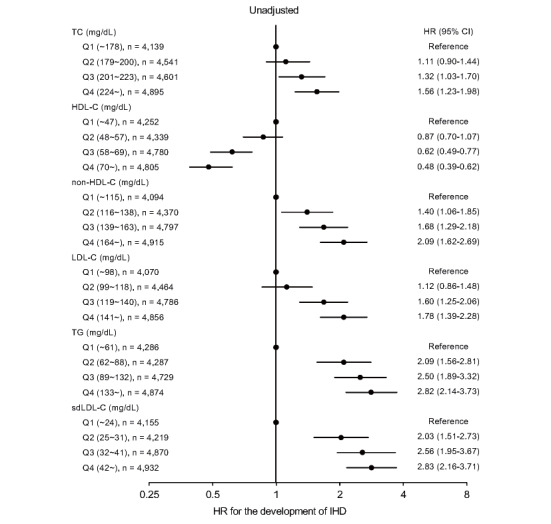
Forest plots of unadjusted hazard ratios (HRs) and 95% confidence intervals (CIs) for the development of ischemic heart disease (IHD) in quartiles of total cholesterol (TC), high-density lipoprotein cholesterol (HDL-C), non-HDL-C, calculated low-density lipoprotein cholesterol (LDL-C), triglycerides (TG) and calculated small dense low-density lipoprotein cholesterol (sdLDL-C) at baseline analyzed by Cox proportional hazard models.
Supplementary Table 3. Multivariable Cox proportional hazard analyses for development of IHD in quartiles of TC.
| Unadjusted | Adjusted | |||
|---|---|---|---|---|
| HR (95%CI) | P | HR (95%CI) | P | |
| Quartiles of TC (mg/dL) | ||||
| Q1 (~178), n = 4,139 | Reference | - | Reference | - |
| Q2 (179~200), n = 4,541 | 1.11 (0.90-1.44) | 0.194 | 0.93 (0.72-1.22) | 0.631 |
| Q3 (201~223), n = 4,601 | 1.32 (1.03-1.70) | 0.027 | 1.07 (0.83-1.37) | 0.614 |
| Q4 (224~), n = 4,895 | 1.56 (1.23-1.98) | <0.001 | 1.17 (0.93-1.50) | 0.178 |
| Age | - | - | 1.07 (1.06-1.08) | <0.001 |
| Sex | - | - | 1.69 (1.37-2.09) | <0.001 |
| Obesity* | - | - | 1.50 (1.26-1.78) | <0.001 |
| Smoking habit | - | - | 1.21 (1.01-1.44) | 0.036 |
| Family history ofI HD | - | - | 1.59 (1.26-2.01) | <0.001 |
| eGFR | - | - | 0.99 (0.99-1.01) | 0.860 |
| Hypertension | - | - | 1.55 (1.29-1.86) | <0.001 |
| Diabetes mellitus | - | - | 1.93 (1.50-2.49) | <0.001 |
| (AIC = 10,859) | (AIC = 10,419) | |||
| Interaction [Sex-Quartiles of TC] | - | 0.794 | ||
*Body mass index ≥ 25.
AIC, Akaike’s information criterion; CI, confidence interval; eGFR, estimated glomerular filtration rate; HR, hazard ratio; IHD, ischemic heart disease; TC, total cholesterol.
Supplementary Table 4. Multivariable Cox proportional hazard analyses for development of IHD in quartiles of LDL-C.
| Unadjusted | Adjusted | |||
|---|---|---|---|---|
| HR (95% CI) | P | HR (95% CI) | P | |
| Quartiles of LDL-C (mg/dL) | ||||
| Q1 (~98), n= 4,070 | Reference | - | Reference | - |
| Q2 (99~118), n= 4,464 | 1.12 (0.86-1.48) | 0.397 | 0.90 (0.68-1.18) | 0.435 |
| Q3 (119~140), n= 4,786 | 1.60 (1.25-2.06) | <0.001 | 1.14 (0.89-1.47) | 0.302 |
| Q4 (141~), n= 4,856 | 1.78 (1.39-2.28) | <0.001 | 1.19 (0.93-1.53) | 0.170 |
| Age | - | - | 1.07 (1.06-1.08) | <0.001 |
| Sex | - | - | 1.67 (1.35-2.07) | <0.001 |
| Obesity* | - | - | 1.49 (1.25-1.76) | <0.001 |
| Smoking habit | - | - | 1.21 (1.01-1.43) | 0.039 |
| Family history of IHD | - | - | 1.59 (1.26-2.00) | <0.001 |
| eGFR | - | - | 0.99 (0.99-1.01) | 0.926 |
| Hypertension | - | - | 1.55 (1.29-1.87) | <0.001 |
| Diabetes mellitus | - | - | 1.94 (1.51-2.51) | <0.001 |
| (AIC= 10,856) | (AIC= 10,420) | |||
| Interaction [Sex-Quartiles of LDL-C] | - | 0.877 | ||
*Body mass index ≥ 25.
AIC, Akaike's information criterion; CI, confidence interval; eGFR, estimated glomerular filtration rate; HR, hazard ratio; IHD, ischemic heart disease; LDL-C, low-density lipoprotein cholesterol.
Supplementary Table 5. Multivariable Cox proportional hazard analyses for development of IHD in quartiles of HDL-C.
| Unadjusted | Adjusted | |||
|---|---|---|---|---|
| HR (95% CI) | P | HR (95% CI) | P | |
| Quartiles of HDL-C (mg/dL) | ||||
| Q1 (~47), n= 4,252 | Reference | - | Reference | - |
| Q2 (48~57), n= 4,339 | 0.87 (0.70-1.07) | 0.184 | 1.00 (0.81-1.24) | 0.966 |
| Q3 (58~69), n= 4,780 | 0.62 (0.49-0.77) | <0.001 | 0.88 (0.70-1.12) | 0.320 |
| Q4 (70~), n= 4,805 | 0.48 (0.39-0.62) | <0.001 | 0.85 (0.65-1.10) | 0.218 |
| Age | - | - | 1.07 (1.06-1.08) | <0.001 |
| Sex | - | - | 1.60 (1.38-2.00) | <0.001 |
| Obesity* | - | - | 1.47 (1.23-1.75) | <0.001 |
| Smoking habit | - | - | 1.19 (0.99-1.42) | 0.059 |
| Family history of IHD | - | - | 1.60 (1.27-2.02) | <0.001 |
| eGFR | - | - | 0.99 (0.99-1.01) | 0.885 |
| Hypertension | - | - | 1.54 (1.28-1.85) | <0.001 |
| Diabetes mellitus | - | - | 1.89 (1.47-2.44) | <0.001 |
| (AIC= 10,831) | (AIC= 10,421) | |||
| Interaction [Sex-Quartiles of HDL-C] | - | 0.084 | ||
*Body mass index ≥ 25.
AIC, Akaike's information criterion; CI, confidence interval; eGFR, estimated glomerular filtration rate; HDL-C, high-density lipoprotein cholesterol; HR, hazard ratio; IHD, ischemic heart disease.
Supplementary Table 6. Multivariable Cox proportional hazard analyses for development of IHD in quartiles of non-HDL-C.
| Unadjusted | Adjusted | |||
|---|---|---|---|---|
| HR (95% CI) | P | HR (95% CI) | P | |
| Quartiles of non-HDL-C (mg/dL) | ||||
| Q1 (~115), n= 4,094 | Reference | - | Reference | - |
| Q2 (116~138), n= 4,370 | 1.40 (1.06-1.85) | 0.016 | 0.98 (0.75-1.30) | 0.907 |
| Q3 (139~163), n= 4,797 | 1.68 (1.29-2.18) | <0.001 | 1.02 (0.78-1.33) | 0.890 |
| Q4 (164~), n= 4,915 | 2.09 (1.62-2.69) | <0.001 | 1.17 (0.91-1.52) | 0.226 |
| Age | - | - | 1.07 (1.06-1.08) | <0.001 |
| Sex | - | - | 166 (1.34-2.05) | <0.001 |
| Obesity* | - | - | 1.48 (1.25-1.76) | <0.001 |
| Smoking habit | - | - | 1.20 (1.01-1.43) | 0.045 |
| Family history of IHD | - | - | 1.59 (1.26-2.01) | <0.001 |
| eGFR | - | - | 0.99 (0.99-1.01) | 0.899 |
| Hypertension | - | - | 1.55 (1.28-1.86) | <0.001 |
| Diabetes mellitus | - | - | 1.93 (1.49-2.48) | <0.001 |
| (AIC= 10,838) | (AIC= 10,420) | |||
| Interaction [Sex-Quartiles of non-HDL-C] | - | 0.773 | ||
*Body mass index ≥ 25.
AIC, Akaike's information criterion; CI, confidence interval; eGFR, estimated glomerular filtration rate; HR, hazard ratio; IHD, ischemic heart disease; non-HDL-C, non-high-density lipoprotein cholesterol.
Supplementary Table 7. Multivariable Cox proportional hazard analyses for development of IHD in quartiles of TG.
| Unadjusted | Adjusted | |||
|---|---|---|---|---|
| HR (95% CI) | P | HR (95% CI) | P | |
| Quartiles of TG (mg/dL) | ||||
| Q1 (~61), n= 4,286 | Reference | - | Reference | - |
| Q2 (62~88), n= 4,287 | 2.09 (1.56-2.81) | <0.001 | 1.32 (0.98-1.79) | 0.070 |
| Q3 (89~132), n= 4,729 | 2.50 (1.89-3.32) | <0.001 | 1.31 (0.97-1.76) | 0.075 |
| Q4 (133~), n= 4,874 | 2.82 (2.14-3.73) | <0.001 | 1.32 (0.98-1.79) | 0.064 |
| Age | - | - | 1.07 (1.06-1.08) | <0.001 |
| Sex | - | - | 1.60 (1.29-1.99) | <0.001 |
| Obesity* | - | - | 1.47 (1.23-1.75) | <0.001 |
| Smoking habit | - | - | 1.18 (0.99-1.41) | 0.066 |
| Family history of IHD | - | - | 1.60 (1.27-2.01) | <0.001 |
| eGFR | - | - | 0.99 (0.99-1.01) | 0.860 |
| Hypertension | - | - | 1.53 (1.27-1.84) | <0.001 |
| Diabetes mellitus | - | - | 1.89 (1.27-1.84) | <0.001 |
| (AIC= 10,817) | (AIC= 10,419) | |||
| Interaction [Sex-Quartiles of TG] | - | 0.060 | ||
*Body mass index ≥ 25.
AIC, Akaike's information criterion; CI, confidence interval; eGFR, estimated glomerular filtration rate; HR, hazard ratio; IHD, ischemic heart disease; TG, triglycerides.
Table 3. Multivariable Cox proportional hazard analyses for development of IHD in quartiles of sdLDL-C.
| Unadjusted | Adjusted | |||
|---|---|---|---|---|
| HR (95% CI) | P | HR (95% CI) | P | |
| Quartiles of sdLDL-C (mg/dL) | ||||
| Q1 (~24), n = 4,155 | Reference | - | Reference | - |
| Q2 (25~31), n = 4,219 | 2.03 (1.51-2.73) | <0.001 | 1.27 (0.93-1.73) | 0.124 |
| Q3 (32~41), n = 4,870 | 2.56 (1.95-3.67) | <0.001 | 1.32 (0.99-1.77) | 0.063 |
| Q4 (42~), n = 4,932 | 2.83 (2.16-3.71) | <0.001 | 1.38 (1.03-1.85) | 0.033 |
| Age | - | - | 1.07 (1.06-1.08) | <0.001 |
| Sex | - | - | 1.61 (1.28-1.98) | <0.001 |
| Obesity* | - | - | 1.28 (1.06-1.99) | <0.001 |
| Smoking habit | - | - | 1.18 (0.99-1.42) | 0.061 |
| Family history of IHD | - | - | 1.59 (1.26-2.00) | <0.001 |
| eGFR | - | - | 0.99 (0.99-1.01) | 0.805 |
| Hypertension | - | - | 1.53 (1.27-1.84) | <0.001 |
| Diabetes mellitus | - | - | 1.90 (1.48-2.56) | <0.001 |
| (AIC = 10,802) | (AIC = 10,418) | |||
| Interaction [Sex-Quartiles of sdLDL-C] | - | 0.067 | ||
*Body mass index ≥ 25.
AIC, Akaike’s information criterion; CI, confidence interval; eGFR, estimated glomerular filtration rate; HR, hazard ratio; IHD, ischemic heart disease; LDL-C, low-density lipoprotein cholesterol; sdLDL-C, small dense LDL-C.
In multivariable Cox proportional hazard models after adjustment of age, sex, obesity, smoking habit, family history of IHD, eGFR, hypertension and diabetes mellitus at baseline ( Fig.2 ) , there were no significant differences in HRs among the quartiles of TC ( Supplementary Table 3 ) , HDL-C ( Supplementary Table 5 ) , non-HDL-C ( Supplementary Table 6 ) , LDL-C ( Supplementary Table 4 ) or TG ( Supplementary Table 7 ) . HR in the Q4 group of sdLDL-C was significantly higher than that in the Q1 group (HR [95% CI]: 1.38 [1.03-1.85]) ( Table 3 ) . There were no significant interactions of sex with quartiles of TC (p=0.794), HDL-C (p=0.084), non-HDL-C (p=0.773), LDL-C (p=0.877), TG (p=0.060) or sdLDL-C (p=0.067) for the adjusted HR ( Supplementary Tables 3 - 7 , Table 3 ) .
Fig.2. Hazard ratios for the development of IHD in quartiles of lipid fractions at baseline.
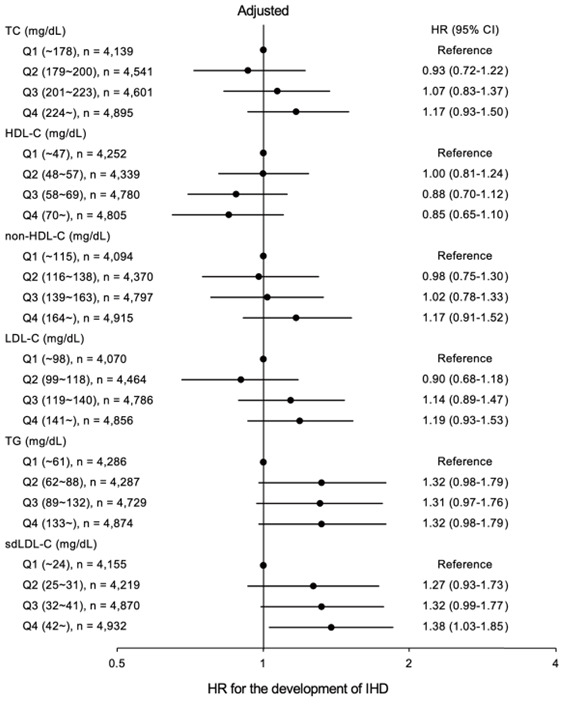
Forest plots of adjusted hazard ratios (HRs) and 95% confidence intervals (CIs) for the development of ischemic heart disease (IHD) in quartiles of total cholesterol (TC), high-density lipoprotein cholesterol (HDL-C), non-HDL-C, calculated low-density lipoprotein cholesterol (LDL-C), triglycerides (TG) and calculated small dense low-density lipoprotein cholesterol (sdLDL-C) at baseline analyzed by Cox proportional hazard models. Confounders including age, sex, obesity, smoking habit, family history of IHD, estimated glomerular filtration rate, hypertension and diabetes mellitus at baseline were adjusted.
During the follow-up period, lipid-lowering drugs were used in 2,950 subjects (16.2%, men/women: 1,194/956). When use of lipid-lowering drugs during follow-up period was additionally adjusted as a time-dependent confounder, there were no significant differences in HRs among the quartiles of sdLDL-C ( Supplementary Table 8 ) .
Supplementary Table 8. Multivariable Cox proportional hazard analyses for development of IHD in quartiles of sdLDL-C.
| Adjusted | ||
|---|---|---|
| HR (95% CI) | P | |
| Quartiles of sdLDL-C (mg/dL) | ||
| Q1 (~24), n= 4,155 | Reference | - |
| Q2 (25~31), n= 4,219 | 1.24 (0.91-1.69) | 0.164 |
| Q3 (32~41), n= 4,870 | 1.25 (0.93-1.69) | 0.129 |
| Q4 (42~), n= 4,932 | 1.26 (0.94-1.70) | 0.119 |
| Age | 1.06 (1.05-1.07) | <0.001 |
| Sex | 1.68 (1.35-2.08) | <0.001 |
| Obesity* | 1.42 (1.20-1.70) | <0.001 |
| Smoking habit | 1.18 (0.99-1.42) | 0.057 |
| Family history of IHD | 1.56 (1.24-1.97) | <0.001 |
| eGFR | 1.00 (0.99-1.01) | 0.921 |
| Hypertension | 1.43 (1.19-1.73) | <0.001 |
| Diabetes mellitus | 1.72 (1.33-2.23) | <0.001 |
| Lipid-lowing drugs** | 1.69 (1.37-2.07) | <0.001 |
| (AIC= 10,404) | ||
| Interaction [Sex-Quartiles of sdLDL-C] | 0.094 | |
*Body mass index ≥ 25.
**Use of lipid-lowing drugs during follow-up period as a time dependent confounder.
AIC, Akaike's information criterion; CI, confidence interval; eGFR, estimated glomerular filtration rate; HR, hazard ratio; IHD, ischemic heart disease; LDL-C, low-density lipoprotein cholesterol; sdLDL-C, small dense LDL-C.
Hazard Risks for New Onset of IHD by Levels of Lipid Fractions as Continuous Values at Baseline
In multivariable Cox proportional hazard models with a restricted cubic spline, HR for the development of IHD by TC after adjustment of age, sex, obesity, habits of smoking, family history of IHD, eGFR, diagnosis of hypertension and diabetes mellitus at baseline was not statistically significant ( Fig.3A ) . The adjusted HRs decreased with a higher HDL-C level ( Fig.3B ) and increased with higher levels of non-HDL-C ( Fig.3C ) and LDL-C ( Fig.3D ) at baseline. The adjusted HRs increased with a higher level of TG until up to about 150 mg/dL, but it was not constant with a higher TG level at baseline ( Fig. 3E ) . The adjusted HRs rapidly increased with a higher level of sdLDL-C up to 30 mg/dL and then slowly increased with a higher sdLDL-C level ( Fig.3F ) . Since there were no significant interactions of sex with the levels of TC (p=0.525), HDL-C (p=0.104), non-HDL-C (p=0.886), LDL-C (p=0.654), TG (p=0.450) or sdLDL-C (p=0.148) for the adjusted HRs, the analyses were performed in total subjects but not in subjects divided by sex.
Fig.3. Hazard ratios for the development of IHD by lipid fractions as continuous values at baseline.
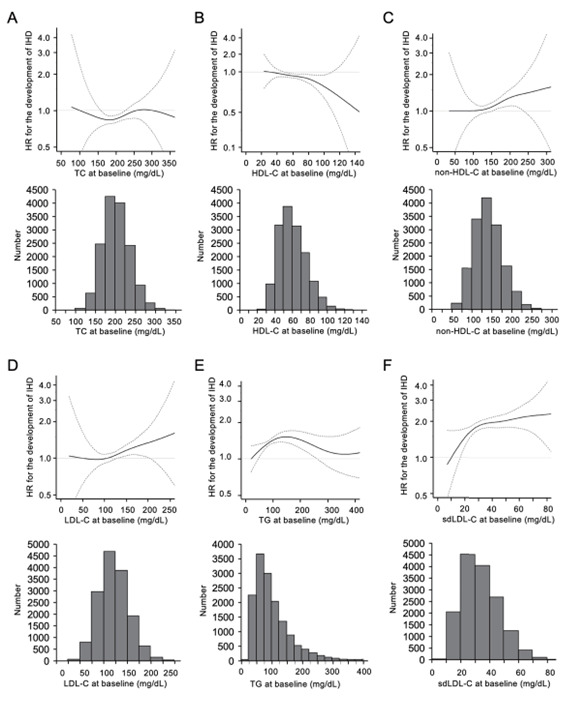
A-F. Hazard ratios (HRs) for the development of ischemic heart disease (IHD) by total cholesterol (TC) (A), high-density lipoprotein cholesterol (HDL-C) (B), non-HDL-C (C), calculated low-density lipoprotein cholesterol (LDL-C) (D), triglycerides (TG) (E), and calculated small dense LDL-C (sdLDL-C) (F) at baseline analyzed by multivariable Cox proportional hazard models with a restricted cubic spline after adjustment of age, sex, obesity, smoking habit, family history of IHD, estimated glomerular filtration rate, hypertension and diabetes mellitus at baseline. Histograms of levels of lipid fractions at baseline are also shown.
Solid line: HR; dashed line: 95% confidence interval. The reference values of TC, HDL-C, non-HDL-C, LDL-C, TG and sdLDL-C were 100 mg/dL, 20 mg/dL, 50 mg/dL, 50 mg/dL, 20 mg/dL and 10 mg/dL, respectively.
Discussion
In the present study, we showed that a high level of sdLDL-C calculated by Sampson’s equation was a significant risk factor for new onset of IHD during a 10-year period in a Japanese general population. ROC analysis showed that predictive ability for the development of IHD by calculated sdLDL-C (AUC [95% CI]: 0.60 [0.57-0.62]) was the highest among lipid fractions, and the cutoff point of sdLDL-C was 30 mg/dL ( Fig.1 ) . Multivariable Cox proportional hazard model analyses after adjustment of age, sex, obesity, smoking habit, family history of IHD, eGFR, hypertension and diabetes mellitus at baseline showed that HR in the Q4 group of sdLDL-C (1.38 [95% CI: 1.03-1.85]) was significantly higher than that in the Q1 group as the reference, though the adjusted HRs in quartiles of TC, HDL-C, non-HDL-C, LDL-C and TG were not statistically significant ( Fig.2 ) . Furthermore, in multivariable Cox proportional hazard models with a restricted cubic spline, the adjusted HR rapidly increased with a higher level of sdLDL-C until the sdLDL-C level of 30 mg/dL and then slowly increased with a higher level of sdLDL-C ( Fig.3 ) . The present study supports the notion that calculated sdLDL-C is a more predominant predictor than indices of conventional lipid fractions for the development of IHD.
It has been shown in epidemiological studies that directly measured sdLDL-C level is an independent risk factor for the development of IHD 7 , 21 , 22) . A recent meta-analysis of eight cohort studies showed that the relative risk for IHD comparing the top and bottom quartiles of sdLDL-C was 1.07 [95% CI: 1.01-1.12] 23) . In addition, it has recently been shown that a high level of sdLDL-C calculated by Sampson’s equation as a continuous variable was a stronger risk for atherosclerotic cardiovascular disease than levels of other lipid fractions including TC, LDL-C, non-HDL-C and TG in the Multi-Ethnic Study of Atherosclerosis (HR [95% CI]: 1.28 [1.18-1.38]) 14) . In the present study, we confirmed that both a high level of calculated sdLDL-C in categorized subgroups and the level as a continuous variable were associated with the risk for new onset of IHD. Taken together, sdLDL-C level calculated by Sampson’s equation as well as directly measured sdLDL-C level is a prominent risk predictor for the development of IHD. Moreover, the method for calculating sdLDL-C by utilizing levels of TC, HDL-C, and TG is a cost-effective and simple approach, making it clinically useful in risk assessment for IHD.
Multivariable Cox proportional hazards analyses in quartiles of the lipid fractions showed that TC, HDL-C, non-HDL-C, LDL-C and TG were not independent risk factors for IHD after adjustment of confounders in the present study ( Fig.2 ) , though those lipid fractions have been recognized as risk factors for cardiovascular disease in previous studies 1 - 3) . The discrepancy may be due to a type II error. In the design of this cohort, IHD was determined by an annually self-reported questionnaire and was not confirmed by coronary angiography or other modalities. Therefore, subjects who died of myocardial infarction, those who had a serious outcome, and those who visited a cardiologist for IHD may not have received an annual physical examination, resulting in an underestimation of the number of patients with IHD. On the other hand, a high level of calculated sdLDL-C was an independent risk for the development of IHD in the present study. The differential effects of sdLDL-C and other lipid fractions on new onset of IHD may be due to statistical variability. In multivariable Cox proportional hazard models with a restricted cubic spline, statistical dispersions of the adjusted HRs by TC, HDL-C, non-HDL-C, LDL-C and TG were larger than those of the adjusted HR by sdLDL-C ( Fig.3 ) . Therefore, sdLDL-C level may predict the development of IHD more accurately than the other lipid fractions.
After an additional adjustment for use of lipid-lowering drugs during the follow-up period as a time-dependent confounder, HRs in quartiles of sdLDL-C were comparable ( Supplementary Table 8 ) . On the other hand, use of lipid-lowering drugs during follow-up period was an independent risk factor for the development of IHD (HR [95%CI]: 1.69 [1.37-2.07]). Therefore, the influence of a high level of sdLDL-C for the development of IHD might be modified by use of lipid-lowering drugs.
In the present study, the cutoff point of calculated sdLDL-C by Sampson’s equation for predicting new onset of IHD was 30 mg/dL, which was slightly lower than that of directly measured sdLDL-C (35 mg/dL) as previously reported 24 , 25) . The level of sdLDL-C calculated by Sampson’s equation was reported to have a strong correlation coefficient (R2=0.73) with directly measured values of sdLDL-C in 20,171 subjects of the United States 14) . A recent validation study using a small number of Japanese subjects (n=673) also showed that there was a similarly high correlation between direct and calculated levels of sdLDL-C (R2=0.73) 26) . In the previous study 14) , a regression equation between direct and calculated levels of sdLDL-C was shown as the following formula: calculated level of sdLDL-C (mg/dL)=0.73×directly measured level of sdLDL-C (md/dL)+9.40. Considering the regression equation, the calculated sdLDL-C level tended to be lower than the directly measured sdLDL-C level. This would be a reason for the difference between the cutoff points for new onset of IHD of the directly measured and calculated levels of sdLDL-C. Further validation studies using a large number of subjects of different races are needed to determine the appropriate cutoff point of calculated sdLDL-C level.
Several mechanisms of the impact of sdLDL-C on atherosclerotic cardiovascular disease have been proposed. First, it has been reported that sdLDL particles have a lower affinity for the LDL receptor than do large LDL particles, resulting in a longer residence time in blood 4 , 27) . Second, because of their small size, sdLDL particles can easily infiltrate the vascular wall 4) . Third, sdLDL-C is easily oxidized and can be taken up by macrophages, leading to the formation of foam cells, plaque formation and chronic inflammation in the arterial wall 28 - 30) . Considering the mechanisms, the level of sdLDL-C, even its calculated value, would a potent risk factor for several atherosclerotic cardiovascular diseases other than IHD.
The present study has some limitations. First, since the study subjects only consisted of individuals who received a yearly medical checkup at a single urban clinic, the possibility of selection bias cannot be ruled out. In addition, most of the subjects in the present study were employees of companies and their family members. Employees in Japan often move from one city to another because of a change in the office or company. Decreased number of subjects during follow-up might also be biased. Second, information on precise dietary habits and exercise, which may affect events of cardiovascular disease, was not available in the present study. Third, since subjects who had TG ≥ 800 mg/dL (n=37) were excluded in order to calculate LDL-C by Sampson’s equation, the impact of extreme hypertriglyceridemia on IHD could not be investigated. In addition, directly measured sdLDL-C level was not directly measured. Fourth, although risk factors for IHD at baseline were adjusted in multivariable Cox proportional hazard models, those risk factors during the follow-up period were not included for the adjustment in models. Fifth, insulin resistance, accumulation of remnant lipoproteins and increased sdLDL-C have been reported to be closely related 31) . Although the presence of diabetes mellitus was adjusted for multivariable Cox proportional hazard models ( Fig.2 , Table 3 , Supplementary Tables 3 - 8 ) , the relationship of insulin resistance with lipid fractions including sdLDL-C and the development of IHD could not be investigated because of no measurement of insulin level in the present study. Finally, IHD was determined by using only a self-reported questionnaire in the present study.
In conclusion, sdLDL-C level calculated by Sampson’s equation is a more predominant predictor than indices of conventional lipid fractions for the development of IHD. A further understanding of the mechanism of the link between calculated sdLDL-C and IHD may enable the development of new therapeutic strategies for prevention of IHD.
Conflicts of Interest
The authors declare that they have no competing interests.
Financial Support
M.T. and M.F. were supported by grants from Japan Society for the Promotion of Science (19K08708, 20K08913, 22K08313).
Authors’ Contributions
M.I., M.T and M.F. designed the study, performed data collection and statistical analyses, and wrote the paper. T.S., K.E., K.M., I.H., T.M. and A.U. performed data collection and discussed the data. N.H. performed data collection. Y.A. and H.O. performed statistical analyses and supervised the analyses. All authors approved the final version of manuscript.
Acknowledgements
The authors are grateful to Keita Numata and Takashi Hisasue for data management.
References
- 1).Visseren FLJ, Mach F, Smulders YM, Carballo D, Koskinas KC, Back M, Benetos A, Biffi A, Boavida JM, Capodanno D, Cosyns B, Crawford C, Davos CH, Desormais I, Di Angelantonio E, Franco OH, Halvorsen S, Hobbs FDR, Hollander M, Jankowska EA, Michal M, Sacco S, Sattar N, Tokgozoglu L, Tonstad S, Tsioufis KP, van Dis I, van Gelder IC, Wanner C, Williams B, Societies ESCNC, Group ESCSD: 2021 ESC Guidelines on cardiovascular disease prevention in clinical practice. Eur Heart J, 2021; 42: 3227-3337 [Google Scholar]
- 2).Grundy SM, Stone NJ, Bailey AL, Beam C, Birtcher KK, Blumenthal RS, Braun LT, de Ferranti S, Faiella-Tommasino J, Forman DE, Goldberg R, Heidenreich PA, Hlatky MA, Jones DW, Lloyd-Jones D, Lopez-Pajares N, Ndumele CE, Orringer CE, Peralta CA, Saseen JJ, Smith SC, Jr., Sperling L, Virani SS, Yeboah J: 2018 AHA/ACC/AACVPR/AAPA/ABC/ACPM/ADA/AGS/APhA/ASPC/NLA/PCNA Guideline on the Management of Blood Cholesterol: Executive Summary: A Report of the American College of Cardiology/American Heart Association Task Force on Clinical Practice Guidelines. Circulation, 2019; 139: e1046-e1081 [DOI] [PubMed] [Google Scholar]
- 3).Mach F, Baigent C, Catapano AL, Koskinas KC, Casula M, Badimon L, Chapman MJ, De Backer GG, Delgado V, Ference BA, Graham IM, Halliday A, Landmesser U, Mihaylova B, Pedersen TR, Riccardi G, Richter DJ, Sabatine MS, Taskinen MR, Tokgozoglu L, Wiklund O, Group ESCSD: 2019 ESC/EAS Guidelines for the management of dyslipidaemias: lipid modification to reduce cardiovascular risk. Eur Heart J, 2020; 41: 111-188 [DOI] [PubMed] [Google Scholar]
- 4).Berneis KK, Krauss RM: Metabolic origins and clinical significance of LDL heterogeneity. J Lipid Res, 2002; 43: 1363-1379 [DOI] [PubMed] [Google Scholar]
- 5).Friedewald WT, Levy RI, Fredrickson DS: Estimation of the concentration of low-density lipoprotein cholesterol in plasma, without use of the preparative ultracentrifuge. Clin Chem, 1972; 18: 499-502 [PubMed] [Google Scholar]
- 6).Sampson M, Ling C, Sun Q, Harb R, Ashmaig M, Warnick R, Sethi A, Fleming JK, Otvos JD, Meeusen JW, Delaney SR, Jaffe AS, Shamburek R, Amar M, Remaley AT: A New Equation for Calculation of Low-Density Lipoprotein Cholesterol in Patients With Normolipidemia and/or Hypertriglyceridemia. JAMA Cardiol, 2020; 5: 540-548 [DOI] [PMC free article] [PubMed] [Google Scholar]
- 7).Hirano T: Pathophysiology of Diabetic Dyslipidemia. J Atheroscler Thromb, 2018; 25: 771-782 [DOI] [PMC free article] [PubMed] [Google Scholar]
- 8).Krauss RM: Small dense low-density lipoprotein particles: clinically relevant? Curr Opin Lipidol, 2022; 33: 160-166 [DOI] [PMC free article] [PubMed] [Google Scholar]
- 9).Austin MA, King MC, Vranizan KM, Krauss RM: Atherogenic lipoprotein phenotype. A proposed genetic marker for coronary heart disease risk. Circulation, 1990; 82: 495-506 [DOI] [PubMed] [Google Scholar]
- 10).McNamara JR, Small DM, Li Z, Schaefer EJ: Differences in LDL subspecies involve alterations in lipid composition and conformational changes in apolipoprotein B. J Lipid Res, 1996; 37: 1924-1935 [PubMed] [Google Scholar]
- 11).Hirano T, Ito Y, Yoshino G: Measurement of small dense low-density lipoprotein particles. J Atheroscler Thromb, 2005; 12: 67-72 [DOI] [PubMed] [Google Scholar]
- 12).Ito Y, Fujimura M, Ohta M, Hirano T: Development of a homogeneous assay for measurement of small dense LDL cholesterol. Clin Chem, 2011; 57: 57-65 [DOI] [PubMed] [Google Scholar]
- 13).Hayashi T, Koba S, Ito Y, Hirano T: Method for estimating high sdLDL-C by measuring triglyceride and apolipoprotein B levels. Lipids Health Dis, 2017; 16: 21 [DOI] [PMC free article] [PubMed] [Google Scholar]
- 14).Sampson M, Wolska A, Warnick R, Lucero D, Remaley AT: A New Equation Based on the Standard Lipid Panel for Calculating Small Dense Low-Density Lipoprotein-Cholesterol and Its Use as a Risk-Enhancer Test. Clin Chem, 2021; 67: 987-997 [DOI] [PMC free article] [PubMed] [Google Scholar]
- 15).Matsuo S, Imai E, Horio M, Yasuda Y, Tomita K, Nitta K, Yamagata K, Tomino Y, Yokoyama H, Hishida A, Collaborators developing the Japanese equation for estimated GFR: Revised equations for estimated GFR from serum creatinine in Japan. Am J Kidney Dis, 2009; 53: 982-992 [DOI] [PubMed] [Google Scholar]
- 16).Examination Committee of Criteria for ‘Obesity Disease’ in J, Japan Society for the Study of O: New criteria for ‘obesity disease’ in Japan. Circ J, 2002; 66: 987-992 [DOI] [PubMed] [Google Scholar]
- 17).Umemura S, Arima H, Arima S, Asayama K, Dohi Y, Hirooka Y, Horio T, Hoshide S, Ikeda S, Ishimitsu T, Ito M, Ito S, Iwashima Y, Kai H, Kamide K, Kanno Y, Kashihara N, Kawano Y, Kikuchi T, Kitamura K, Kitazono T, Kohara K, Kudo M, Kumagai H, Matsumura K, Matsuura H, Miura K, Mukoyama M, Nakamura S, Ohkubo T, Ohya Y, Okura T, Rakugi H, Saitoh S, Shibata H, Shimosawa T, Suzuki H, Takahashi S, Tamura K, Tomiyama H, Tsuchihashi T, Ueda S, Uehara Y, Urata H, Hirawa N: The Japanese Society of Hypertension Guidelines for the Management of Hypertension (JSH 2019). Hypertens Res, 2019; 42: 1235-1481 [DOI] [PubMed] [Google Scholar]
- 18).Araki E, Goto A, Kondo T, Noda M, Noto H, Origasa H, Osawa H, Taguchi A, Tanizawa Y, Tobe K, Yoshioka N: Japanese Clinical Practice Guideline for Diabetes 2019. J Diabetes Investig, 2020; 11: 1020-1076 [DOI] [PMC free article] [PubMed] [Google Scholar]
- 19).Schisterman EF, Perkins NJ, Liu A, Bondell H: Optimal cut-point and its corresponding Youden Index to discriminate individuals using pooled blood samples. Epidemiology, 2005; 16: 73-81 [DOI] [PubMed] [Google Scholar]
- 20).Kanda Y: Investigation of the freely available easy-to-use software ‘EZR’ for medical statistics. Bone Marrow Transplant, 2013; 48: 452-458 [DOI] [PMC free article] [PubMed] [Google Scholar]
- 21).Jin X, Yang S, Lu J, Wu M: Small, Dense Low-Density Lipoprotein-Cholesterol and Atherosclerosis: Relationship and Therapeutic Strategies. Front Cardiovasc Med, 2021; 8: 804214 [DOI] [PMC free article] [PubMed] [Google Scholar]
- 22).Superko H, Garrett B: Small Dense LDL: Scientific Background, Clinical Relevance, and Recent Evidence Still a Risk Even with ‘Normal’ LDL-C Levels. Biomedicines, 2022; 10: [DOI] [PMC free article] [PubMed] [Google Scholar]
- 23).Liou L, Kaptoge S: Association of small, dense LDL-cholesterol concentration and lipoprotein particle characteristics with coronary heart disease: A systematic review and meta-analysis. PLoS One, 2020; 15: e0241993 [DOI] [PMC free article] [PubMed] [Google Scholar]
- 24).Higashioka M, Sakata S, Honda T, Hata J, Yoshida D, Hirakawa Y, Shibata M, Goto K, Kitazono T, Osawa H, Ninomiya T: Small Dense Low-Density Lipoprotein Cholesterol and the Risk of Coronary Heart Disease in a Japanese Community. J Atheroscler Thromb, 2020; 27: 669-682 [DOI] [PMC free article] [PubMed] [Google Scholar]
- 25).Higashioka M, Sakata S, Honda T, Hata J, Shibata M, Yoshida D, Goto K, Kitazono T, Osawa H, Ninomiya T: The Association of Small Dense Low-Density Lipoprotein Cholesterol and Coronary Heart Disease in Subjects at High Cardiovascular Risk. J Atheroscler Thromb, 2021; 28: 79-89 [DOI] [PMC free article] [PubMed] [Google Scholar]
- 26).Hirano T, Ito Y: Accuracy of Small Dense Low-density Lipoprotein-cholesterol Concentration Estimated via Sampson’s Equation in Healthy Subjects and Patients with Diabetes. J Atheroscler Thromb, 2023; 30: 979-989 [DOI] [PMC free article] [PubMed] [Google Scholar]
- 27).Packard CJ, Demant T, Stewart JP, Bedford D, Caslake MJ, Schwertfeger G, Bedynek A, Shepherd J, Seidel D: Apolipoprotein B metabolism and the distribution of VLDL and LDL subfractions. J Lipid Res, 2000; 41: 305-318 [PubMed] [Google Scholar]
- 28).Chancharme L, Therond P, Nigon F, Lepage S, Couturier M, Chapman MJ: Cholesteryl ester hydroperoxide lability is a key feature of the oxidative susceptibility of small, dense LDL. Arterioscler Thromb Vasc Biol, 1999; 19: 810-820 [DOI] [PubMed] [Google Scholar]
- 29).Goulinet S, Chapman MJ: Plasma LDL and HDL subspecies are heterogenous in particle content of tocopherols and oxygenated and hydrocarbon carotenoids. Relevance to oxidative resistance and atherogenesis. Arterioscler Thromb Vasc Biol, 1997; 17: 786-796 [DOI] [PubMed] [Google Scholar]
- 30).Antunes BM, Cayres SU, Lira FS, Fernandes RA: Arterial Thickness and Immunometabolism: The Mediating role of Chronic Exercise. Curr Cardiol Rev, 2016; 12: 47-51 [DOI] [PMC free article] [PubMed] [Google Scholar]
- 31).Izumida T, Nakamura Y, Hino Y, Ishikawa S: Combined Effect of Small Dense Low-Density Lipoprotein Cholesterol (sdLDL-C) and Remnant-Like Particle Cholesterol (RLP-C) on Low-Grade Inflammation. J Atheroscler Thromb, 2020; 27: 319-330 [DOI] [PMC free article] [PubMed] [Google Scholar]