

This diagnostic accuracy study examines whether deep learning models using 12-lead electrocardiography (ECG) can improve the detection of congenital long QT syndrome (LQTS) and differentiate between LQTS genotypes.
Key Points
Question
Can deep learning models using 12-lead electrocardiography improve the detection of congenital long QT syndrome (LQTS) and differentiate between LQTS genotypes?
Findings
In this multicenter diagnostic accuracy study of 4521 ECGs from 990 patients, a deep learning convolutional neural network (CNN) method was able to detect LQTS and distinguish between the 2 most common genotypes. The CNN model outperformed corrected QT intervals manually measured by arrhythmia experts, including in patients with normal or borderline corrected QT intervals (ie, concealed LQTS).
Meaning
The findings suggest that the CNN method improves detection of congenital LQTS, including concealed LQTS, and can distinguish between the 2 most common genetic subtypes.
Abstract
Importance
Congenital long QT syndrome (LQTS) is associated with syncope, ventricular arrhythmias, and sudden death. Half of patients with LQTS have a normal or borderline-normal QT interval despite LQTS often being detected by QT prolongation on resting electrocardiography (ECG).
Objective
To develop a deep learning–based neural network for identification of LQTS and differentiation of genotypes (LQTS1 and LQTS2) using 12-lead ECG.
Design, Setting, and Participants
This diagnostic accuracy study used ECGs from patients with suspected inherited arrhythmia enrolled in the Hearts in Rhythm Organization Registry (HiRO) from August 2012 to December 2021. The internal dataset was derived at 2 sites and an external validation dataset at 4 sites within the HiRO Registry; an additional cross-sectional validation dataset was from the Montreal Heart Institute. The cohort with LQTS included probands and relatives with pathogenic or likely pathogenic variants in KCNQ1 or KCNH2 genes with normal or prolonged corrected QT (QTc) intervals.
Exposures
Convolutional neural network (CNN) discrimination between LQTS1, LQTS2, and negative genetic test results.
Main Outcomes and Measures
The main outcomes were area under the curve (AUC), F1 scores, and sensitivity for detecting LQTS and differentiating genotypes using a CNN method compared with QTc-based detection.
Results
A total of 4521 ECGs from 990 patients (mean [SD] age, 42 [18] years; 589 [59.5%] female) were analyzed. External validation within the national registry (101 patients) demonstrated the CNN’s high diagnostic capacity for LQTS detection (AUC, 0.93; 95% CI, 0.89-0.96) and genotype differentiation (AUC, 0.91; 95% CI, 0.86-0.96). This surpassed expert-measured QTc intervals in detecting LQTS (F1 score, 0.84 [95% CI, 0.78-0.90] vs 0.22 [95% CI, 0.13-0.31]; sensitivity, 0.90 [95% CI, 0.86-0.94] vs 0.36 [95% CI, 0.23-0.47]), including in patients with normal or borderline QTc intervals (F1 score, 0.70 [95% CI, 0.40-1.00]; sensitivity, 0.78 [95% CI, 0.53-0.95]). In further validation in a cross-sectional cohort (406 patients) of high-risk patients and genotype-negative controls, the CNN detected LQTS with an AUC of 0.81 (95% CI, 0.80-0.85), which was better than QTc interval–based detection (AUC, 0.74; 95% CI, 0.69-0.78).
Conclusions and Relevance
The deep learning model improved detection of congenital LQTS from resting ECGs and allowed for differentiation between the 2 most common genetic subtypes. Broader validation over an unselected general population may support application of this model to patients with suspected LQTS.
Introduction
Congenital long QT syndrome (LQTS) is a cardiac ion channelopathy associated with syncope, polymorphic ventricular tachycardia, and rarely, sudden arrhythmic death.1 While often detected by QT prolongation on resting electrocardiography (ECG), 30% to 50% of patients have a normal or borderline QT interval (ie, concealed LQTS), making resting ECG a poor screening test.2 Provocative testing with exercise treadmill ECG is useful in unmasking the LQTS phenotype but requires expertise in interpreting the test results.3
Genetic testing is currently a cornerstone for diagnosis of LQTS. A positive result is present in 80% of patients with a definite diagnosis of LQTS.4 Most genotype-positive cases (90%-95%) have culprit variants in the KCNQ1 or KCNH2 genes.1 Identification of a positive genotype in a patient has implications for their risk of arrhythmias, lifestyle recommendations, genetic counseling, and pharmacologic therapy.4 With therapies including lifestyle modification, β-blockade, left cardiac sympathectomy, and implanted cardioverter/defibrillator implantation in select patients, excellent outcomes have been achieved in the management of LQTS.5
Recently, different machine learning (ML) approaches, including support vector machines and convolutional neural networks (CNNs), have been applied to the detection of LQTS on ECGs.6,7,8,9 Building on existing approaches, we aimed to develop a CNN model that could detect LQTS on baseline ECGs. We tested our model on a large and ethnically diverse group of patients who were referred to quaternary centers for screening of suspected LQTS based on phenotype or family history. The study included a broadly representative population-based group of patients with milder forms of LQTS, which is more representative of the broader population with LQTS. We designed our model to differentiate between the most common LQTS genetic types, specifically those involving variants in KCNQ1 or KCNH2.
Methods
Registry Data and Ethics
In this diagnostic accuracy study, participants of all ages were recruited from the National Hearts in Rhythm Organization (HiRO) Registry. The HiRO Registry enrolls patients with inherited arrhythmias and cardiomyopathies and their unaffected relatives from 25 inherited arrhythmia or cardiogenetics centers.10,11 Ethical approval for this study was obtained from the University of British Columbia and Providence Health Care research ethics boards, and all participants provided written informed consent. The study followed the Standards for Reporting of Diagnostic Accuracy (STARD) reporting guideline.
Study Populations
Populations consisted of the HiRO Registry cohort (divided into the derivation, internal validation, and external validation datasets) and an external Montreal Heart Institute (MHI) cohort with distinct and nonoverlapping sets of patients. The internal dataset consisted of ECGs from 2 sites (University of British Columbia Hospital and British Columbia Children’s Hospital). The external validation dataset included ECGs from patients enrolled in HiRO at 4 external sites (Quebec Heart and Lung Institute, MHI, Stollery Children’s Hospital, and McGill University Health Centre).
HiRO Study Population
Participants enrolled between August 2012 and December 2021 were included in this study. Electrocardiograms from the time of diagnosis were submitted into the registry, including those obtained prior to the date of enrollment. The cohort with LQTS consisted of probands and their relatives identified to have a pathogenic or likely pathogenic variant in the KCNQ1 (LQT1) or KCNH2 (LQT2) genes and at least 1 digital ECG (XML format) available. Genetic testing was performed on a clinical basis and ranged from familial variant testing to broad panels at the discretion of the clinical care team. Participants identified to be homozygous or compound heterozygous for variants in the KCNQ1 or KCNH2 genes and those with pathogenic or likely pathogenic variants in more than 1 gene were excluded from the study. The control group was composed of first-degree relatives of patients with inherited arrhythmia, cardiomyopathy, unexplained cardiac arrest, or sudden cardiac death enrolled in the HiRO Registry who either tested negative for a known familial variant or had no phenotypic evidence of disease following evaluation in a HiRO clinic. First-degree relatives of gene-negative LQTS probands were excluded from the control group. A subset of ECGs had the QT interval manually measured by an expert (A.K.) in inherited arrhythmias. The ECGs were reviewed and excluded if the file was corrupt, missing, or duplicated; if there was a noisy or wandering lead; or if data for 1 or more of the leads were missing. The internal dataset was randomly divided 90%/10% into training and internal validation datasets with distinct, nonoverlapping sets of patients.
MHI Study Population
The performance and clinical utility of the model were assessed in a second external dataset consisting of consecutive patients referred to the MHI cardiovascular genetics clinic for suspected LQTS with an available ECG and genetic testing. Patients from MHI who were included in the HiRO cohort were excluded. Genetic testing included sequencing of all exons and flanking regions of both KCNQ1 and KCNH2 (for index cases) or the familial LQTS-causing genetic variant (for relatives). Variants of uncertain significance in KCNQ1 or KCNH2 were further curated by LQTS genetics experts (S.G., R.T.) and categorized as either strong variant of uncertain significance (VUS) or weak VUS. Patients with a strong VUS were considered as cases with congenital LQTS, while those with weak VUS were considered as control individuals.
ECG Data Processing
The 12-lead 10-second ECG recordings sampled at 250 or 500 Hz were acquired in commonly available XML file formats. The ECG signals were resampled to a common frequency (250 Hz) over a 10-second recording, and voltages were normalized on a per-ECG basis.
Model Architecture and Training
Python, version 3.9.15 (Python Software Foundation); tensorflow, version 2.9.0 (Google LLC); keras, version 2.9.0 (Google LLC); pandas, version 1.5.2 (NumFOCUS, Inc); statsmodels, version 0.14.0 (Josef Perktold, Skipper Seabold, Jonathan Taylor, and open-source contributors); and sklearn, version 1.2.0 (scikit-learn team and open-source contributors) were used. A CNN model was trained to predict the presence of either LQTS type 1 or type 2. Hyperparameter search was performed using bayesian optimization tracked with a commercial platform (CometML). The model architecture is detailed in eFigures 1 and 2 in Supplement 1. Batch sizes of 16, 32, or 64 and epoch values ranging from 20 to 800 were used. Based on search results (eTable 1 in Supplement 1), we chose a ResNetv2 architecture, batch size of 32, and 719 epochs.
Statistical Analysis
Baseline characteristics between the subgroups were compared using analysis of variance and Tukey honestly significant difference tests. We assessed the performance of the model using area under the curve (AUC), sensitivity, specificity (using Youden J index), positive predictive value (PPV), F1 score (the harmonic mean of the sensitivity and PPV), and precision-recall curve. Performance was described at the patient level by averaging predictions across all ECGs for each patient.
Bootstrapping over 5000 samples was used to calculate the 95% CI. We also evaluated test characteristics, stratified based on sex, ethnicity, and QT interval. Ethnicity categories included East Asian (Chinese, Filipino, Japanese, Korean, and Southeast Asian), Indigenous, White, and other (Arab or West Asian, Black, Latin American, and South Asian). Ethnicity was collected from the family pedigree documented in the patient’s clinical medical record (self-reported). Ethnicity was included in the analysis to ensure that we have an ethnically diverse dataset for evaluation of the external validity of our results. Moreover, LQTS is associated with certain ethnicities (eg, in certain Indigenous populations). For a subset of ECGs for which a corrected QT (QTc) interval manually measured by an arrhythmia expert was available, we calculated the F1 score and sensitivity. The QTc interval was considered normal if less than 450 milliseconds in men or less than 460 milliseconds in women, borderline if 450 to 469 milliseconds in men or 460 to 479 milliseconds in women, and prolonged if 470 milliseconds or greater in men or 480 milliseconds or greater in women. The AUC could not be calculated for whether the expert-measured QTc was prolonged, so the F1 scores and sensitivities were used.
Results
Study Population
Of 4595 ECGs from 1010 patients, 74 ECGs from 20 patients were excluded due to poor quality; the study dataset consisted of 4521 ECGs representing 990 unique patients (Figure 1). Baseline demographic and ECG characteristics for the derivation and validation subgroups are presented in Table 1 (and eTable 2 and eTable 3 in Supplement 1). Of the 990 patients, 589 (59.5%) were female and 401 (40.5%) were male; mean (SD) age was 42 (18) years. A total of 88 (8.9%) were East Asian; 64 (6.5%), Indigenous; 722 (73.1%), White; and 114 (11.5%), other ethnicity. Patients in the derivation and internal validation datasets, which were randomly split from the internal dataset, had similar age, sex, ethnicity, heart rate, and QTc intervals. The second external validation dataset (MHI; 3491 ECGs from 406 individuals) was larger than the HiRO Registry population and represented an undifferentiated general referral population. The QTc intervals in the genotype-negative controls in the secondary dataset were significantly longer than those for patients in the primary dataset (Table 1 and eFigure 8 in Supplement 1); the QTc intervals for the genotype-positive patients were similar between the groups. The second dataset also included higher proportions of adult patients (aged >18 years; with fewer pediatric patients aged <18 years), women, and White patients.
Figure 1. Diagram of Study Electrocardiographic (ECG) Datasets.
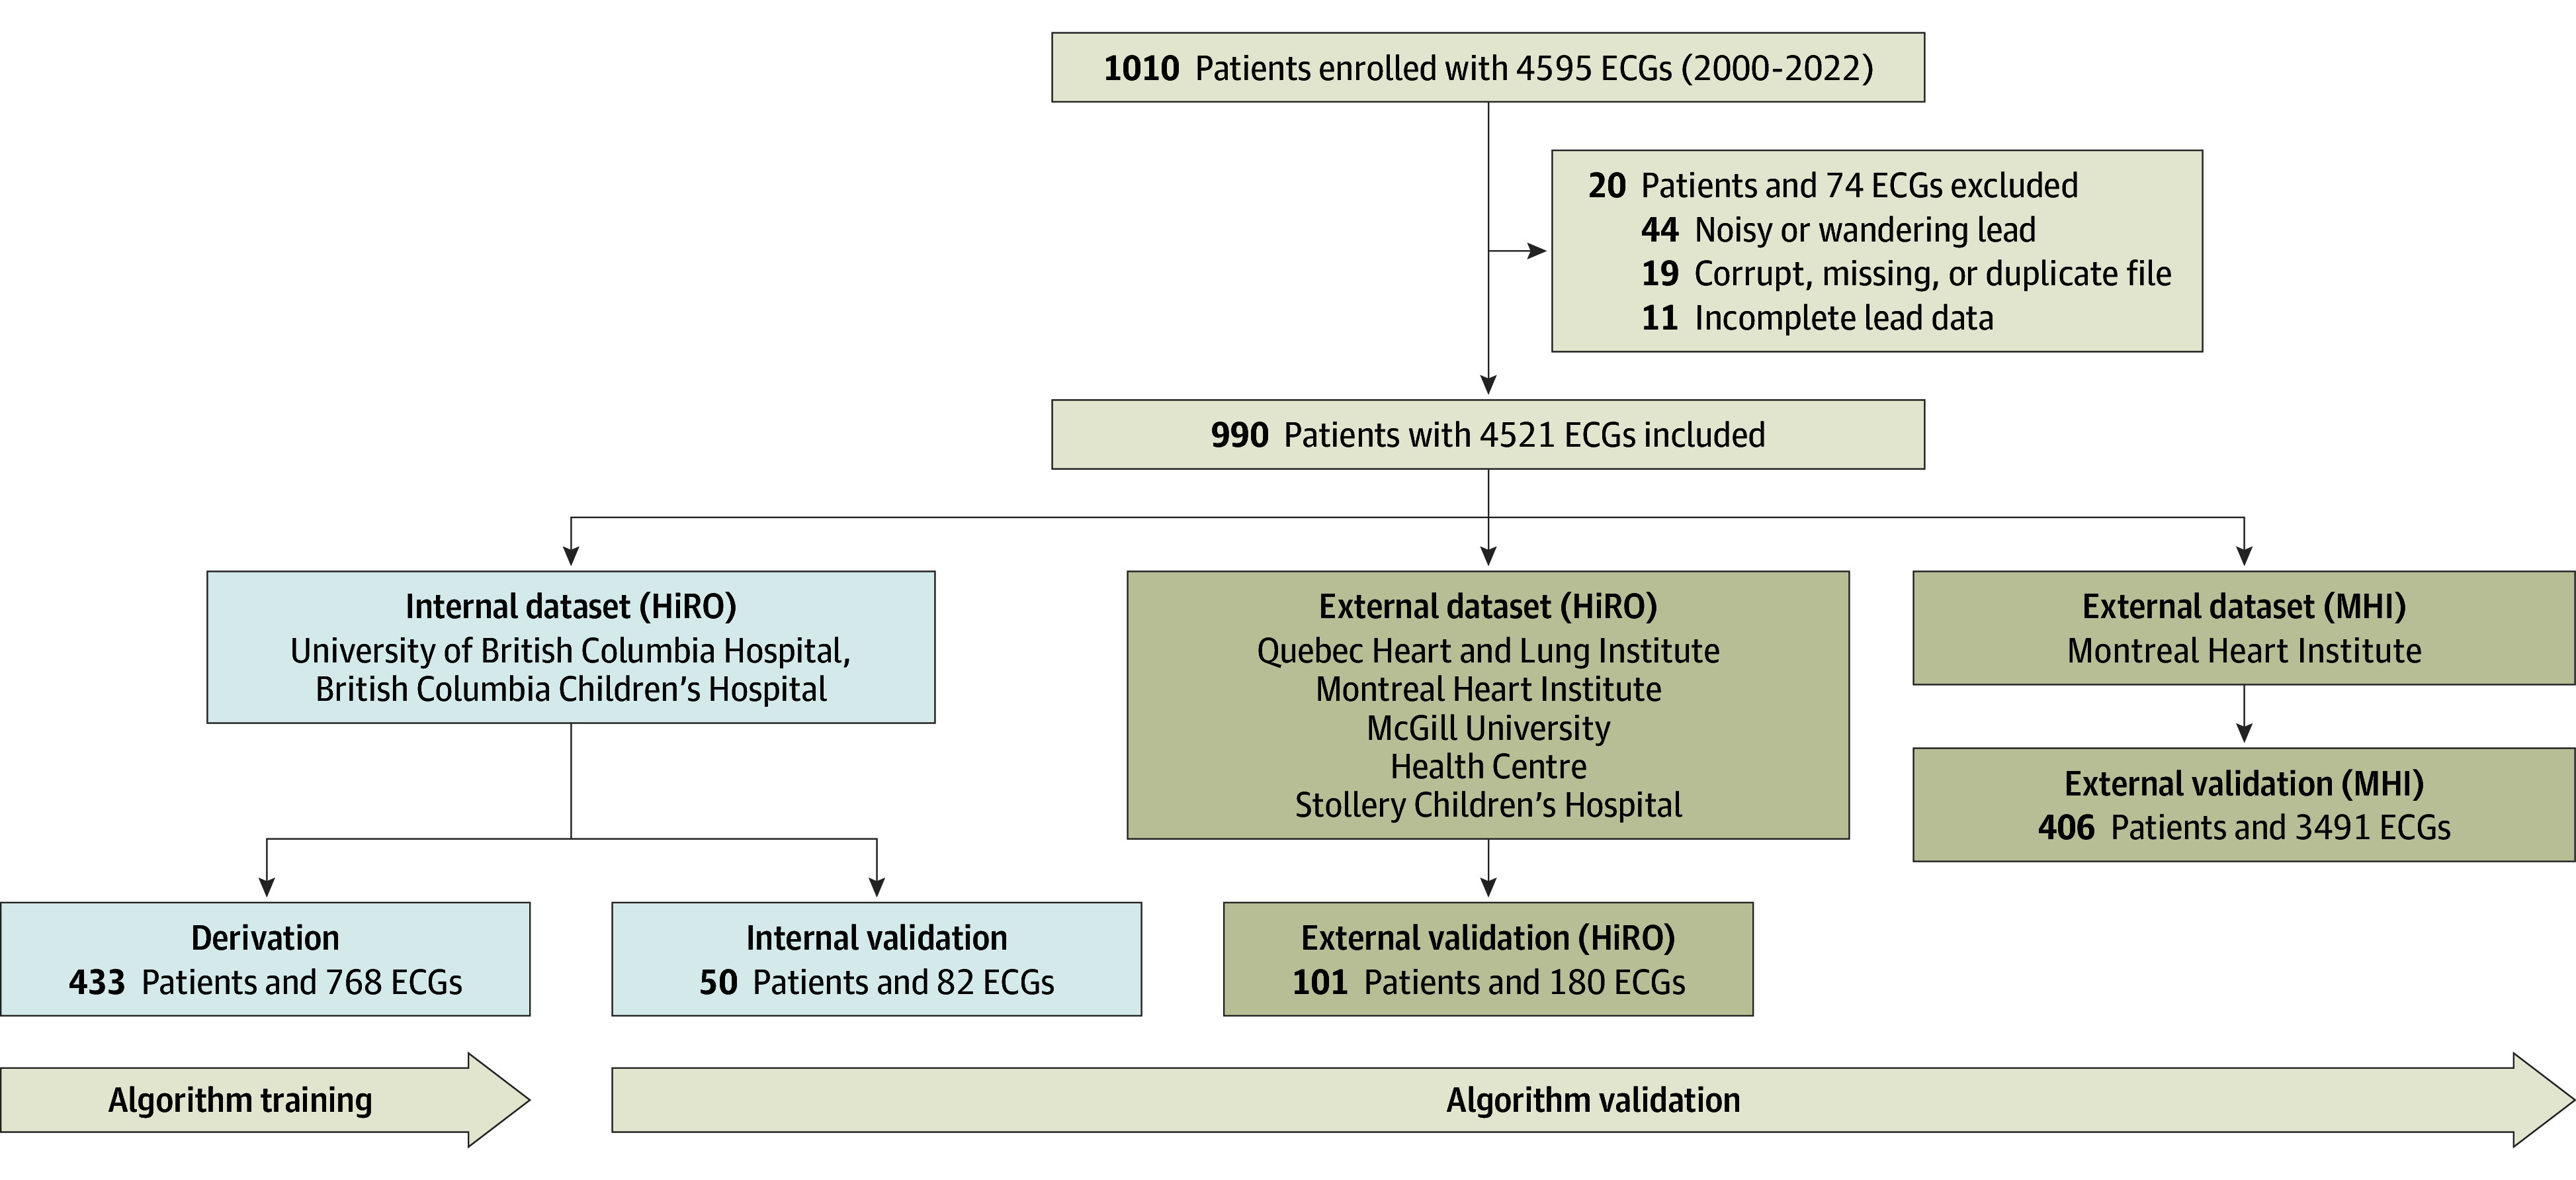
Derivation and internal validation datasets were randomly split from the internal dataset, with nonoverlapping groups of patients. Additional demographic information for each dataset is shown in Table 1. HiRO indicates Hearts in Rhythm Organization; MHI, Montreal Heart Institute.
Table 1. Baseline Characteristics of the Study Population.
| Characteristic | Patientsa | ||||
|---|---|---|---|---|---|
| Total (N = 990) | Derivation (n = 433) | HiRO internal validation (n = 50) | HiRO external validation (n = 101) | MHI external validation (n = 406) | |
| Age, mean (SD), y | 42 (18) | 39 (19) | 42 (20) | 40 (21) | 46 (16) |
| Age <18 y | 106 (10.7) | 70 (16.2) | 6 (12.0) | 18 (17.8) | 12 (3.0) |
| Sex | |||||
| Female | 589 (59.5) | 251 (58.0) | 25 (50.0) | 53 (52.5) | 260 (64.0) |
| Male | 401 (40.5) | 182 (42.0) | 25 (50.0) | 48 (47.5) | 146 (36.0) |
| Ethnicity | |||||
| East Asianb | 88 (8.9) | 71 (16.4) | 8 (16.0) | 1 (1.0) | 8 (2.0) |
| Indigenous | 64 (6.5) | 53 (12.2) | 3 (6.0) | 4 (4.0) | 4 (1.0) |
| White | 722 (73.1) | 245 (56.6) | 32 (64.0) | 82 (81.2) | 363 (89.9) |
| Otherc | 114 (11.5) | 64 (14.8) | 7 (14.0) | 14 (13.9) | 29 (7.2) |
| ECGs per patient, mean No. (95% CI) | 4.6 (1-29) | 1.8 (1-4) | 1.6 (1-4) | 1.8 (1-4) | 8.6 (1-38) |
| Heart rate, mean (SD), /min | 69 (12) | 69 (13) | 70 (14) | 67 (14) | 69 (12) |
| QTc intervald | |||||
| Mean (SD), milliseconds | 444 (37) | 438 (36) | 443 (37) | 449 (37) | 449 (37) |
| Normal | 649 (65.6) | 318 (73.4) | 34 (68.0) | 56 (55.4) | 241 (59.4) |
| Borderline | 188 (19.0) | 64 (14.8) | 8 (16.0) | 24 (23.8) | 92 (22.7) |
| Prolonged | 153 (15.5) | 51 (11.8) | 8 (16.0) | 21 (20.8) | 73 (18.0) |
Abbreviations: ECG, electrocardiogram; HiRO, Hearts in Rhythm Organization; MHI, Montreal Heart Institute; QTc, corrected QT.
Data are presented as number (percentage) of patients unless otherwise indicated.
Includes Chinese, Filipino, Japanese, Korean, and Southeast Asian.
Includes Arab or West Asian, Black, Latin American, and South Asian.
QT intervals manually measured by an expert in inherited arrhythmias. Normal QTc interval was less than 450 milliseconds (men) or less than 460 milliseconds (women); borderline, 450 to 469 milliseconds (men) or 460 to 479 milliseconds (women); and prolonged, 470 milliseconds or greater (men) or 480 milliseconds or greater (women).
Model Performance
Based on the average QTc interval, patients were identified to have congenital LQTS with an overall AUC of 0.74 (95% CI, 0.69-0.78). The CNN model was able to distinguish LQTS with an overall AUC of 0.81 (95% CI, 0.80-0.85) across all validation datasets (Figure 2). The CNN model was able to distinguish LQTS in cases of concealed LQTS also, with an overall AUC of 0.78 (95% CI, 0.72-0.83) (Figure 2 and eFigure 4 in Supplement 1). By definition, the QTc interval was unable to detect any cases of concealed LQTS. The model showed increased discriminatory capacity in the internal (AUC, 0.95; 95% CI, 0.90-1.00) and validation datasets (AUC, 0.93; 95% CI, 0.89-0.96) compared with the second external validation dataset (AUC, 0.78; 95% CI, 0.76-0.80) (Figure 3 and eFigure 3 in Supplement 1), reflecting the differences between a select high-risk mendelian population and an at-risk general population.
Figure 2. Performance of a Deep Learning Model for Congenital Long QT Syndrome (LQTS) and Concealed LQTS Detection.

A, Performance of the deep learning convolutional neural network (CNN) model vs corrected QT (QTc) intervals manually measured by arrhythmia experts to distinguish patients with LQTS from patients without LQTS. B, Performance of the CNN model to distinguish patients with concealed LQTS (QTc <470 milliseconds in men or <480 milliseconds in women).
Figure 3. Performance of a Deep Learning Model for Congenital Long QT Syndrome (LQTS) and Concealed LQTS Detection by Validation Subgroup.

A, Performance of the deep learning model to distinguish patients with LQTS from patients without LQTS. B, Performance of the model to distinguish patients with concealed LQTS (corrected QT interval [QTc] <470 milliseconds in men or <480 milliseconds in women). HiRO indicates Hearts in Rhythm Organization; MHI, Montreal Heart Institute.
For distinguishing between LQTS type 1 and type 2 (eFigure 5 in Supplement 1), the internal validation yielded an AUC of 0.95 (95% CI, 0.86-1.00), with the balanced sensitivity and specificity at 0.90 and 0.79, respectively, and a PPV of 0.69. The maximum sensitivity achieved was 0.90, with a specificity of 0.79 and a PPV of 0.69. The external validation resulted in an AUC of 0.91 (95% CI, 0.86-0.96), with the balanced sensitivity and specificity at 0.82 and 0.88, respectively, and a PPV of 0.77. The maximum sensitivity achieved was 0.98, with a specificity of 0.49 and a PPV of 0.49.
Subgroup and sensitivity analyses were conducted to assess the CNN’s performance for different subgroups of the population (Table 2). Both internal and external validation showed minimal numerical differences in CNN AUC for age (pediatric [aged <18 years], or adult), male and female, ethnicity, or heart rate (above or below the median). There was no significant difference in the CNN performance for identifying LQTS carrier status between per-ECG analysis and when aggregating mean CNN predictions across all ECGs from the same patient in the per-patient analysis (eFigure 6 in Supplement 1). Moreover, there was no significant difference in the LQTS detection accuracy in the second external dataset between ECGs taken in an inpatient setting vs an outpatient setting, when limiting to only the first outpatient clinic ECG, or when comparing probands with family members (eFigure 7 in Supplement 1).
Table 2. Model Performance for Long QT Syndrome Carrier Status Among Subgroups.
| Cohort, subgroup | ECGs, No. | AUC (95% CI) | F1 score (95% CI) |
|---|---|---|---|
| HiRO internal validation | |||
| Overall performance | 82 | 0.96 (0.90-1.00) | 0.86 (0.76-0.95) |
| Per-patient performance | 50 | 0.95 (0.87-1.00) | 0.86 (0.73-0.97) |
| Normal or borderline QTca | 27 | 0.89 (0.72-1.00) | 0.78 (0.53-0.95) |
| Age group, y | |||
| <18 | 8 | 1.00 (1.00-1.00) | 0.86 (0.40-1.00) |
| ≥18 | 74 | 0.95 (0.88-0.99) | 0.84 (0.73-0.94) |
| Sex | |||
| Female | 40 | 0.94 (0.84-1.00) | 0.86 (0.72-0.97) |
| Male | 42 | 0.99 (0.96-1.00) | 0.86 (0.69-0.96) |
| Ethnicity | |||
| East Asianb | 13 | 0.95 (0.80-1.00) | 0.86 (0.55-1.00) |
| Indigenous | 4 | NA | NA |
| White | 53 | 0.95 (0.85-1.00) | 0.89 (0.75-1.00) |
| Otherc | 12 | 0.80 (0.50-1.00) | 0.33 (0.00-0.80) |
| Heart rate, /min | |||
| 0-66 | 33 | 0.93 (0.81-1.00) | 0.85 (0.70-0.97) |
| ≥67 | 31 | 0.99 (0.94-1.00) | 0.84 (0.67-1.00) |
| HiRO external validation | |||
| Overall performance | 180 | 0.93 (0.89-0.96) | 0.90 (0.86-0.94) |
| Per-patient performance | 101 | 0.93 (0.88-0.97) | 0.91 (0.86-0.96) |
| Normal or borderline QTca | 97 | 0.89 (0.83-0.95) | 0.86 (0.79-0.92) |
| Age group, y | |||
| <18 | 66 | 0.98 (0.94-1.00) | 0.94 (0.88-0.99) |
| ≥18 | 114 | 0.90 (0.85-0.95) | 0.88 (0.82-0.92) |
| Sex | |||
| Female | 88 | 0.97 (0.94-1.00) | 0.94 (0.90-0.98) |
| Male | 92 | 0.89 (0.83-0.94) | 0.89 (0.82-0.94) |
| Ethnicity | |||
| East Asianb | 2 | NA | NA |
| Indigenous | 17 | 1.00 (1.00-1.00) | 0.97 (0.90-1.00) |
| White | 128 | 0.93 (0.89-0.97) | 0.92 (0.87-0.96) |
| Otherc | 33 | 0.85 (0.72-0.96) | 0.81 (0.67-0.92) |
| Heart rate, /min | |||
| 0-67 | 64 | 0.93 (0.86-0.98) | 0.93 (0.87-0.97) |
| ≥68 | 56 | 0.88 (0.79-0.96) | 0.86 (0.75-0.95) |
Abbreviations: AUC, area under the curve; ECGs, electrocardiograms; HiRO, Hearts in Rhythm Organization; NA, not applicable; QTc, corrected QT interval.
Normal QTc was less than 450 milliseconds (men) or less than 460 milliseconds (women), and borderline QTc was 450 to 469 milliseconds (men) or 460 to 479 milliseconds (women).
Includes Chinese, Filipino, Japanese, Korean, and Southeast Asian.
Includes Arab or West Asian, Black, Latin American, and South Asian.
For the subset of ECGs that were manually read by arrhythmia experts, CNN performance was directly compared with whether the manually measured QTc intervals were prolonged (≥470 milliseconds for men, ≥480 milliseconds for women) (eTable 4 in Supplement 1). In the internal validation analysis, the CNN had an F1 score of 0.79 (95% CI, 0.57-1.00) and a sensitivity of 0.85 (95% CI, 0.67-0.96). The expert-read prolonged QTc interval had an F1 score of 0.21 (95% CI, 0.00-0.43) and a sensitivity of 0.35 (95% CI, 0.00-0.60). In the external validation analysis, the CNN had an F1 score of 0.83 (95% CI, 0.74-0.90) and a sensitivity of 0.90 (95% CI, 0.84-0.94). The expert-read prolonged QTc interval had an F1 score of 0.22 (95% CI, 0.13-0.47). In patients with normal or borderline QTc intervals, the CNN had an F1 score of 0.70 (95% CI, 0.40-1.00) and a sensitivity of 0.78 (95% CI, 0.53-0.95); by definition, the expert-measured QTc intervals were not able to distinguish LQTS in these patients.
Discussion
In this study, we trained a CNN to detect congenital LQTS on 12-lead ECG in a population predominantly consisting of patients with concealed LQTS. Our model was also able to distinguish between the 2 most common genotype variants. Our model was validated over a multicenter cohort of patients referred to inherited arrhythmia centers for screening of suspected inherited arrhythmias. We demonstrated that our model had high accuracy and sensitivity in detecting LQTS and in distinguishing between KCNQ1 and KCNH2 variants. The performance of our model was robust across different centers, ages, sexes, and ethnicities. The CNN was able to detect LQTS with higher F1 scores and sensitivities compared with QTc intervals measured by arrhythmia experts. To our knowledge, this is the first study to make the model code and weights available, contributing to the field of computer-aided diagnosis of LQTS via 12-lead ECG.
Detection of Concealed LQTS on Resting ECG
Historical registries, such as the international LQTS registry, have typically been biased toward more severe phenotypes, with a high prevalence of symptomatic patients and prolonged QTc intervals (mean QTc interval, 495 milliseconds).12 In these patients, the diagnosis is typically more straightforward. In contrast, the HiRO Registry includes patients with milder phenotypes, in whom there is more diagnostic ambiguity.13 In the population in our study, the resting QTc interval alone was not a reliable indicator for identifying LQTS, with 73.8% of ECGs from LQTS carriers having a normal or borderline QTc interval as measured by an arrhythmia expert, similar to previous reports.13 As a result, screening based on QTc interval alone would not identify a large number of affected individuals, particularly when not evaluated by specialists.
Our model’s strength lies in detecting LQTS in ECGs even with normal or borderline QTc intervals. This could be crucial for screening, helping identify patients who may need further provocative or genetic testing or who are at risk of QT-mediated arrhythmias when exposed to QT-prolonging drugs. Although individuals with concealed LQTS have a lower arrhythmic risk compared with those with significantly prolonged QTc intervals, they can still benefit from preventive measures, like avoiding certain QT-prolonging medications, family screening, and potentially prophylactic β-blockade.
Clinical Applications of CNNs in ECG Interpretation
Manual analysis of resting 12-lead ECGs can be challenging. While LQTS experts advocate various manual measurements, such as the tangent or threshold methods,14,15,16 and QTc cutoffs,17 these measurements can vary significantly (up to 70 milliseconds) and even more so among nonexperts.18 Provocative tests, such as brisk standing,19 exercise,3,13,20 or epinephrine challenge,21 can reveal repolarization abnormalities but add complexity and are not widely available.
The use of ML in the detection of LQTS may help circumvent these limitations. Machine learning approaches can detect hidden features on ECG even in cases of concealed LQTS, including non–QT-based features, such as overt or subtle T-wave morphologic changes.22,23 Machine learning methods also require less expertise to use, are less time and labor intensive,24 and are not influenced by other clinical information like human readers might be.25 These models can be deployed in small underserved communities, where LQTS can be more prevalent.26 In addition, CNNs can continually improve as more data become available, even from unrelated ECG tasks.27
A growing body of work has shown that ML approaches are effective in the analysis of ECGs. In terms of congenital LQTS detection, ML algorithms have been developed, including an XceptionTime model to detect LQTS based on a small cohort of patients with high accuracy scores.9 Some CNN-based models have been developed in single-center studies to predict a clinical or genetic diagnosis of LQTS,7 and another has been developed with randomly selected outpatient control ECGs and validated in an external center with high accuracy.8 Our study builds on these previous studies, as we developed a CNN model using matched gene-negative controls who were referred for suspicion of an inherited arrhythmia. Moreover, we validated the performance of our model across multiple external centers, enhancing its generalizability. We advocate for an open platform to further advance the field.
Limitations
A major limitation is that the training of the model used a case-control cohort that included relatives who were referred due to family history of an inherited arrhythmia and were determined to be unaffected but were not routinely offered genetic testing for LQTS. Because the prevalence of LQTS in the general population is low, the likelihood that this control cohort would contain patients who carry an LQTS-causing genetic variant was low. However, this control population was at low risk of LQTS and easier to distinguish from patients with congenital LQTS.
This difference in the control cohorts likely explains the reduced discriminatory ability of our model in the second external cohort (MHI), as this was a more stringent, higher-risk consecutive cohort of patients in which even the patients who were genotype negative had a sufficiently elevated pretest suspicion for LQTS to warrant genetic testing. The methods of the gene-negative controls also differed for the second dataset, as these patients were referred for suspicion of LQTS and, thus by definition, had a higher probability of LQTS and were more difficult to differentiate from healthy controls; this is evidenced by their higher QTc intervals compared with the HiRO dataset (eFigure 8 in Supplement 1). However, our model still revealed an ability to distinguish LQTS in this higher-risk, cross-sectional cohort, including in patients with normal or only borderline-abnormal QTc intervals on their resting ECGs.
Another limitation is that our CNN model was trained to detect specific genotypes associated with LQTS ECG phenotypes, which may not be applicable to other less common genotypes or to patients who are genotype negative but have a positive clinical phenotype. However, we wanted to develop our CNN to identify specific genotypes that are known to be associated with their own unique ECG patterns.28 For the same reason, we excluded patients with LQTS type 3 from our study, as this subtype is rare (5%-10% of the population with LQTS) and we believed that there would not be enough data available to adequately train and validate our model.
Conclusions
Our findings suggest that CNNs are effective in detecting congenital LQTS and differentiating between the 2 most common genotypes across a multicenter cohort. The CNN showed greater accuracy than expert QTc measurements from resting ECGs. Broader validation over an unselected general population may support broad application of this model to stratify torsade de pointes risk in patients with suspected LQTS. To facilitate further research, we have made our code and model weights publicly available.
eFigure 1. Convolutional Neural Network (ConvNet) Architecture
eFigure 2. Residual Neural Network (ResNet) Architecture
eFigure 3. Convolutional Neural Network Prediction Of Long QT Syndrome Carrier Status, for Internal and External Validation Datasets
eFigure 4. CNN Prediction of LQTS Carrier Status for ECGs With Normal/Borderline QTc, HiRO Dataset
eFigure 5. CNN Prediction of LQTS Type 1 vs LQTS Type 2, HiRO Dataset
eFigure 6. Per-Patient CNN Prediction of LQTS Carrier Status, and LQTS Type 1 vs Type 2, in HiRO Datasets
eFigure 7. Performance of Deep Learning Model in Detecting LQTS in Subsets of Montreal Heart Institute External Validation Dataset
eFigure 8. Genotype-Negative Controls in the MHI Cohort Have Longer QTc Compared to HiRO Internal and External Datasets, Whereas There Is No Significant Difference in QTc for Genotype Positive LQTS Patients Between the Datasets
eTable 1. Model Performance During Hyperparameter Optimization for CNNs
eTable 2. Baseline Characteristics, on a per-ECG Basis
eTable 3. Demographic and ECG Characteristics, per HiRO Derivation and Validation Datasets
eTable 4. CNN vs Expert Measured QTc for Prediction of LQTS Carrier Status
Data Sharing Statement
References
- 1.Wilde AAM, Amin AS, Postema PG. Diagnosis, management and therapeutic strategies for congenital long QT syndrome. Heart. 2022;108(5):332-338. doi: 10.1136/heartjnl-2020-318259 [DOI] [PMC free article] [PubMed] [Google Scholar]
- 2.Johnson JN, Ackerman MJ. QTc: how long is too long? Br J Sports Med. 2009;43(9):657-662. doi: 10.1136/bjsm.2008.054734 [DOI] [PMC free article] [PubMed] [Google Scholar]
- 3.Sy RW, van der Werf C, Chattha IS, et al. Derivation and validation of a simple exercise-based algorithm for prediction of genetic testing in relatives of LQTS probands. Circulation. 2011;124(20):2187-2194. doi: 10.1161/CIRCULATIONAHA.111.028258 [DOI] [PubMed] [Google Scholar]
- 4.Schwartz PJ, Ackerman MJ. The long QT syndrome: a transatlantic clinical approach to diagnosis and therapy. Eur Heart J. 2013;34(40):3109-3116. doi: 10.1093/eurheartj/eht089 [DOI] [PubMed] [Google Scholar]
- 5.Johnson JN, Ackerman MJ. Return to play? athletes with congenital long QT syndrome. Br J Sports Med. 2013;47(1):28-33. doi: 10.1136/bjsports-2012-091751 [DOI] [PubMed] [Google Scholar]
- 6.Hermans BJM, Bennis FC, Vink AS, et al. Improving long QT syndrome diagnosis by a polynomial-based T-wave morphology characterization. Heart Rhythm. 2020;17(5)(pt A):752-758. doi: 10.1016/j.hrthm.2019.12.020 [DOI] [PubMed] [Google Scholar]
- 7.Bos JM, Attia ZI, Albert DE, Noseworthy PA, Friedman PA, Ackerman MJ. Use of artificial intelligence and deep neural networks in evaluation of patients with electrocardiographically concealed long QT syndrome from the surface 12-Lead electrocardiogram. JAMA Cardiol. 2021;6(5):532-538. doi: 10.1001/jamacardio.2020.7422 [DOI] [PMC free article] [PubMed] [Google Scholar]
- 8.Aufiero S, Bleijendaal H, Robyns T, et al. A deep learning approach identifies new ECG features in congenital long QT syndrome. BMC Med. 2022;20(1):162. doi: 10.1186/s12916-022-02350-z [DOI] [PMC free article] [PubMed] [Google Scholar]
- 9.Doldi F, Plagwitz L, Hoffmann LP, et al. Detection of patients with congenital and often concealed long-QT syndrome by novel deep learning models. J Pers Med. 2022;12(7):1135. doi: 10.3390/jpm12071135 [DOI] [PMC free article] [PubMed] [Google Scholar]
- 10.Davies B, Roberts JD, Tadros R, et al. The Hearts in Rhythm Organization: a Canadian National Cardiogenetics Network. CJC Open. 2020;2(6):652-662. doi: 10.1016/j.cjco.2020.05.006 [DOI] [PMC free article] [PubMed] [Google Scholar]
- 11.Comber DA, Davies B, Roberts JD, et al. Return of results policies for genomic research: current practices and the Hearts in Rhythm Organization (HiRO) approach. Can J Cardiol. 2022;38(4):526-535. doi: 10.1016/j.cjca.2021.10.006 [DOI] [PubMed] [Google Scholar]
- 12.Locati EH, Zareba W, Moss AJ, et al. Age- and sex-related differences in clinical manifestations in patients with congenital long-QT syndrome: findings from the International LQTS Registry. Circulation. 1998;97(22):2237-2244. doi: 10.1161/01.CIR.97.22.2237 [DOI] [PubMed] [Google Scholar]
- 13.Yee LA, Han HC, Davies B, et al. Sex differences and utility of treadmill testing in long-QT syndrome. J Am Heart Assoc. 2022;11(18):e025108. doi: 10.1161/JAHA.121.025108 [DOI] [PMC free article] [PubMed] [Google Scholar]
- 14.Goldenberg I, Moss AJ, Zareba W. QT interval: how to measure it and what is “normal.” J Cardiovasc Electrophysiol. 2006;17(3):333-336. doi: 10.1111/j.1540-8167.2006.00408.x [DOI] [PubMed] [Google Scholar]
- 15.Postema PG, De Jong JSSG, Van der Bilt IAC, Wilde AAM. Accurate electrocardiographic assessment of the QT interval: teach the tangent. Heart Rhythm. 2008;5(7):1015-1018. doi: 10.1016/j.hrthm.2008.03.037 [DOI] [PubMed] [Google Scholar]
- 16.Kasamaki Y, Ozawa Y, Ohta M, et al. Automated versus manual measurement of the QT interval and corrected QT interval. Ann Noninvasive Electrocardiol. 2011;16(2):156-164. doi: 10.1111/j.1542-474X.2011.00423.x [DOI] [PMC free article] [PubMed] [Google Scholar]
- 17.Vink AS, Neumann B, Lieve KVV, et al. Determination and interpretation of the QT interval. Circulation. 2018;138(21):2345-2358. doi: 10.1161/CIRCULATIONAHA.118.033943 [DOI] [PubMed] [Google Scholar]
- 18.Viskin S, Rosovski U, Sands AJ, et al. Inaccurate electrocardiographic interpretation of long QT: the majority of physicians cannot recognize a long QT when they see one. Heart Rhythm. 2005;2(6):569-574. doi: 10.1016/j.hrthm.2005.02.011 [DOI] [PubMed] [Google Scholar]
- 19.Viskin S, Postema PG, Bhuiyan ZA, et al. The response of the QT interval to the brief tachycardia provoked by standing: a bedside test for diagnosing long QT syndrome. J Am Coll Cardiol. 2010;55(18):1955-1961. doi: 10.1016/j.jacc.2009.12.015 [DOI] [PMC free article] [PubMed] [Google Scholar]
- 20.Wong JA, Gula LJ, Klein GJ, Yee R, Skanes AC, Krahn AD. Utility of treadmill testing in identification and genotype prediction in long-QT syndrome. Circ Arrhythm Electrophysiol. 2010;3(2):120-125. doi: 10.1161/CIRCEP.109.907865 [DOI] [PubMed] [Google Scholar]
- 21.Shimizu W, Noda T, Takaki H, et al. Epinephrine unmasks latent mutation carriers with LQT1 form of congenital long-QT syndrome. J Am Coll Cardiol. 2003;41(4):633-642. doi: 10.1016/S0735-1097(02)02850-4 [DOI] [PubMed] [Google Scholar]
- 22.Moss AJ, Zareba W, Benhorin J, et al. ECG T-wave patterns in genetically distinct forms of the hereditary long QT syndrome. Circulation. 1995;92(10):2929-2934. doi: 10.1161/01.CIR.92.10.2929 [DOI] [PubMed] [Google Scholar]
- 23.Lane CM, Bos JM, Rohatgi RK, Ackerman MJ. Beyond the length and look of repolarization: defining the non-QTc electrocardiographic profiles of patients with congenital long QT syndrome. Heart Rhythm. 2018;15(9):1413-1419. doi: 10.1016/j.hrthm.2018.04.033 [DOI] [PubMed] [Google Scholar]
- 24.Tison GH. Finding new meaning in everyday electrocardiograms-leveraging deep learning to expand our diagnostic toolkit. JAMA Cardiol. 2021;6(5):493-494. doi: 10.1001/jamacardio.2020.7460 [DOI] [PubMed] [Google Scholar]
- 25.Anh D, Krishnan S, Bogun F. Accuracy of electrocardiogram interpretation by cardiologists in the setting of incorrect computer analysis. J Electrocardiol. 2006;39(3):343-345. doi: 10.1016/j.jelectrocard.2006.02.002 [DOI] [PubMed] [Google Scholar]
- 26.Arbour L, Asuri S, Whittome B, Polanco F, Hegele RA. The genetics of cardiovascular disease in Canadian and international aboriginal populations. Can J Cardiol. 2015;31(9):1094-1115. doi: 10.1016/j.cjca.2015.07.005 [DOI] [PubMed] [Google Scholar]
- 27.Weimann K, Conrad TOF. Transfer learning for ECG classification. Sci Rep. 2021;11(1):5251. doi: 10.1038/s41598-021-84374-8 [DOI] [PMC free article] [PubMed] [Google Scholar]
- 28.Morita H, Wu J, Zipes DP. The QT syndromes: long and short. Lancet. 2008;372(9640):750-763. doi: 10.1016/S0140-6736(08)61307-0 [DOI] [PubMed] [Google Scholar]
Associated Data
This section collects any data citations, data availability statements, or supplementary materials included in this article.
Supplementary Materials
eFigure 1. Convolutional Neural Network (ConvNet) Architecture
eFigure 2. Residual Neural Network (ResNet) Architecture
eFigure 3. Convolutional Neural Network Prediction Of Long QT Syndrome Carrier Status, for Internal and External Validation Datasets
eFigure 4. CNN Prediction of LQTS Carrier Status for ECGs With Normal/Borderline QTc, HiRO Dataset
eFigure 5. CNN Prediction of LQTS Type 1 vs LQTS Type 2, HiRO Dataset
eFigure 6. Per-Patient CNN Prediction of LQTS Carrier Status, and LQTS Type 1 vs Type 2, in HiRO Datasets
eFigure 7. Performance of Deep Learning Model in Detecting LQTS in Subsets of Montreal Heart Institute External Validation Dataset
eFigure 8. Genotype-Negative Controls in the MHI Cohort Have Longer QTc Compared to HiRO Internal and External Datasets, Whereas There Is No Significant Difference in QTc for Genotype Positive LQTS Patients Between the Datasets
eTable 1. Model Performance During Hyperparameter Optimization for CNNs
eTable 2. Baseline Characteristics, on a per-ECG Basis
eTable 3. Demographic and ECG Characteristics, per HiRO Derivation and Validation Datasets
eTable 4. CNN vs Expert Measured QTc for Prediction of LQTS Carrier Status
Data Sharing Statement