

Abstract
The nature of activation signals is essential in determining T cell subset differentiation, however, the features that determine T cell subset preference acquired during intrathymic development remain elusive. Here we show that naïve CD4+ T cells generated in the mouse thymic microenvironment lacking Scd1, the enzyme catalyzing oleic acid production, exhibit enhanced regulatory T (Treg) cell differentiation and attenuated development of experimental autoimmune encephalomyelitis. Scd1 deletion in K14+ thymic epithelia recapitulated the enhanced Treg cell differentiation phenotype of Scd1-deficient mice. The dearth of oleic acid permitted DOT1L to increase H3K79me2 levels at the Atp2a2 locus of thymocytes at DN2-DN3 transition stage. Such epigenetic modification persisted in naïve CD4+ T cells and facilitated Atp2a2 expression. Upon TCR activation, ATP2A2 enhanced the activity of calcium-NFAT1-Foxp3 axis to promote naïve CD4+ T cells to differentiate into Treg cells. Therefore, oleic acid availability is critical for preprogramming thymocytes with Treg differentiation propensities in periphery.
All jawed vertebrates are capable of adaptive immune response driven by T cells and B cells1. T cells develop in the thymus from hematopoietic stem cell-derived lymphoid progenitors, which are supported by factors such as Notch ligands, IL-7, and stem cell factor at specific locations2, 3. T cells with newly rearranged T cell receptors (TCR) are either positively or negatively selected against self-major histocompatibility complex plus self-peptides, depending on their avidity4. After maturation, naïve T cells enter the periphery and differentiate into distinct T cell subsets in response to different types of antigens, co-stimulation molecules, cytokines, and metabolites5, 6, 7. However, it is unknown whether the thymic microenvironment could preprogram naïve T cells with properties that influence their subset differentiation in the periphery.
Regulatory T (Treg) cells are a CD4+ T cell population that has an essential role in guarding immune homeostasis8. Treg cells are controlled by the transcriptional factor forkhead box protein P3 (Foxp3). Loss-of-function mutations of Foxp3 result in the development of X-linked syndrome9. According to the origins, Treg cells are divided into thymic Treg cells (tTreg) and peripheral Treg cells (pTreg)10. The tTreg cells acquire Foxp3 expression during their thymic development, while pTreg cells gain Foxp3 expression in the periphery during activation-induced differentiation11, 12. During T cell development, some thymocytes are poised to express Foxp3 under the influence of epigenetic modifiers such as SATB1 to become tTreg cells13. On the other hand, the differentiation of pTreg cells from activated naïve CD4+ T cells is believed to rely on microenvironmental factors, such as transforming growth factor-β (TGF-β), retinoic acid, short-chain fatty acids, and bile acids, which can regulate Foxp3 expression14, 15, 16.
Treg cells are known to obtain energy mainly through lipid metabolism17. Pharmacologic blockade or genetic ablation of acetyl-CoA carboxylase 1, the key enzyme for de novo fatty acid synthesis in T cells, affected in vitro and in vivo Treg differentiation18. Inhibition of fatty acid binding protein 5 in Treg cells was shown to enhance their immunosuppressive capacities19. These understandings of lipid metabolism-mediated Treg regulation are achieved through investigations on mature T cells. However, whether lipid metabolism could exert lasting-effects on developing T cells to influence their peripheral differentiation has yet to be determined. Here, using mice lacking stearoyl-CoA desaturase 1 (Scd1)20, 21, the rate-limiting enzyme for oleic acid production, in the whole or the thymic epithelia alone, we found that the oleic acid shortage impacts thymocyte preprogramming and resulted in a dramatic increase in Treg cells in the periphery.
Results
Naïve CD4+ T cells of Scd1−/− mice prefer Treg differentiation
Fatty acid variably affects the immune system22. We found that Scd1−/− mice are resistant to experimental autoimmune encephalomyelitis (EAE) (Fig. 1a). In the central nervous system (CNS) of EAE mice, Scd1 deficiency increased the frequency of Treg cells, while reduced the level of Th17 cells (Extended Data Fig. 1a). Administration of a CD25-depleting antibody restored the susceptibility of Scd1−/− mice to EAE, suggesting a role for the increased Treg cells in EAE resistance (Fig. 1a and Extended Data Fig. 1a). We also examined the number and function of Treg cells in Scd1−/− mice. Compared to littermate controls (Scd1+/−), Scd1−/− mice possessed more Treg cells even before EAE induction (Fig. 1b and Extended Data Fig. 1b), while the immunosuppressive capabilities of Treg cells were not affected (Extended Data Fig. 1c,d).
Fig. 1: Naïve CD4+ T cells of Scd1−/− mice, but not CD4creScd1loxp mice, have a cell-intrinsic preference for Treg differentiation.

a, EAE was induced in Scd1−/− and Scd1+/− mice, and disease scores were recorded. CD25 depleting antibody was injected on day 9 and 13 post EAE induction (n=4 mice for Scd1−/−+Iso, Scd1−/−+α-CD25; n=5 mice for Scd1+/−+Iso, Scd1+/− +α-CD25, repeated 3 times). b, CD4+Foxp3+Treg levels in Scd1−/− and Scd1+/− mice (n=5 mice per group, repeated 5 times). c, Splenic CD4+CD62L+T cells from Scd1−/− and Scd1+/− mice were cultured in Treg induction medium and evaluated for Foxp3 expression (p<0.001, n=3 biologically independent samples per group, repeated 5 times). d-e, Splenic CD4+CD45RBhigh T cells from Scd1−/− or Scd1+/− mice were transferred to Rag2−/− mice. The body weight (d), and Treg generation (e) of Rag2−/− recipients, were monitored (n=4 mice per group, repeated twice). f, Splenic CD4+CD45RBhigh T cells from CD45.2+Scd1−/− mice and CD45.1+ WT mice were co-transferred to Rag2−/− mice at a 1:1 ratio to evaluate Treg generation (n=4 mice per group, repeated twice). g, The clinical scores of EAE induced in CD4creScd1loxp and Scd1loxp mice (n=5 mice per group, repeated 3 times). h, CD4+Foxp3+ Treg levels in CD4creScd1loxp and Scd1loxp mice (n=8 mice per group, repeated for 3 times). i, Splenic CD4+CD62L+T cells of CD4creScd1loxp and Scd1loxp mice were subjected to the Treg induction medium and analyzed for Foxp3 expression (ns, n=3 biological independent samples per group, repeated 3 times). j-k, Splenic CD4+CD45RBhigh T cells of CD4creScd1loxp or Scd1loxp mice were transferred to Rag2−/− mice, and the body weight (j), as well as Treg generation in the periphery (k), were monitored in Rag2−/− recipients (n=4 mice per group, repeated twice). l, Splenic CD4+CD45RBhigh T cells isolated from CD45.2+CD4creScd1loxp and CD45.1+WT mice were co-transferred into Rag2−/− mice at a 1:1 ratio. The Treg levels were determined 8 weeks after T cell transfer (n=4 mice per group, repeated twice). Data are presented as Mean ± SEM. ns, no significance; by unpaired two-tailed Student’s t-test (a, b, c, d, e, g, h, i, j, k) or paired two-tailed Student’s t-test (f, l).
We characterized the increased Treg cell population in Scd1−/− mice with Helios expression and found that both Helios−Foxp3+ and Helios+Foxp3+ Treg cells in Scd1−/− mice showed elevated levels (Extended Data Fig. 1e–g). To determine the origin of these cells, we evaluated the Treg induction efficiency from naïve T cells and assessed Treg levels in the thymus. CD4+CD62L+ naïve T cells from Scd1−/− mice generated higher levels of Treg cells than those from Scd1+/− mice, while the number of CD4+CD8−Foxp3+ cells in the thymus remained comparable (Fig. 1c and Supplementary Fig. 1a–c). Therefore, the increased Treg levels in Scd1−/− mice is likely due to the increased pTreg differentiation.
To further evaluate the Treg differentiation propensity in vivo, we transferred CD4+CD45RBhigh T cells to Rag2−/− mice, which induced colitis in the recipients23. Rag2−/− mice receiving CD4+ T cells from Scd1−/− mice exhibited increased Treg levels, accompanied by reduced colitis severity (Fig. 1d,e and Supplementary Fig. 1d). To investigate the Treg differentiation propensity in the same Scd1 competent in vivo environment, we isolated CD4+CD45RBhigh T cells from CD45.2+Scd1−/− and CD45.1+WT mice and co-transferred them to Rag2−/− mice. CD4+ T cells from Scd1−/− mice, but not those from WT mice, more efficiently differentiated into Treg cells, while the CD4 reconstitution efficiencies were relatively comparable (Fig. 1f and Supplementary Fig. 1e–g). Importantly, age- and sex-matched CD45.2+Scd1+/− and CD45.1+WT mice had similar basal Treg levels and in vitro Treg induction efficiency, verifying that T cells from CD45.1+WT mice were appropriate controls for T cells from CD45.2+Scd1−/− mice (Supplementary Fig. 1h,i). To evaluate whether the fitness and proliferation of Treg cells also influence their abundance in Rag2−/− mice, we co-injected CD45.2+CD4+CD25+ cells from Scd1+/− or Scd1−/− mice with CD45.1+CD4+CD62L+ cells from WT mice into Rag2−/− mice and assessed the levels of Treg cells 6 weeks post-transfer (Supplementary Fig. 2a). The percentage and absolute number of transferred Treg cells of WT and Scd1-deficient origin were comparable (Supplementary Fig. 2b–d). Additionally, the proportion of Ki67+ Treg cells was not affected by Scd1 deficiency (Supplementary Fig. 2e). These findings suggest that in Rag2−/− mice, the increased Treg cells of Scd1-deficient origin were resulted from enhanced Treg differentiation rather than alterations in the proliferation or fitness of Treg cells.
To further verify the Treg differentiation of Scd1−/− CD4+ T cells in WT context, we isolated CD4+CD8−CD73−CD25− cells, which are newly generated T cells24, from the thymus of CD45.1+ WT and CD45.2+ Scd1−/− mice and co-injected them into CD45.1+CD45.2+ WT mice at a 1:1 ratio (Extended Data Fig. 2a,b). These CD4+CD8−CD73−CD25− cells from the thymus of Scd1−/− mice also exhibited an enhanced propensity to differentiate into Treg cells compared to those from WT mice (Extended Data Fig. 2c–e). Taken together, naïve T cells in Scd1−/− mice have a cell-intrinsic preference to differentiate into Treg cells in the periphery.
To investigate whether Scd1 deficiency also affected the functional fitness of conventional T cells. We first analyzed the percentages of naïve (CD44−CD62L+), effector (CD44+CD62L−), and central memory (CD44+CD62L+) CD4+ T cells in the spleen and found that they were not affected (Extended Data Fig. 3a). When stimulated with anti-CD3/CD28, the proliferation of CD4+ T cells from Scd1+/− and Scd1−/− mice were also comparable (Extended Data Fig. 3b). In addition, naïve CD4+ T cells from Scd1−/− and Scd1+/− mice showed similar potential in differentiating into Th1 and Th2 cells in vitro (Extended Data Fig. 3c–d,f). These data demonstrated that conventional T cells from Scd1−/− mice are not functionally impaired. It is well-established that the differentiation of Th17 and Treg cells exhibit reciprocal regulation25. In line with this, we found that naïve CD4+ T cells from Scd1−/− mice displayed reduced efficiency in Th17 induction compared to those from Scd1+/− mice (Extended Data Fig. 3e,f).
To investigate the direct effects of SCD1 on CD4+ T cells, we generated CD4creScd1loxp mice (Extended Data Fig. 4a,b). Interestingly, Treg levels were not affected by Scd1-specific deletion in CD4+ T cells (Fig. 1h). Naïve T cells from CD4creScd1loxp and Scd1loxp mice also generated similar levels of Treg cells upon in vitro induction (Fig. 1i). When CD4+CD45RBhigh T cells from CD4creScd1loxp mice or control mice were transferred separately or together (at a 1:1 ratio) to Rag2−/− mice, we did not find any influence of Scd1 deficiency in T cells on their in vivo Treg generation (Fig. 1j–l and Extended Data Fig. 4c). Unlike Scd1−/− mice (Fig. 1a), CD4creScd1loxp mice and Scd1loxp mice have a similar susceptibility to EAE induction (Fig. 1g). In addition, Treg levels at different stages of EAE were not increased in CD4creScd1loxp mice (Extended Data Fig. 4d). These data demonstrate that the Treg differentiation propensity of naïve T cells in Scd1−/− mice is not due to the Scd1 status in CD4+ T cells.
DN3 cells acquire pTreg differentiation preference in Scd1−/− thymus
A difference between T cells from Scd1−/− and CD4creScd1loxp mice is the developmental environment experienced. To test whether the developmental history in Scd1−/− mice conferred naïve T cells the inherent preferences for Treg differentiation, we co-transferred bone marrow from CD45.1+WT and CD45.1+CD45.2+Scd1−/− (KO) mice at a 1:1 ratio to lethally irradiated WT or Scd1−/− mice in the CD45.2 background (Fig. 2a). The T cell reconstitution efficiencies of WT and Scd1−/− bone marrow were comparable in the recipient mice (Extended Data Fig. 5a–c). However, the Treg levels were significantly higher in the Scd1−/− recipients than those in the WT recipients, regardless of the bone marrow origin (Fig. 2b). Naïve T cells from the Scd1−/− recipient mice also showed more potency in becoming Treg cells upon in vitro inductions (Fig. 2c). These results demonstrate that naïve T cells developed in Scd1 deficient tissue microenvironment are preprogrammed for Treg differentiation.
Fig. 2: The Scd1 deficient thymic environment imprints DN3 thymocytes with subsequent Treg differentiation propensity.

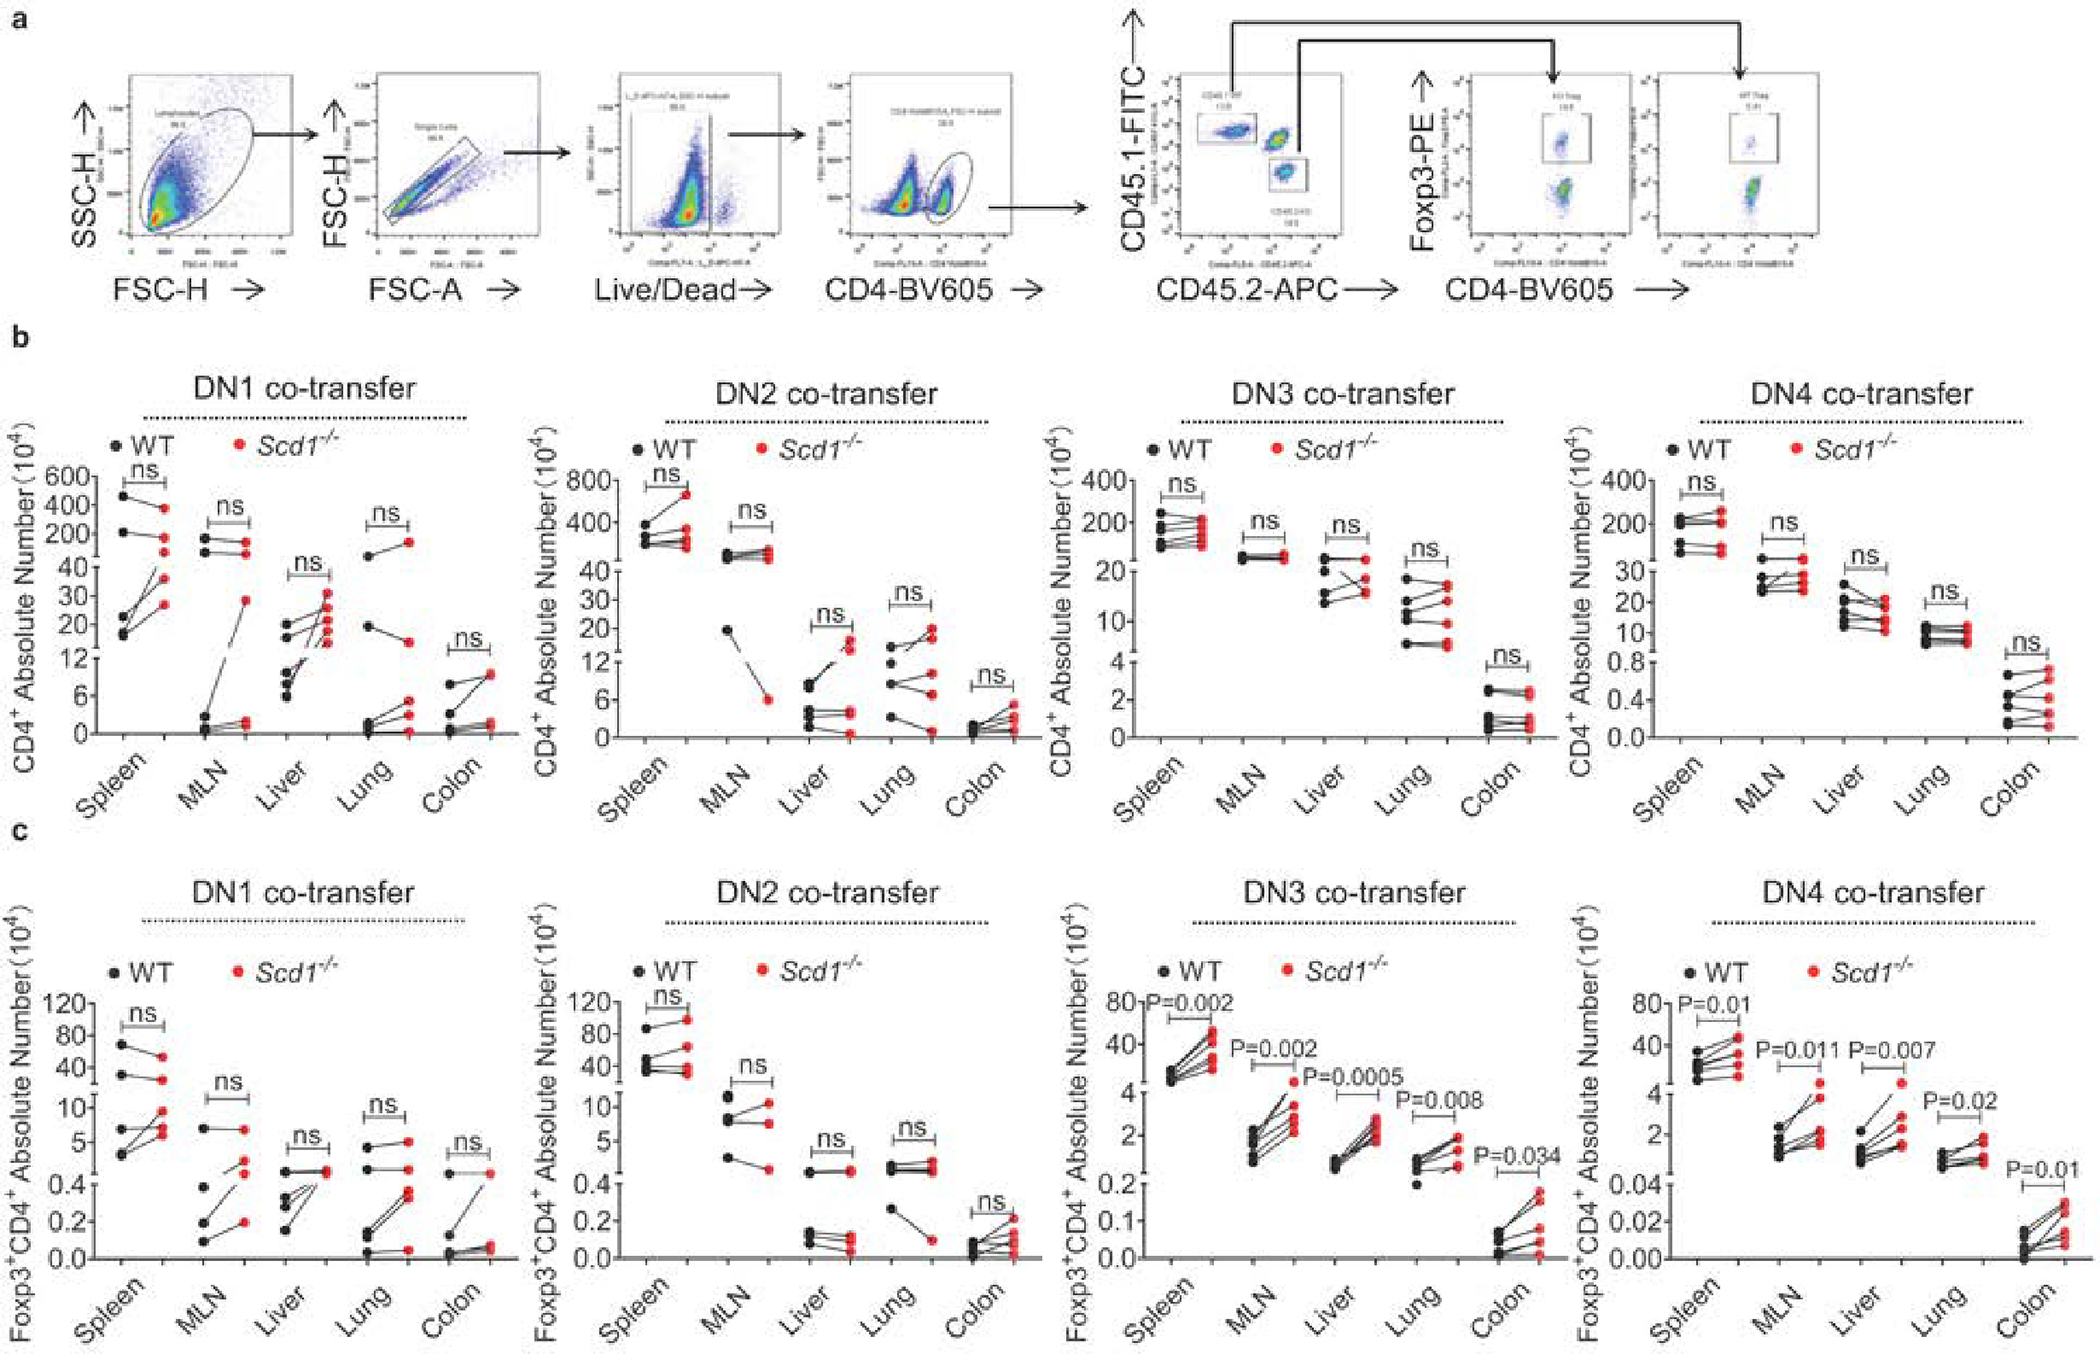
a, Schematic representation of the bone marrow chimera experiment. The bone marrow cells were isolated from age- and sex-matched CD45.1+CD45.2+Scd1−/− mice and CD45.1+WT mice and mixed at a 1:1 ratio before intravenous administration to lethally irradiated (10 Gy) CD45.2+WT mice or CD45.2+Scd1−/− mice. b, The proportions of Foxp3+ Treg cells among CD4+ T cells derived from different donors (n=9 mice for WR, n=7 mice for KR, repeated twice). c, Splenic CD4+CD62L+T cells from different donors were sorted and cultured under the Treg induction medium for 72 hours and Foxp3 levels were determined (n=4 biologically independent samples per group, repeated twice). d, Schematic representation of the adoptive transfer experiments investigating the generation of Treg cells from different subsets of WT and Scd1−/− thymocytes. Each thymocyte population at the DN1, DN2, DN3, or DN4 stage from CD45.2+ Scd1−/− mice and CD45.1+ WT mice was mixed at a 1:1 ratio and co-transferred to irradiated (3 Gy) CD45.1+CD45.2+WT mice via intrathymic injection. e, The Treg cells generated from different thymocyte subsets were analyzed flowcytometrically 4 weeks post transfer (n=5 mice for DN1, DN2 transfer; n=6 mice for DN3, DN4 transfer, performed once). f, Splenic CD4+CD62L+ T cells were isolated from the recipient mice to evaluate their differentiation efficiency to Treg cells in vitro (ns for DN1 and DN2 transfer, p=0.002 for DN3 transfer, p<0.0001 for DN4 transfer, n=5 biologically independent samples per group, performed once). Data are presented as Mean ± SEM. ns, no significance; by unpaired two-tailed Student’s t-test (b, c, f) or paired two-tailed Student’s t-test (e).
To determine the time window for T cell preprogramming, we isolated thymocytes at different developmental stages (CD44+CD25− DN1, CD44+CD25+ DN2, CD44−CD25+ DN3, and CD44−CD25− DN4) from CD45.2+Scd1−/− and CD45.1+WT mice. We then co-transferred these thymocytes into CD45.1+CD45.2+WT mice via intrathymic injection (Fig. 2d and Extended Data Fig. 5d,e). DN cells of each stage from both WT and Scd1−/− mice generated similar levels of CD4+ T cells in the recipient mice (Extended Data Fig. 6a,b). We found that neither DN1 nor DN2 thymocytes from Scd1−/− mice showed higher Treg levels than those from WT mice (Fig. 2e and Extended Data Fig. 6c). Strikingly, we observe that DN3 or DN4 thymocytes from Scd1−/− mice had a higher tendency to become Treg cells in WT recipient mice compared to those from WT mice (Fig. 2e and Extended Data Fig. 6c). Furthermore, we isolated CD4+CD62L+ naïve T cells from the WT recipient mice and subjected them to in vitro Treg differentiation. In this setting, enhanced Treg generation was also observed in T cells derived from DN3 and DN4 cells of Scd1−/− mice (Fig. 2f). These results consolidate that DN3 cells developing in Scd1-deficient thymic environment have an intrinsic inclination towards generating Treg cells.
To further verify our conclusion, we co-transferred DN1, DN2, DN3, DN4, or DP cells from CD45.1+ WT donor and CD45.2+ Scd1−/− donor to Rag2−/− mice. After i.v. transfer, DN cells homed to the thymus and underwent a wave of thymopoiesis to generate CD4+T cells, CD8+T cells, and gut intraepithelial lymphocytes in the Rag2−/− mice (Supplementary Fig. 3a–e). Consistent with our previous findings in WT recipient mice, DN3 and DN4 cells from Scd1−/− mice had a higher tendency to generate Treg cells in the Rag2−/− recipient mice compared to their WT counterparts (Supplementary Fig. 4a). Enhanced Treg generation from Scd1−/− DN3 cells could be observed 4 weeks post DN3 co-transfer (Supplementary Fig. 4b). We also isolated CD4+T cells from Rag2−/− mice that had received the co-transfer of DN3 cells on day 14 and day 28 to induce Treg cells in vitro. We observed a significant increase in Treg differentiation in T cells derived from DN3 cells of Scd1−/− mice (Supplementary Fig. 4c). These results demonstrated that thymocytes are preprogrammed to become Treg cells during their DN2-DN3 transition.
Dearth of oleic acid impacts pTreg preprogramming
SCD1 converts stearic acid (18:0) into oleic acid (18:1n9)20, 21. We found that these fatty acids were predominant in the cortex of the thymus (Supplementary Fig. 5a–c). In the thymus of Scd1−/− mice, there is an accumulation of stearic acid and a reduction of oleic acid (Fig. 3a). To directly evaluate whether the alteration in these fatty acid levels is responsible for the Treg differentiation preference, we added SCD1 inhibitor A939572 to an in vitro T cell development system involving the co-culture of hematopoietic stem cells (HSCs) with OP9 stromal cells expressing delta like canonical Notch ligand 1 (OP9-DL1)26. The resultant DN3 thymocytes were then transferred to Rag2−/− mice to evaluate their potential for Treg generation (Fig. 3b). SCD1 inhibitor did not affect the viabilities of OP9-DL1 cells nor disrupt the in vitro T cell developmental programs at the concentrations tested (Extended Data Fig. 7a–c). Adding SCD1 inhibitor into the co-culture systems effectively decreased oleic acid and increased stearic acid in DN3 thymocytes regardless of their origin (Fig. 3c). With the reduction in oleic acid, DN3 thymocytes showed more abundant Treg generation in Rag2−/− mice (Fig. 3d). When oleic acid (OA) was added to the in vitro T cell developmental system, the effects of SCD1 inhibitor on DN3 thymocytes were reversed (Extended Data Fig. 7d–f). Without SCD1 inhibitor, in vitro developed WT and Scd1−/− DN3 thymocytes have similar OA levels and generated comparable levels of Treg cells when co-transferred to Rag2−/− mice (Fig. 3c,d). This is consistent with our findings in the bone marrow transplantation experiments that SCD1 activities in the tissue environment, but not in thymocytes per se, influenced the Treg differentiation propensity.
Fig. 3: Oleic acid mediates the effects of SCD1 on preprogramming DN3 thymocytes for peripheral Treg cell generation.

a, Profile of total fatty acids in the thymus of Scd1−/− (n=6) and Scd1+/− mice (n=4) using the liquid chromatography-mass spectrometry (LC/MS) method (repeated 5 times). b, Schematic representation of the co-transfer strategies of in vitro developed DN3 thymocytes with or without the SCD1 inhibitor (A939572, 40 nM). c, The levels of stearic acid (18:0) and oleic acid (18:1n9) in in vitro developed CD45.1+ WT and CD45.2+ Scd1−/−DN3 thymocytes in the presence or absence of the SCD1 inhibitor (n=4 for WT and KO, n=6 for WTI, n=8 for KOI, repeated 3 times). d, The Treg cell levels in Rag2−/− mice received in vitro developed DN3 thymocytes as shown in Fig. 3b (n=8 mice for WT+KO, n=7 mice WT+KOI, n=9 mice for WTI+KO, repeated twice). e, Schematic representation of the oleic acid-rich diet (OA) or normal diet (ND) feeding experiments with or without CD4-depleting antibody administrated on day 1 and day 7 (n=4 mice for each group, repeated 3 times). f, The stearic acid (18:0) and oleic acid (18:1n9) levels in the thymi of mice in Fig. 3e were determined. g, Splenic CD4+CD62L+ T cells isolated from mice in Fig. 3e were subjected to Treg differentiation, and the efficiency of Treg induction was analyzed (n=3 biologically independent samples, repeated 3 times). h, The proportion of Treg cells among CD4+ T cells in the spleen and MLN of mice in Fig. 3e was determined by flow cytometry. Data are presented as Mean ± SEM. ns, no significance; by unpaired two-tailed Student’s t-test (a, c, f, g, h) or paired two-tailed Student’s t-test (d).
To further examine the role of OA in regulating the development of DN3 thymocytes to affect the subsequent Treg differentiation propensity, we fed Scd1−/− mice with an OA-enriched diet for two months (Fig. 3e). To ensure the analyzed T cells were de novo generated during OA feeding, we treated some mice with a CD4-depleting antibody (Fig. 3e). The OA-enriched diet increased OA and reduced stearic acid levels in the thymus of Scd1−/− mice (Fig. 3f). We then isolated naïve T cells from these mice to evaluate their tendency for Treg differentiation. Consistent with our findings in the in vitro T cell developmental system, newly developed naïve CD4+ T cells from Scd1−/− mice fed with the OA-enriched diet lost their preference for Treg differentiation (Fig. 3g). Treg levels among repopulated CD4+ T cells in the spleen and mesenteric lymph node (MLN) of Scd1−/− mice subjected to the OA-enriched diet were also normalized to the levels of Scd1+/− mice (Fig. 3h). The OA-enriched diet alone reduced Treg levels in the blood, liver, and lungs of Scd1−/− mice but not in the spleen and MLN (Fig. 3h and Extended Data Fig. 7g). This is likely due to a slow T cell turnover rates in the lymph nodes and spleen27. In the colon of Scd1−/− mice, the levels of Helios−RORγt+ and Helios+RORγt− Treg cells were both downregulated by the OA-enriched diet (Extended Data Fig. 7h,i). Nevertheless, these results demonstrate that oleic acid availability impacts DN3 thymocyte preprogramming and subsequent peripheral Treg differentiation.
Scd1 deletion in thymic K14+ cells imprints DN3 cells with pTreg propensity
Thymic epithelial cells are the major cell population supporting the development of thymocytes3. To ascertain whether oleic acid from thymic epithelial cells affects thymocytes, we conditionally deleted Scd1 in keratin14+ epithelial cells by crossing Scd1loxp mice with Keratin14cre mice (K14cre)28. In K14creScd1loxp mice, we did not observe organ abnormalities or growth defects except for thinner hair coat29, 30 (Extended Data Fig. 8a–c). Scd1 deletion did not affect the number of cortical and medullary thymic epithelial cells (Extended Data Fig. 8d). Also, the levels of critical factors governing thymocyte development were not influenced (Extended Data Fig. 8e,f). Next, we conducted mass spectrometry imaging to analyze the abundance and distribution of thymic fatty acids. The thymic oleic acid level was reduced in both Scd1−/− and K14creScd1loxp mice as compared to their littermate controls (Fig. 4a and Extended Data Fig. 8h,i). Notably, at the steady status there are higher levels of Treg cells in K14creScd1loxp mice as compared to littermate controls (Fig. 4b and Extended Data Fig. 8g). In in vitro system, CD4+CD62L+ T cells isolated from K14creScd1loxp mice were prone to differentiate into Treg cells (Fig. 4c). Furthermore, the K14creScd1loxp mice were also resistant to EAE induction with reduced mononuclear cell infiltrations in the CNS (Fig. 4d,e). Among the CNS-infiltrated CD4+ T cells, there are dramatically increased Treg cells but reduced Th1 and Th17 cells in K14creScd1loxp mice (Fig. 4f,g).
Fig. 4: Cre-mediated Scd1 deletion in thymic keratin14+ cells preprograms DN3 thymocytes with Treg cell propensity.

a, Mass spectrometry imaging of thymus sections of Scd1+/−, Scd1−/−, Scd1loxp, and K14creScd1loxp mice. Oleic acid signals were adjusted according to the levels of stearic acid to reflect the SCD1 activities in the thymus. b, Levels of CD4+Foxp3+ Treg cells in different organs of K14creScd1loxp and Scd1loxp mice (n=5 mice for Scd1loxp, n=4 mice for K14creScd1loxp, repeated 3 times). c, Splenic CD4+CD62L+ T cells of K14creScd1loxp and Scd1loxp mice were subjected to in vitro Treg differentiation (p<0.001, n=4 biologically independent samples for each group, repeated 3 times). d, EAE was induced in K14creScd1loxp and Scd1loxp mice, and disease scores were recorded daily (n=12 mice for Scd1loxp, n=10 mice for K14creScd1loxp, repeat twice). e, Mononuclear cells infiltrated into the spinal cords of K14creScd1loxp and Scd1loxp mice in Fig. 4d were counted on day 19 post-EAE induction. f, Foxp3 expression in CD4+ T cells isolated from the CNS of K14creScd1loxp and Scd1loxp mice with EAE induction in Fig. 4d was detected (p< 0.001, repeated twice). g, IFNγ and IL-17 expression by CD4+ T cells isolated from the CNS of K14creScd1loxp and Scd1loxp mice with EAE induction in Fig. 4d was detected (p<0.001 for both Th1 and Th17 comparisons, repeated twice). h, Thymocytes of CD45.2+ K14creScd1loxp and CD45.1+ WT mice at the DN2 or DN3 stage were mixed at a 1:1 ratio and co-transferred to irradiated (5 Gy) Rag2−/− mice. Treg cell levels in different tissues of Rag2−/− recipients were determined by flow cytometry (n=5 mice for each group, repeated twice). Data are presented as Mean ± SEM. ns, no significance; by unpaired two-tailed Student’s t-test (b, c, d, e, f, g) or paired two-tailed Student’s t-test (h).
To verify whether the developmental environment of K14creScd1loxp mice affects the CD4+ T cell differentiation, we transferred bone marrow from CD45.2+OT-II mice to lethally irradiated Scd1loxp or K14creScd1loxp mice. The resultant CD45.2+CD4+CD62L+TCRVβ5.1+ OT-II T cells were subsequently transferred to CD45.1+ WT mice to evaluate their differentiation potential in vivo (Extended Data Fig. 9a,b). To promote Treg differentiation, ovalbumin (OVA) was supplied in the drinking water of the recipient mice. For the induction of Th1/Th17 cells or Th2 cells, the recipient mice were immunized with OVA emulsified in complete Freund’s adjuvant or Alum, respectively. The differentiation potential of these OT-II T cells was evaluated by analyzing the percentage and absolute number of distinct CD4+ T cell subsets. We found that OT-II T cells developed in K14creScd1loxp mice displayed a propensity for Treg generation, but an impaired ability to differentiate into Th17 cells (Extended Data Fig. 9d,e). However, their capacity to differentiate into Th1 and Th2 cells remained unaltered (Extended Data Fig. 9f,g). We also analyzed the T cell differentiation potential of these OT-II T cells in vitro by adding OVA323–339 peptide to a mixture of CD45.2+CD4+CD62L+TCRVβ5.1+ cells and CD45.1+WT splenocytes in the presence of cytokines for Th1, Th2, Th17, or Treg induction. Under these conditions, OT-II T cells developed in K14creScd1loxp mice exhibited an augmentation in Treg differentiation and a reduction in Th17 differentiation (Extended Data Fig. 9h,i). On the other hand, the induction of Th1 and Th2 cells as well as OVA-stimulated proliferation was comparable between the two groups (Extended Data Fig. 9 c,j,k). Therefore, Scd1 deletion in K14+ cells influences the differentiation potential of T cells, shifting the reciprocal balance of Treg/Th17 cells in favor of Treg induction.
As shown above, thymocytes acquired the preference for Treg differentiation during the DN2-DN3 transition (Fig. 2e). To verify whether the same phenomena existed in K14creScd1loxp mice, we co-transferred DN2 or DN3 thymocytes isolated from K14creScd1loxp and control mice into Rag2−/− mice. In K14creScd1loxp mice, the Treg differentiation preference was also imprinted on DN3 thymocytes (Fig. 4h).
It is noteworthy that in K14Cre mice, Cre is also expressed by epithelial cells outside the thymus31. To directly assess the role of the thymic epithelium, we transplanted thymi from K14creScd1loxp mice and their littermate controls to C57BL/6 nude mice (Fig. 5a–b). CD4+ T cell populations were reconstituted within three months, displaying comparable efficiency between two groups (Fig. 5c). Notably, an enhanced level of CD4+Foxp3+ Treg cells was observed in nude mice transplanted with thymi from K14creScd1loxp mice (Fig. 5d). We also isolated CD4+CD62L+ cells from these nude mice to evaluate their potential to become Treg cells upon in vitro induction. T cells developed in the engrafted thymi of K14creScd1loxp mice in nude mice exhibited a significantly enhanced capability for Treg differentiation compared to those from the control group (Fig. 5e). Upon EAE induction in these C57BL/6 nude mice, MOG-specific T cell activation can be observed in both groups. However, in contrast to the EAE progression in nude mice transplanted with thymi from Scd1loxp mice, almost no signs of EAE were present in mice engrafted with thymi of K14creScd1loxp mice (Fig. 5f,g). Correspondingly, increased Treg levels were observed in nude mice transplanted with K14creScd1loxp thymi upon EAE induction (Fig. 5h). These results demonstrate that Scd1 deficiency in K14+ thymic epithelium endows DN3 thymocytes with an increased potential in Treg differentiation and conferred mice EAE resistance.
Fig. 5: Enhanced Treg differentiation and EAE resistance in nude mice transplanted with thymi from K14creScd1loxp mice.

a, Schematic representation of the thymus transplantation experiments. b, Gating strategies (with the spleen as a representative) employed for Treg analysis in Figure 5. c-e, Thymi of K14creScd1loxp mice and littermate controls were T cell-depleted and engrafted under the kidney capsule of C57BL/6 nude mice (n=6 mice for each group, repeated twice). Mice were euthanized 3 months post-transfer, and the total number of CD4+ T cells (c) and the ratio of CD4+Foxp3+/Total CD4+ T cells (d) in various organs were quantified. Splenic CD4+CD62L+ T cells from nude mice were subjected to Treg induction in vitro and examined for Foxp3 expression (e, n=4 biologically independent samples, p<0.001, performed once). f, EAE was induced in nude mice 3 months after thymus transplantation (n=5 mice for each group, performed once). Mice were immunized with MOG35–55 emulsified in CFA on day 1 and day 14, and disease scores were recorded daily. The incidence of EAE was also recorded. g-h, EAE mice were euthanized on day 45 post EAE induction. Splenocytes from nude mice in Fig. 5f were labeled with CFSE and stimulated with MOG35–55 (20 μg/ml) for 96 hours to assess CFSE dilution as an indicator of CD4+ T cell proliferation (g, n=3 biologically independent samples per group). The percentage of Foxp3+ T cells among total CD4+ T cells in the spleen, draining lymph node, and CNS in EAE mice from Fig. 5f was determined (h). Data are presented as Mean ± SEM. ns, no significance; by unpaired two-tailed Student’s t-test.
Scd1 deficiency augments ATP2A2 to promote Treg differentiation
We have thus far demonstrated that the Treg bias phenotype of naïve T cells in Scd1−/− mice was gained at the DN2-DN3 transition stage and sustained in naïve CD4+ T cells, suggesting possible epigenetic changes imprinted to DN3 thymocytes. Therefore, we employed ATAC-seq to compare the chromatin accessibility in DN3 thymocytes and naïve CD4+ T cells isolated from Scd1−/− mice with the corresponding cell populations from the littermates. The ATAC-seq showed that Scd1 deficiency affected the chromatin accessibility in DN3 thymocytes and naïve CD4+ T cells (Extended Data Fig. 10a). One of the differential ATAC peaks in both DN3 thymocytes and naïve CD4+ T cells of Scd1 deficient mice was presented at the genetic locus of Atp2a2 (Fig. 6a and Extended Data Fig. 10b). Consistently, naïve CD4+ T cells of Scd1−/− mice showed enhanced expression of ATP2A2 at both mRNA and protein levels (Fig 6b and Extended Data Fig. 10c). The effects of SCD1 on ATP2A2 expression were also verified in in vitro developed DN3 thymocytes with the SCD1 inhibitor (Extended Data Fig. 10d). However, when SCD1 inhibitor was added to naïve CD4+ T cells subjected to Treg differentiation conditions, neither ATP2A2 expression nor Treg differentiation was affected (Extended Data Fig. 10e,f).
Fig. 6: Scd1 deficiency augments ATP2A2 expression to facilitate Treg differentiation.

a, The screenshot of IGV browser of Atp2a2 gene locus in CD44−CD25+ DN3 thymocytes and splenic CD4+CD62L+ T cells isolated from Scd1−/− and Scd1+/− mice. b, The ATP2A2 protein levels of splenic CD4+CD62L+ T cells isolated from Scd1−/− and Scd1+/− mice (repeated with 3 independent experiments). c, Western blotting analysis for the phosphorylation of Zap70, SLP76, PLCγ1, and LAT in activated naïve CD4+ T cells (repeated with 3 independent experiments). d, Naïve CD4+ T cells isolated from Scd1+/− and Scd1−/− mice were labeled with fluorescence, mixed at a 1:1 ratio, and loaded with calcium indicator for flow cytometrical detection of store-operated calcium entry induced by thapsigargin (TG) or crosslinking of anti-CD3/anti-CD28 by goat anti-hamster IgG (GAH) (repeated with 3 independent experiments). e, Store-operated calcium entry in splenic CD4+CD62L+ T cells transfected with Atp2a2 siRNA or scramble siRNA (NC) was detected by flow cytometry (repeated with 3 independent experiments). f, Naïve T cells from Scd1−/− and Scd1+/− mice were transfected with Atp2a2 siRNA or scramble siRNA (NC), rested for 24 hours, and then subjected to Treg differentiation medium for 72 hours. The efficiency of Treg induction was assessed (n=4 for each group, repeated for 3 times). g-h, Nuclear translocation of NFAT1 in CD4+ T cells isolated from Scd1−/− and Scd1+/− mice was examined by immunofluorescent staining upon anti-CD3/anti-CD28 stimulation for 120 min (repeated with 3 independent experiments). i, The binding of NFAT1 to the Foxp3 genetic locus in activated T cells was determined by the chromatin immunoprecipitation assay (n=4 biologically independent samples, repeated 3 times). Anti-Histone H3 (H3) and rabbit IgG (IgG) were served as positive control and negative control for the ChIP-qPCR analysis. Data are presented as Mean ± SEM. ns, no significance; by unpaired two-tailed Student’s t-test.
ATP2A2, also known as sarco/ER Ca2+-ATPase, is an ion pump transporting Ca2+ from the cytosol to the endoplasmic reticulum and plays a critical role in regulating TCR signal transduction32. We found that although the proximal events of TCR signaling were not altered by Scd1 deficiency (Fig. 6c and Extended Data Fig. 10g), the store-operated calcium entry (SOCE) was more prominent in naïve CD4+ T cells of Scd1−/− mice than that of Scd1+/− mice (Fig. 6d). We further showed that Atp2a2 silencing using siRNA reduced SOCE and in vitro Treg differentiation of Scd1−/− naïve CD4+ T cells subjected to in vitro Treg differentiation (Fig. 6e,f and Extended Data Fig. 10h,i). Furthermore, we found that CD4+ T cells with ATP2A2 overexpression exhibited increased in vitro Treg differentiation (Extended Data Fig. 10j,k). Thus, the enhanced ATP2A2 expression is a key in mediating Treg differentiation propensity in Scd1−/− mice.
It is well known that cytosolic Ca2+ activates calcineurin to dephosphorylate the nuclear factor of activated T-cells (NFAT)33. Dephosphorylated NFAT1 has been shown to promote Treg differentiation upon nuclear translocation34, 35. Since naïve Scd1−/− CD4+ T cells exhibited enhanced SOCE, we sought to determine whether there was increased NFAT1-mediated activation of Foxp3. We found that upon antiCD3/anti-CD28 stimulation, the nuclear translocation of NFAT1 and its binding to the Foxp3 genetic locus were dramatically increased in CD4+ T cells from Scd1−/− mice than those from Scd1+/− mice (Fig. 6g–i). Therefore, naïve CD4+ T cells from Scd1−/− mice have increased NFAT1-mediated activation of Foxp3 upon TCR stimulation.
Lack of OA allows DOT1L to epigenetically promote ATP2A2 expression
To investigate how Scd1 deficiency affected the epigenetic landscape that enhanced ATP2A2 expression, we compared the histone modification profiles in DN3 thymocytes and naïve CD4+ T cells from Scd1−/− and Scd1+/− mice by Mod Spec36, a mass spectrometry-based method simultaneously measuring the relative abundance of 80 different histone modifications (Fig. 7a). Among the histone modifications detected, we noticed that Scd1 deficiency dramatically elevated the dimethylation levels at lysine 79 of histone H3 (H3K79me2) in both DN3 thymocytes and naïve CD4+ T cells (Fig. 7b). H3K79me2 is a histone marker for chromatin regions with transcriptionally active genes and high levels of H3K79me2 modifications in histone open chromatin37. ChIP-qPCR analysis showed that high H3K79me2 modification occupied the genetic locus of Atp2a2 in DN3 thymocytes and naïve CD4+ T cells from Scd1−/− mice (Fig. 7c,d). We also found that in vitro supplementation of SCD1 inhibitor to the OP9-DL1 T cell development system enhanced H3K79me2 signals within the genome of DN3 thymocytes (Extended Data Fig. 10l). H3K79me2 levels at the genetic locus of Atp2a2 were also elevated in SCD1 inhibitor-treated DN3 cells (Extended Data Fig. 10m), which was further validated by ChIP-qPCR analysis (Fig. 7e,f and Extended Data Fig. 10n). Importantly, these effects were reverted by oleic acid (Fig. 7e,f and Extended Data Fig. 10n).
Fig. 7: OA inadequacy unlashes DOT1L to promote H3K79me2-dependent ATP2A2 expression.

a-b, Histone modifications in DN3 thymocytes and naïve T cells isolated from Scd1+/− and Scd1−/− mice were determined by Mod Spec with 3 measurement repeats. (a) Heatmap display of the detected histone modifications. (b) The relative abundance of H3K79me2 in DN3 thymocytes and naïve CD4+ T cells. c, ChIP-qPCR analysis of histone modification levels at the Atp2a2 genetic locus of DN3 thymocytes from Scd1+/− and Scd1−/− mice (n=4 per group, repeated twice with biologically independent samples). d, ChIP-qPCR analysis of histone modification levels at the Atp2a2 genetic locus of naïve CD4+ T cells isolated from Scd1+/− and Scd1−/− mice (n=4 for H3K79me2, H3K9me3; n=3 for H3K4me2, H3K27me3, repeated twice with biologically independent samples). e-f, SCD1 inhibitor A939572 (40 nM) and oleic acid (20 μM) were supplied to the in vitro T cell development system. The resultant DN3 thymocytes were examined for the H3K79me2 levels at the Atp2a2 genetic locus (e, n=4 per group) and the protein levels of ATP2A2 (f), repeated with 3 independent experiments. g-h, SCD1 inhibitor A939572 (40 nM) and DOT1L inhibitor EPZ004777 (10 μM) were supplied to the in vitro T cell development system. The resultant DN3 thymocytes were examined for the H3K79me2 levels at the Atp2a2 genetic locus (g, n=4 per group) and the protein levels of ATP2A2 (h), repeated with 3 independent experiments. i, Oleic acid or stearic acid was diluted to the indicated concentrations with 10% DMSO and supplied to an enzymatic reaction catalyzed by DOT1L (n=4 for oleic acid, n=3 for stearic acid, repeated 3 times). The effects of oleic acid and stearic acid on the enzymatic activity of DOT1L were determined by the DOT1L Chemiluminescent Assay Kit (BPS Bioscience, cat no.52202). Data are presented as Mean ± SEM. ns, no significance; by unpaired two-tailed Student’s t-test.
H3K79me2 is catalyzed by a specific methyltransferase named disruptor of telomeric silencing 1-like (DOT1L)38. To determine whether there is a causal effect between H3K79me2 levels and the SCD1-mediated ATP2A2 expression, we supplied DOT1L inhibitor EPZ004777 or EPZ005676 together with the SCD1 inhibitor to the in vitro T cell development system. DOT1L inhibitors reduced H3K79me2 and ATP2A2 levels induced by the SCD1 inhibitor (Fig. 7g–h and Extended Data Fig. 10o,p). Since it has been shown that DNA methyltransferase activity can be directly affected by oleic acid39, we also tested the effect of oleic acid on DOT1L, a histone methyltransferase, by directly supplying oleic acid to its catalytic reaction. We found that the presence of oleic acid, but not stearic acid, reduced the enzymatic activity of DOT1L (Fig. 7i). Palmitoleic acid also showed some effects on DOT1L, but to a lesser extent (Extended Data Fig. 10r). Since DOT1L exerts an enzymatic function in the nucleus, we conducted an analysis of nuclear lipids and found a reduction in oleic acid in the nucleus of Scd1−/− thymocytes (Extended Data Fig. 10q). Taken together, the increased ATP2A2 expression caused by oleic acid paucity is likely through the DOT1L-mediated H3K79me2 modifications at the DN3 stage.
Discussion
Epigenetic changes in developing thymocytes have been shown to control stage commitment40, 41. However, the long-lasting effect of epigenetic modifications in early thymocytes on subsequently peripheral T cell subset differentiation remains elusive. We found that the oleic acid production mediated by SCD1 in thymic epithelial cells is critical for modulating the Treg differentiation potential of naïve CD4+ T cells. Without Scd1, the Atp2a2 locus in early thymocytes undergoes dramatic epigenetic changes, which persist in naïve CD4+ T cells. Upon TCR activation, these naïve CD4+ T cells exhibit a high tendency to become Treg cells. Therefore, we uncovered a novel mechanism through which fatty acid availability persistently affects T cells from early thymic development to Treg differentiation in the periphery.
The seemingly homogeneous pool of naïve CD4+ T cells is actually heterogeneous. A recent study divided naïve T cells into subpopulations based on chromatin accessibilities through which Th1 or Th2 differentiation potentials can be predicted42. However, the origins and mechanisms underlying the inherent epigenetic heterogeneities among naïve T cells remain largely unknown. Our finding that oleic acid availability affects the epigenetics of early thymocytes at the DN2-DN3 transition provides a novel mechanism through which the fatty acid affects the histone methylation status at the Atp2a2 locus to predispose naïve CD4+ T cells for Treg differentiation. Distinct from the signals, including antigens (Signal 1), costimulatory molecules (Signal 2), and cytokines (Signal 3)43, 44, that are well-understood in the processes of T cell activation and differentiation, the signals provided by thymic oleic acid can act as Signal “0”, which can be instilled in developing T cells before TCR stimulation and subsequently influence the responsiveness of naïve T cells. Therefore, deciphering Signal “0” instilled in T cells during their development could help to understand the heterogeneity of T cells in the same pathophysiological microenvironment and provide new strategies to manipulate T cell responses in the context of infection, autoimmune diseases, and cancer.
Our findings have demonstrated that a decrease in thymic oleic acid leads to early thymocytes being preprogrammed for Treg differentiation. Thus, it could be inferred that maintaining physiological levels of oleic acid in the thymus of a Scd1-competent host restrains the capacity of naïve T cells to overly differentiate into Treg cells. While Treg cells are indispensable for immune homeostasis, an excess of Treg cells could elevate the risk of tumor development45. Therefore, oleic acid in the thymus is a key in suppressing superfluous peripheral Treg generation. In addition, our experiments suggest that oleic acid supplementation can influence thymic oleic acid levels. Considering that the thymus has long been recognized as a “nutritional barometer” due to its remarkable sensitivity to nutritional fluctuation46, the sensing of extrathymic oleic acid levels by the thymus and its role in regulating the Treg differentiation potential warrants further investigation.
Treg cells are classified into peripherally induced- and thymus derived- ones. We have proved that Scd1 deficiency in thymic epithelial cells resulted in the elevated level of pTreg cells through regulating oleic acid availability of these early developing thymocytes. However, it is unclear whether Scd1 also affects the generation of tTreg cells. Although we did observe enhanced levels of Helios+ Treg cells in various organs of K14creScd1loxp mice, the number of CD4+Foxp3+ Treg cells in the thymus is not affected by Scd1 deficiency. One alternative interpretation is that these peripheral Helios+ Treg cells are related to the expansion after being exported to the periphery, which deserves further investigations in future studies.
The present results show that the heightened calcium in CD4+ T cells of Scd1−/− mice is crucial in promoting Treg generation. Calcium signaling is a key process governing T cell activation and differentiation, but its impact on CD4+ T cell fate remains complex and could be context-dependent. Studies in mice lacking specific calcium signaling molecules have shown different influences on Th17 and Treg cell populations. For instance, mice lacking Stim1/Stim2 exhibit reduced Treg levels due to impaired calcium signaling47, while Orai1−/− mice show decreased Th17 differentiation without affecting Treg cells48. Interestingly, a recent study identified a subpopulation of naïve T cells that are intrinsically inclined toward pTreg differentiation due to elevated calcium-NFAT signaling49. Also, this NFAT-Foxp3 pathway is critical for the induction of peripherally-derived Treg (pTreg) cells, driven by a high-affinity antigenic stimulation35.
The rate of T-cell lymphopoiesis under physiological conditions is relatively low in adult humans. De novo thymic T cell generation in adults occurs following lymphopenia induced by chemotherapy, radiotherapy, or infections50. Modulating the responsiveness of T cells during their development through manipulating oleic acid availability or the SCD enzymatic activity provides a unique opportunity to combat immune disorders. Also, we can employ the in vitro T cell developmental system with oleic acid depletion to acquire more T cell progenitors with Treg cell tendency and adoptively transfer them to the recipients suffering from autoimmune diseases. Taken together, the discovery of T cell development at the DN2-DN3 stage regulated by oleic acid in the thymic developmental microenvironment creates opportunities to regulate T cell immune responses.
Methods
Mice and Cell Lines
All mice used in this project were maintained in a specific pathogen-free (SPF) facility of the Shanghai Institute of Nutrition and Health of the Chinese Academy of Sciences with standard conditions (12 h light/dark cycle, 20~24°C, 40%~60% humidity). The gender of the mice does not affect the conclusion of this study. Both male and female mice of 6–12 weeks were used in experiment. All animal experiments were in full compliance with the ethical regulations for animal testing and research and were proved by the Institutional Animal Care and Use Committee, Shanghai Institute of Nutrition and Health, Chinese Academy of Science. In all experiments, age- and sex-matched mice were randomized to each experimental group. Data collection and analysis were not performed blind to the conditions of the experiments. No animal was excluded from the study. CD45.2+ mice and CD45.1+ mice were obtained from Shanghai Laboratory Animal Center of the Chinese Academy of Science. Rag2−/− mice (B6(Cg)-Rag2<tm1.1Cgn>J) and Scd1−/− mice (B6.129-Scd1tm1Ntam/J) were from the Jackson laboratory. CD4cre mice (B6.Cg-Tg(CD4-cre)1Cwi N9) were from the Taconic. Scd1loxp mice (C57BL/6-Scd1em1(flox)Smoc, NM-CKO-2110375) were constructed by Shanghai Model Organisms Center. K14cre mice were kindly provided by Professor Xinhua Liao from the University of Shanghai. C57BL/6 nude mice were purchased from Shanghai SLAC Laboratory Animal. Co., Ltd. OT-II mice were purchased from Wuhan Youdu Biotechnology Co., Ltd. The OP9-DL1 cell line was kindly provided by Professor Jinyong Wang. The membrane expression of DLL1 in OP9-DL1 cells is verified by flow cytometry.
In vitro Cell Differentiation
CD4+CD62L+ naïve T cells were isolated from mice spleen using the mouse CD4+ CD62L+ T Cell Isolation Kit (Miltenyi Biotech, cat no.130-104-453) according to the manufacturer’s instructions. Naïve CD4+ T cells were then seeded into 96-well flat bottom plates (5×10⁵/well) with 250 μL RPMI-1640 medium. Anti-CD3 (5 μg/mL, Thermo Fisher Scientific, cat no.16-0032-86), anti-CD28 (2 μg/mL, Thermo Fisher Scientific, cat no.16-0281-86), IL-2 (50 ng/mL, R&D systems, cat no. 402-ML-100), and TGF-β (5 ng/mL, R&D systems, cat no. 7666-MB) were supplied to induce Treg cells. For Th1 differentiation, anti-CD3 (5 μg/mL, Thermo Fisher Scientific, cat no.16-0032-86), anti-CD28 (2 μg/mL, Thermo Fisher Scientific, cat no.16-0281-86), IL-2 (20 ng/mL, R&D systems, cat no. 402-ML-100), IL-12 (20 ng/mL, R&D systems, cat no. 419-ML-050), and anti-IL4 (10 μg/mL, R&D systems, cat no. MAB404) were supplied to culture medium. For Th2 cell differentiation, anti-CD3 (5 μg/mL, Thermo Fisher Scientific, cat no.16-0032-86), anti-CD28 (2 μg/mL, Thermo Fisher Scientific, cat no.16-0281-86), IL-2 (20 ng/mL, R&D systems, cat no. 402-ML-100), IL-4 (100 ng/mL, R&D systems, cat no. 404-ML-050), anti-IFNγ (10 μg/mL, R&D systems, cat no. MAB4851), and anti-IL-12(10 μg/mL, R&D systems, cat no. AF-419-NA) were supplied to culture medium. For Th17 differentiation, anti-CD3 (5 μg/mL, Thermo Fisher Scientific, cat no.16-0032-86), anti-CD28 (2 μg/mL, Thermo Fisher Scientific, cat no.16-0281-86), TGF-β (3 ng/mL, R&D systems, cat no. 7666-MB), IL-6 (20 ng/mL, R&D systems, cat no. 406-ML-025), anti-IL4 (10 μg/mL, R&D systems, cat no. MAB404), and anti-IFNγ (10 μg/mL, R&D systems, cat no. MAB4851) were supplied to culture medium. For OVA-stimulated T cell subset differentiation, OVA323–339 peptide (5 ng/ml, MCE, cat no: HY-P0286) was added to a mixture of CD45.2+CD4+CD62L+TCRVβ 5.1+ cells (2 × 10⁵) and CD45.1+WT splenocytes (6 × 10⁵) to activate OT-IItg T cells in the presence of cytokines and neutralizing antibodies for Th1, Th2, Th17, or Treg induction.
In vitro T Cell Development
OP9-DL1 was seeded in gelatin (0.1%) coated 6 well plates. Lin−Sca1highCD117+ hematopoietic progenitor cells were obtained from the bone marrow of 8-week-old mice by sorting flow cytometrically. Isolated HSCs (1×10⁴ cells/ well) were co-cultured with OP9-DL1 cells in complete αMEM (15% FBS) supplemented with 5 ng/mL Flt-3L (Peprotech, cat no. 250–31L-50) and 2 ng/mL IL-7 (Peprotech, cat no.217-17-50). HSCs were detached from the co-culture by vigorously pipetting every 5 days and transferred on to new 6 well plates precultured with OP9-DL1 cells.
Flow Cytometric Analysis and Cell Sorting
Fluorescence-conjugated antibodies for CD4 (PerCP-Cyanine5.5, RM4–5 or FITC, GK1.5), CD45 (FITC, 30-F11 or APC, 30-F11), Foxp3 (PE, FJK-16s), CD45.2 (APC, 104 or FITC, 104), CD45.1 (APC, A20), CD45.1 (FITC, A20), CD44 (PerCP-Cyanine5.5, IM7), CD44 (PE, IM7), CD25 (PE, PC61.5 or APC, PC61.5), CTLA-4 (APC, UC10–4B9), GITR (APC, DTA-1), CD11b (FITC, M1/70), CD8a (FITC, 53–6.7 or PE 53–6.7), mouse hematopoietic lineage antibody cocktail (FITC), Sca-1 (PE, D7), and TCR γ/δ (FITC, UC7–13D5) were from eBioscience. CD3 (FITC, 145–2C11), CD117 (APC, 2B8), CD45RB (PE, C363–16A), CD8 (BV785, 53–6.7), DLL1 (PE, HMD1–3) Epcam1 (PE/Cy7, G8.8), CD4 (Bv605, RM4–5), TCRvβ 5.1 (APC, MR9–4), IL-4 (PE, 11B11), and CD45.1 (APC/Cy7, A20) were from Biolegend. Foxp3 (Bv421. FJK-16s), RoRγt (PE, AFKJS-9), Helios (FITC, 22F6), NRP1 (APC, 3DS304M), CD8β (APC, eBioH35–17.2 (H35–17.2)), TCRβ (PE, H57–597) and LIVE/DEAD™ Fixable Near-IR Dead Cell Stain Kit (cat no. L34976) were from Invitrogen. Ly51 (Bv421, 6C3) was from BD Bioscience. UEA1 (DyLight 649) was from Vector Laborites. Antibodies used for flow cytometry were used at 1:200 dilution. Stained cells were analyzed on CytoFLEX S (Beckman Coulter), CytoFLEX LX (Beckman Coulter), or Calibur (BD) using CytExpert or CellQuest acquisition software. Flow cytometry data were analyzed by FlowJo (TreeStar). Moflow cell sorter (Beckman Coulter) was used for cell sorting.
Calcium Flux Analysis
Naïve T cells isolated from Scd1−/− mice and Scd1+/− mice were stained with APC conjugated anti-CD45 antibody (eBioscience, cat no.17–0451-83) or unconjugated anti-CD45 (eBioscience, cat no. 14–0451-82). These stained cells were then mixed at a 1:1 ratio and loaded with Fluo-8 dye (Abcam, cat no. ab112129) according to the manufacturer’s instructions. The fluo-8 loaded cells were washed with calcium-free Ringer’s buffer 3 times to remove any extracellular calcium. 1 × 10⁷ naïve T cells were resuspended in 2 mL calcium-free Ringer’s buffer and subjected to flowcytometric analysis (CytoFLEX S, Beckman Coulter). The intracellular calcium signaling of Scd1−/− T cells (APC+) and Scd1+/− T cells (APC−) was acquired simultaneously. Thapsigargin (1 μM, MCE, cat no. HY-13433–1) or goat anti-hamster IgG (SouthernBiotech, cat no.6060–01) to induce anti-CD3/CD28 crosslinking were used to induce the calcium release from the endoplasmic reticulum. For goat anti-hamster IgG mediated crosslinking, fluo-8 loaded cells were incubated for 15 min at 20~24 °C with 5 μg/mL anti-CD3 (Thermo Fisher Scientific, cat no.16–0031-86) and 5 μg/mL anti-CD28 (Thermo Fisher Scientific, cat no.16–0281-86). The crosslinking was achieved by adding 10 μg goat anti-hamster IgG into anti-CD3/CD28 coated T cell suspension in 2 mL calcium-free Ringer’s buffer. Store-operated Ca2+ influx could be observed when 2 mM CaCl2 was supplied to thapsigargin or goat anti-hamster IgG treated T cells. To analyze calcium signaling in Atp2a2 knockdown Scd1−/− T cells, primary Scd1−/− T and Scd1+/− T were transfected with Atp2a2 siRNAs or scramble controls with a Mouse T Cell Nucleofector™ Kit (Lonza, VPA-1006) and rested for 24 hours. Cells were labeled with LIVE/DEAD™ Fixable Near-IR Dead Cell Stain to ensure all the analyzed cells are viable. Atp2a2 siRNA and scramble controls were purchased from Gene Pharma, Shanghai.
Bone Marrow Chimerism
Recipient mice (CD45.2+) were lethally irradiated (10 Gy) and were then reconstituted by intravenous injection of a 1:1 mixture of WT (CD45.1+) and Scd1−/− (CD45.1+CD45.2+) donor mice derived bone marrow cells (1 × 10⁷ cells in total). Chimeras were analyzed 10 weeks after reconstitution.
Adoptive Transfer of CD4+ T Cells
Mouse CD4+ T cells were isolated from the spleen by a Mouse CD4 T Cell Isolation Kit (Miltenyi Biotec, cat no.130–095-248). CD4+CD45RBhi T cells were further purified by flow cytometric sorting based on their surface marker expression and were intraperitoneally injected into Rag2−/− recipient mice (2 × 10⁵ cells/ mouse). In the co-transfer assay, CD4+CD45RBhi T cells from CD45.1+ mice and CD45.2+ mice were mixed at a 1:1 ratio and a total number of 2 × 10⁵ cells were i.p. injected into Rag2−/− recipient mice. Mice were euthanized on day 60 after transfer. In the co-transfer of CD4+CD25+ T cells and CD4+CD62L+ T cells, CD4+CD25+ T cells were isolated from the spleen of either CD45.2+ WT mice or CD45.2+ Scd1−/− mice and then mixed with CD4+CD62L+ cells (2 × 10⁵ cells/ mouse) from CD45.1+ WT mice at a 1:1 ratio before intravenous injection into Rag2−/− mice. In the co-transfer of CD4+CD8−CD73−CD25− thymocytes, CD8+ thymocytes were initially depleted using magnetic beads and the remaining cells were subjected to flow cytometry sorting. CD4+CD8−CD73−CD25− thymocytes (2 × 10⁶ cells/ mouse) from both CD45.1+WT and CD45.2+ Scd1−/− mice were mixed at a 1:1 ratio and intravenously injected into CD45.1+CD45.2+ WT mice (3 Gy irradiated).
Adoptive Transfer of Double Negative (DN) and Double Positive (DP) Thymocytes
Mouse CD4 (L3T4) MicroBeads (Miltenyi Biotec, cat no. 130–117-043) were used to deplete CD4+ thymocytes. The resulting cells were further purified by flow cytometric sorting based on surface markers expression: Lin−CD4−CD8−CD44+CD25− (DN1), Lin−CD4−CD8−CD44+CD25+ (DN2), Lin−CD4−CD8−CD44−CD25+ (DN3), Lin−CD4−CD8−CD44−CD25− (DN4). CD45.1+ WT DN thymocytes and CD45.2+ Scd1−/− DN thymocytes were mixed at a 1:1 ratio and intravenously administered into irradiated (5 Gy) Rag2−/− recipient mice. For DN1 and DN2 transfer, 2×10⁴ total cells were administrated, and the Rag2−/− recipient mice were euthanized on day 40 after transfer. For DN3 and DN4 transfer, 2×10⁵ total cells were administered and the Rag2−/− recipient mice were euthanized on day 60 after transfer. DP cells were sorted from thymic single cell suspension stained with CD4-PerCP/Cyanine5.5 (eBioscience, cat no.45–0042-82) and CD8a-APC (Biolegend, cat no.100712) by a Moflow cell sorter and transferred to irradiated (5 Gy) Rag2−/− recipient mice at a total number of 1×10⁶ via intravenous injection. Rag2−/− mice receiving DP transfer were euthanized on day 60 after transfer. Intrathymic injection of DN cells was performed on 5 to 6-week-old CD45.1+CD45.2+ mice (3 Gy irradiated). Mice were anesthetized by intraperitoneal injection of tribromoethanol. The chest fur was removed using a hair clipper to expose the skin. The mouse was then placed onto a restraint and positioning apparatus, and its extremities were secured with surgical adhesive tape on the positioning plate. Using surgical scissors, the sternum was opened to expose the thymus, and 10 μl of cells (2×10⁴ cells for DN1/2 transfer; 2×10⁵ cells for DN3/4 transfer) were injected into the thymus using a microsyringe. The incision was then sutured. The mouse was placed in a dry, warm, and clean recovery environment to allow for gradual awakening. During the recovery process, the mouse’s behavior and condition were closely monitored to ensure its full and uneventful recovery.
Induction of Experimental Autoimmune Encephalomyelitis
Age- and sex-matched mice were injected subcutaneously with 200 μg MOG35–55 peptide (GL Biochem) emulsified in incomplete Freund’s adjuvant (Sigma-Aldrich) supplemented with 5 mg/mL heat-killed Mycobacterium tuberculosis H37Ra (Becton Dickinson). On the day of immunization and 48 h later, each mouse was injected intraperitoneally with 200 ng pertussis toxin (Sigma-Aldrich) in PBS. The immunized mice were examined daily and scored for disease severity using the standard method: 0, no clinical signs; 0.5, partially limp tail; 1, paralyzed tail; 2, loss in coordinated movement, hind limb paresis; 3, one hind limb paralyzed; 4, both hind limbs paralyzed; 5, moribund or death.
Gene Expression Analysis
Total RNA was extracted from cells using an RNAprep pure Cell/Bacterial Kit (TIANGEN Biotech, DP430) and reverse-transcribed using the PrimeScript RT Master Mix (TaKaRa, RR036A). Real-time PCR was conducted with FastStart Universal SYBR Green Master Mix (Roche, 04913914001), cDNA and 500 nmol primers for a total PCR reaction volume of 10 μL. SDS Software 2.4 was used to collect Real-time Quantitative PCR data from Applied Biosystems 7900HT. All the primer sequences corresponding to targeted genes are listed in the Supplementary Table 1.
Chromatin Immunoprecipitation-qPCR
Chromatin isolation and preparations were conducted according to the manufacturer-recommended procedure provided in the ChIP-IT® PBMC Kit (Active Motif, cat no.53040). Briefly, 10 million T cells were fixed with 5 mL 1% formaldehyde and 250 μL stop solution was added to terminate the fixation. Cells were washed twice with 5 mL ice-cold detergent in PBS by centrifugation at 3200 g. The cell pellet was resuspended in 500 μL Chip Buffer supplemented with 5 μL of a protease inhibitor cocktail and 5 μL PMSF. Chromatin was sheared by sonication using an ultrasonic homogenizer (JY92-IIDN) at 10% amplitude, pulse for 2 seconds on and 6 seconds off for 10 minutes. Sheared chromatin (200 μg) was immunoprecipitated using 5 μg ChIP-validated antibody and protein G agarose beads. ChIP-DNA was eluted in 200 μL elution buffer for ChIP-PCR. Sheared chromatin (20 μg) was used as Input-DNA. Chip antibodies were used as follows: NFAT1 antibody (CST, cat no.4389S), H3K79me2 antibody (Active Motif, cat no. 39143), H3K9me3 antibody (Active Motif, cat no. 39161), H3K4me2 antibody (Active Motif, cat no. 39141), and H3K27me3 (Active Motif, cat no. 39155). All the primer sequences corresponding to targeted gene sites are listed in the Supplementary Table 1.
Assay for Transposase-Accessible Chromatin with Sequencing (ATAC-seq)
DN3 thymocytes (1 × 10⁶) and splenic naïve T cells (5 × 10⁶) were isolated from Scd1+/− and Scd1−/− mice as described above for ATAC-seq, which was performed by Romics (Shanghai). Quality filtered reads were then mapped to the mm10 reference genome using BWA (0.7.10). The bam file generated by the unique mapped reads as an input file, using macs2 software for callpeak with cutoff q value < 0.05.
Whole Genome ChIP Sequencing Analysis
The H3K79me2 ChIP-seq experiments and data processing were performed by a proficient epigenetic services team at Active Motif. DN cells were fixed with a 1% formaldehyde solution and incubated at 20~24 °C temperature for 10 minutes. To halt the fixation process, glycine was added to the culture dishes to achieve a final concentration of 0.125 M for 5 minutes. The fixed DN cells were then collected by scraping and centrifugation at 1000g for 5 minutes. After fixation, the DN cells were washed twice with ice chilled PBS containing 0.5% Igepal CA-630. Subsequently, the cells were resuspended in 10 ml of PBS containing 0.5% Igepal CA-630 and 1 mM PMSF. The suspension was centrifuged, and the supernatant was carefully removed from the cell pellets. The cell pellets were then snap-frozen in liquid nitrogen for 10 minutes and subsequently shipped to Active Motif on dry ice. The sequencing data underwent quality control by FastQC and Multiqc. The sequencing data underwent quality control by FastQC and Multiqc. More than 94% of the reads were mapped to the genome (mm10) by bwa-mem with default settings. The unique mapped rates were more than 80%. Default HOMER settings were used on filtered peaks in the analysis, with a default p-value threshold <0.05 for motif enrichment.
Mass Spectrometry Imaging
Thymi from 8 weeks mice in C57BL/6J background were used for tissue sections. Thymi were snap-frozen in an aluminum foil boat float on liquid nitrogen. The frozen tissues were then transferred to a cryostat chamber (CM3050S, LEICA) to equilibrate the tissue temperature to cryostat (−20°C). The thymi were attached to cryostat chunk using distilled water. Thymi were cut into 10 μm thick sections and thaw-mounted the sections onto indium tin oxide coated glass slides. Slides were dehydrated for 30 min in a vacuum chamber and then coated with 1,6-diphenyl-1,3,5-hexatriene (D208000, Sigma) matrix42 using a sublimation apparatus (TM-Sprayer, HTX technology).
Matrix solution was prepared by dissolving saturated 1,6-diphenyl-1,3,5-hexatriene in 90% acetonitrile and 0.1% trifluoroacetic. Mass spectrometry data were obtained using a rapifleX™ MALDI Tissuetyper™ by Bruker Daltonics equipped with a smartbeam Nd: YAG 355 nm laser. The laser spot size is 5 μm and the spatial resolution was set at 50 μm. The number of laser shots was 200 per pixel, scanning from left to right. Data was acquired using Flexcontrol (Version 4.2) and Fleximaging (Version 6). The settings of spectrometer are as follows: Ion Source 1 (20 kv), PIE (2.62 kv), Lens (11 kv), Reflector 1 (20.83 kv), Reflector 2 (1.085 kv), Reflector 3 (8.65 kv). Laser power is set at 35%. The mass spectra data were acquired over a mass range of m/z 100−1000. SCILS Lab (Version 20221 Premium 3D) was used to possess and visualize the mass spectrometry data. MALDI mass spectra were normalized with the total ion current (TIC). To evaluate the enzymatic activities of SCD1, the signal intensity ratio of oleic acid to stearic acid was displayed.
Diet
The normal diet was purchased from SLACOM (P1103F-35 (LC2M01-F35)). The OA-enriched diet was purchased from Dyets Inc (D200120). The main ingredients and contents of the OA-enriched diet are as follows: Caisein, 258.5 g/kg; L-Cystine, 3.9 g/kg; Sucrose, 88.9 g/kg; Dyetrose, 161.5 g/kg; Olive Oil, 348.9 g/kg; Cellulose, 64.6 g/kg; Mineral Mix #210088, 12.9 g/kg; Calcium Carbonate, 7.1 g/kg; Dicalcium Phosphate, 16.8 g/kg; Potassium Citrate H2O, 21.3 g/kg; Vitamin Mix #300050, 12.9 g/kg; Choline Bitartrate, 2.6 g/kg.
QUANTIFICATION AND STATISTICAL ANALYSIS
The statistical significance was analyzed using unpaired two-tailed student’s t-test or paired two-tailed student’s t-test with Prism software (GraphPad). No sample size calculation was performed to predetermine sample size. The sample size was estimated based on our previous experience with the model, ranging from 4–10 mice per group depending on the availability of animals. Such sample size is sufficient to determine statistical differences with good reproducibility. The exact values of n, statistical significance, and the number of repeats were reported in the Figures and the Figure Legends. Data distribution was assumed to be normal but this was not formally tested. Error bars represent standard error of the mean (SEM). The significant difference in means is indicated thusly: *p < 0.05, **p < 0.01, and ***p < 0.001, ns, no significance.
Extended Data
Extended Data Fig. 1: Properties of Treg cells of Scd1−/− mice.

(a) EAE was induced in Scd1−/− and Scd1+/− mice as described in Figure 1a. The levels of Th17 and Treg cells in the central nervous system (CNS) were analyzed on day 17 post EAE induction (n=7 mice for Scd1+/−+Iso, Scd1 −/−+Iso, n=5 mice for Scd1+/−+a-CD25, n=6 for Scd1−/−+a-CD25). (b) The absolute number of CD4+Foxp3+ Treg cells and CD4+Foxp3− conventional T cells in various organs of Scd1−/− and Scd1+/− mice (n= 4 mice per group). (c) CD4+CD25+ T cells were isolated from the spleen of Scd1−/− mice and Scd1+/− littermate control mice, and co-cultured with activated CFSE-labeled CD4+ T cells (1 × 10⁶) from wild type (WT) mice at indicated ratio. The proliferation of CD4+ T cells were determined by the dilution of CFSE. (d) The expression levels of CD25, CTLA-4, and GITA in CD4+Foxp3+ Treg cells were determined by flow cytometry. (e) Gating strategies (with the spleen as a representative) for analyzing Helios expression in Treg cells. (f-g) The percentage and absolute number of Helios+ and Helios− Treg cells in the various tissues of Scd1−/− mice and Scd1+/− mice under steady status (n=4 mice per group). Data are presented as Mean ± SEM. ns, no significance; by unpaired two-tailed Student’s t-test.
Extended Data Fig. 2: Newly generated CD4+ T cells in Scd1−/− mice are prone to differentiate to Treg cells in WT recipient mice.

(a) Thymocytes were depleted of double positive and CD8 single positive cells by magnetic beads and then subjected to sort CD4+CD8−CD73−CD25− thymocytes by flow cytometry. The purity of sorted thymocytes was depicted. (b) The gating strategies (with the spleen as a representative) for analyzing Treg cells in CD45.1+CD45.2+ WT mice receiving the co-transfer of CD4+CD8−CD73−CD25− thymocytes from CD45.1+WT and CD45.2+ Scd1−/− mice. (c) The percentage of Foxp3+ cells in CD4+ cells of CD45.1+WT and CD45.2+Scd1−/− origin were determined 6 weeks post thymocyte co-transfer (n=6 mice per group). (d) The absolute number of WT CD45.1+CD4+Foxp3+ and Scd1−/− CD45.2+CD4+Foxp3+ cells in various organs of WT recipient mice were numerated (n=6 mice per group). (e) The absolute number of CD4+ T cells derived from CD45.1+ and CD45.2+ donor cells were assessed (n=6 mice per group). Data are presented as Mean ± SEM. ns, no significance; by paired two-tailed Student’s t-test.
Extended Data Fig. 3: Functionality of CD4+ T Cells isolated from Scd1+/− and Scd1−/− mice.

(a) The percentage of CD44−CD62L+, CD44+CD62L−, and CD44+CD62L+ CD4+ T cells in the spleen of Scd1+/− (n=7) and Scd1−/− mice (n=5) at steady status. (b) CFSE-labeled splenic CD4+CD25− conventional T cells from Scd1+/− and Scd1−/− mice were subjected to anti-CD3/CD28 stimulation in vitro for 3 days and cell proliferation was detected by assessing CFSE dilution. (c-f) Splenic CD4+CD62L+T cells from Scd1−/− and Scd1+/− mice were cultured in Th1, Th2, or Th17 induction medium for 3 days (n=3 for Th1 and Th17 differentiation, n=4 for Th2 differentiation). The percentages of IFN +, IL-4+, or IL-17+ CD4+T cells were determined by flow cytometry. Data are presented as Mean ± SEM. ns, no significance; by unpaired two-tailed Student’s t-test.
Extended Data Fig.4: Treg cells are comparable in CD4creScd1loxp and Scd1loxp mice.

(a) mRNA levels of Scd1 in CD4+ T cells and hepatocytes isolated from CD4creScd1loxp mice and Scd1loxp littermate control mice (n=5 mice for each group). (b) The percentages of stearic acid (18:0) and oleic acid (18:1n9) among total fatty acids in in vitro expanded CD4+ T cells isolated from CD4creScd1loxp mice and Scd1loxp mice (n=3 for each group). (c) The CD4+ T cell reconstitution efficiency in Rag2−/− mice receiving co-transfer of CD45.1+WT CD4+ T cells and CD45.2+CD4creScd1loxp CD4+ T cells (n=4 mice per group). (d) The percentage of Treg cells among CD4+ T cells in the spleen, auxiliary lymph node and central nervous system of CD4creScd1loxp mice and Scd1loxp mice on day 0 (steady, n=3 mice per group), day 18 (peak, n=5 for Scd1loxp mice, n=3 for CD4creScd1loxp mice), and day 24 (recovery, n=5 for Scd1loxp mice, n=3 for CD4creScd1loxp mice) post EAE induction. Data are presented as Mean ± SEM. ns, no significance; by unpaired two-tailed Student’s t-test.
Extended Data Fig. 5: The T cell reconstitution efficiency of WT and Scd1−/− bone marrow cells were comparable.

(a) Representative gating strategies in analyzing the thymocyte populations of the recipient mice as treated in Fig. 2a. The reconstitution efficiency of CD45.1+ and CD45.1+CD45.2+ cells within thymocytes at DN, DP, and SP stages were depicted. (b) The reconstitution efficiency of CD45.1+WT and CD45.1+CD45.2+Scd1−/− bone marrow cells transplantation (BMT) in different tissues of recipient mice as treated in Fig. 2a. (c) The percentages of donor CD4+ cells among CD45+ cells in the blood and different organs of recipient mice in Fig. 2a. (d) The thymic CD4−CD8− double negative (DN) subpopulation levels in Scd1+/− mice and Scd1−/− mice (n=5 mice for each group). (e) The thymic DN, CD8SP, CD4SP, and DP levels in Scd1+/− mice and Scd1−/− mice (n=6 mice for each group). Data are presented as Mean ± SEM. ns, no significance; by unpaired two-tailed Student’s t-test.
Extended Data Fig. 6: DN3 and DN4 cells of Scd1 deficient origin generated CD4+ T cells with intrinsic Treg propensities upon injection into the thymus of WT mice.
(a) Gating strategies (with the spleen as a representative) used to analyze the Treg cell proportion among donor-derived CD4+ T cells. (b-c) Thymocyte population from CD45.2+Scd1−/− mice and CD45.1+WT mice at the DN1, DN2, DN3, or DN4 stage were mixed at a 1:1 ratio and co-transferred into irradiated (3 Gy) CD45.1+CD45.2+ WT recipient mice via intrathymic injection (n=5 mice for DN1, DN2 transfer; n=6 mice for DN3, DN4 transfer). Four weeks post transfer, the recipient mice received WT and Scd1−/− DN thymocytes were euthanized to numerate the absolute number of CD4+ T cells (b) and CD4+Foxp3+ Treg cells (c) in various organs. Data are presented as Mean ± SEM. ns, no significance; by paired (b, c) two-tailed Student’s t-test.
Extended Data Fig. 7: The influence of SCD1 inhibitor on in vitro T cell development.

(a) The progression of in vitro T cell development in the OP9-DL1 and HSC co-culture system. The effect of SCD1 inhibitor at a concentration of 40 nM was tested. The expression of CD44 and CD25 was used to monitor T cell developmental stages. (b) The proliferation of OP9-DL1 cells treated with SCD1 inhibitor at indicated doses was measured by CCK8 (n=5 for each group). (c) Apoptosis in OP9-DL1 cells treated with SCD1 inhibitor at indicated doses was determined by Propidium Iodide/Annexin V staining (n=4 for each group). (d) Schematic representation of different treatment protocols employed in the in vitro T cell developmental system. HSCs with indicated background cultured on OP9-DL1 cells with different treatments were matured into DN3 stages and then co-transferred to Rag2−/− mice. (e) Representative gating strategies (with the spleen as a representative) for analyzing T cells isolated from Rag2−/− mice receiving DN3 co-transferred as described in Extended Data Fig. 7d. (f) DN3 derived Treg cells in different tissues of Rag2−/− recipient mice were analyzed by flow cytometry (n=7 mice). (g) The levels of CD4+Foxp3+ Treg cells in the blood, liver, and lungs of mice in Fig. 3e. (h-i) The percentage and absolute number of Helios− RORgt+ and Helios+ RORgt− cells in the colon of mice with treatment as described in Fig. 3e (n=5 mice for WT-ND, WT-OA; n=4 for KO-DN, KO-OA). Data are presented as Mean ± SEM. ns, no significance; by unpaired two-tailed Student’s t-test (b, c, g, h, i) or paired two-tailed Student’s t-test (f).
Extended Data Fig. 8: The impact of Scd1 deficiency on the health status and thymic epithelial cells.

(a) Weight of body, spleen, and MLN of K14creScd1loxp and Scd1loxp mice (n=5 mice for each group). (b-c) The whole image and H&E staining of various organs of K14creScd1loxp and Scd1loxp mice. (d) Gating strategies used for identifying cortical thymic epithelial cells (cTEC) and medullar thymic epithelial cells (mTEC) of Scd1+/− and Scd1−/− mice, with subsequent calculation of their absolute numbers (n=3 mice for each group). (e-f) cTEC and mTEC of Scd1+/− and Scd1−/− mice were isolated and subjected to mRNA sequencing analysis. The expression levels of critical regulators governing thymocyte migration, development, and selection in thymic epithelial cells were shown (e). The differentially expressed genes in cTEC or mTEC of Scd1+/− and Scd1−/− mice were shown in a volcano plot (f). (g) The percentage and absolute number of Helios−RORgt+Foxp3+ and Helios+ RORgt−Foxp3+ cells in the colon of K14creScdloxp (n=5) and Scd1loxp (n=7) mice. (h-i) Average MALDI-TOF mass spectra of oleic acid in Figure 4a. Data are presented as Mean ± SEM. ns, no significance; by unpaired two-tailed Student’s t-test.
Extended Data Fig. 9: Evaluation on OT-II T cells developed in K14creScd1loxp mice.

(a) Schematic representation of the experimental design to assess the differentiation potential of OT-II cells developed in K14creScd1loxp or Scd1loxp mice. (b) Gating strategies (with the spleen as a representative) for identifying transferred OT-II T cells in the recipient mice (c) OT-II T cells developed in K14creScd1loxp or Scd1loxp mice were labeled with CFSE and co-cultured with splenocytes from CD45.1+WT mice in the presence of OVA323–339 peptide. The CFSE dilution in OT-II T cells was measured 96 hours post-stimulation. (d-g) CD45.2+CD4+CD62L+TCRVb5.1+ cells were isolated from the spleen of Scd1loxp or K14creScd1loxp mice and intravenously transferred to CD45.1+ WT recipient mice at a dose of 1 × 10⁷ cells per mouse. To test Treg generation, recipient mice were supplied with 2 mg/mL OVA in drinking water for 7 consecutive days and examined for the percentage and number of Foxp3+ OT-II T cells in the spleen, MLN and colon (n=5 mice for each group) (d). To test Th1 and Th17 cell induction, recipient mice were s.c. injected with OVA emulsified in CFA and examined for the percentage and number of IL-17- and IFNg-secreting OT-II T cells in the draining lymph nodes (DLN) and lungs (n=7 mice for each group) (e-f). To test Th2 cell induction, recipient mice were i.p. injected with OVA absorbed to alum adjuvant and examined for the percentage and number of IL-4-secreting OT-II T cells in the spleen and liver (n=4 mice for each group) (g). The percentage and absolute number of distinct OT-II cell subsets were determined. (h-k) OVA323–339 peptide was supplied to the co-culture of CD45.2+CD4+CD62L+TCRVb5.1+ cells and CD45.1+WT splenocytes to activate OT-II T cells in Th1 (n=4 biologically independent samples), Th2 (n=4 biologically independent samples), Th17 (n=3 biologically independent samples), or Treg (n=3 biologically independent samples) cell induction medium. Ninety-six hours later, the expression of IFNg, IL-4, IL-17, or Foxp3 was determined by flow cytometry. Data are presented as Mean ± SEM. ns, no significance; by unpaired two-tailed Student’s t-test.
Extended Data Fig. 10: Scd1 deficiency promotes ATP2A2 expression through modulating DOT1L activities.

(a) Heatmap display of ATAC-seq data from naïve CD4+ T and DN3 cells. (b) Venn diagram of overlapped differential ATAC peaks related genes. (c) Atp2a2 mRNA levels in naïve CD4+ T cells (n=4 per group). (d) SCD1 inhibitor A939572 (SCD1i, 40 nM) was supplied to the in vitro T cell developmental system. DN3 thymocytes were harvested for ATP2A2 analysis (repeated twice). (e-f) WT naïve T cells were cultured in the Treg induction medium with or without SCD1i. The ATP2A2 protein (e) and the Treg (f) levels were determined (repeated twice). (g) The statistical analysis of western blot as described in Figure 6c from 3 independent experiments. (h) Scramble siRNA (NC) or Atp2a2 siRNA was transfected to CD4+CD62L+ T cells. The knockdown efficiency was determined 24 hours post transfection (repeated twice). (i) SOCE in Scd1−/−CD4+CD62L+ T cells transfected with Atp2a2 siRNA or NC was detected. (j-k) WT CD4+CD62L+ T cells were transfected with adenovirus particles to overexpress ATP2A2 (n=3 for each group) (j). T cells were subsequently cultured in the Treg induction medium for another 3 days to evaluate Treg levels (k). (l) The heatmap showing the H3K79me2 levels at the genome of DN3 developed with or without SCD1i. (m) The H3K79me2 levels at the genetic locus of Atp2a2. (n-o) The statistical analysis of Figure 7f (n) and 7h (o) obtained from 4 independent experiments. (p) SCD1i and DOT1L inhibitor EPZ005676 were added to the in vitro T cell development system. The resultant DN3 thymocytes were examined for ATP2A2 expression (repeated twice). (q) The levels of oleic acid and stearic acid in the nucleus of thymocytes from Scd1−/− or Scd1+/− mice (n=6 for each group). (r) Palmitoleic acid (n=4) or Palmitic acid (n=3) was diluted to the indicated concentrations with 10% DMSO and supplied to an enzymatic reaction catalyzed by DOT1L. Data are presented as Mean ± SEM. ns, no significance; by unpaired two-tailed Student’s t-test (c, f, k, q) or paired two-tailed Student’s t-test (n, o).
Supplementary Material
Acknowledgments
We thank Professor Xinhua Liao for providing K14cre mice. Lin Qiu, Jiayu Wu, Xiang Miao, Qianqian Chu, Zi Li, Ying Ma, Kai Wang, Zhonghui Weng, Zhigang Li, and Feng Zhao from Institutional Center for Shared Technologies and Facilities of SINH, CAS for technical assistance. YW discloses support for the research of this work from the National Key R&D Program of China 2022YFA0807300, National Natural Science Foundation of China 32070872, 31771641 and the March of Dimes Birth Defects Foundation of China. YFS discloses support for the research of this work from Funder 2018YFA0107500, National Natural Science Foundation of China 81930085, 81530043, 31961133024, 81571612, and Scientific Innovation Project of the Chinese Academy of Sciences XDA16020403. LYL discloses support for the research of this work from Funder National Natural Science Foundation of China 32000626, Fellowship of China Postdoctoral Science Foundation 2020M671261. LYL acknowledges the support of SANOFI Scholarship Program.
Footnotes
Ethics declarations
Competing interests
The authors declare no competing interests.
Data Availability
Source data for figures and extended data figures are provided in the supplementary file. The sequencing data generated and analyzed in this publication have been deposited in NCBI’s Gene Expression Omnibus. The M. musculus reference genome (GRCm38/mm10 assembly) https://www.ncbi.nlm.nih.gov/assembly/GCF_000001635.20/ was used for Chip-seq and RNA-seq alignment. The Genome-wide maps of chromatin accessibility in DN3 thymocytes and splenic naïve CD4 T+ cells are deposited under the accession number GSE209563. The mRNA sequencing data for cTEC and mTEC is accessible under the accession number GSE237819, while the H3K79me2 Chip-seq analysis data on in vitro developed DN3 cells is available under the accession number GSE237573.
References
- 1.Cooper MD & Alder MN The evolution of adaptive immune systems. Cell 124, 815–822 (2006). [DOI] [PubMed] [Google Scholar]
- 2.Irla M Instructive Cues of Thymic T Cell Selection. Annu Rev Immunol 40, 95–119 (2022). [DOI] [PubMed] [Google Scholar]
- 3.Kadouri N, Nevo S, Goldfarb Y & Abramson J Thymic epithelial cell heterogeneity: TEC by TEC. Nat Rev Immunol 20, 239–253 (2020). [DOI] [PubMed] [Google Scholar]
- 4.Klein L, Kyewski B, Allen PM & Hogquist KA Positive and negative selection of the T cell repertoire: what thymocytes see (and dont’ see). Nat Rev Immunol 14, 377–391 (2014). [DOI] [PMC free article] [PubMed] [Google Scholar]
- 5.Taniuchi I CD4 Helper and CD8 Cytotoxic T Cell Differentiation. Annu Rev Immunol 36, 579–601 (2018). [DOI] [PubMed] [Google Scholar]
- 6.Davenport MP, Smith NL & Rudd BD Building a T cell compartment: how immune cell development shapes function. Nat Rev Immunol 20, 499–506 (2020). [DOI] [PMC free article] [PubMed] [Google Scholar]
- 7.Chapman NM & Chi H Metabolic adaptation of lymphocytes in immunity and disease. Immunity 55, 14–30 (2022). [DOI] [PMC free article] [PubMed] [Google Scholar]
- 8.Campbell C & Rudensky A Roles of Regulatory T Cells in Tissue Pathophysiology and Metabolism. Cell Metab 31, 18–25 (2020). [DOI] [PMC free article] [PubMed] [Google Scholar]
- 9.Bennett CL et al. The immune dysregulation, polyendocrinopathy, enteropathy, X-linked syndrome (IPEX) is caused by mutations of FOXP3. Nat Genet 27, 20–21 (2001). [DOI] [PubMed] [Google Scholar]
- 10.Pohar J, Simon Q & Fillatreau S Antigen-Specificity in the Thymic Development and Peripheral Activity of CD4(+)FOXP3(+) T Regulatory Cells. Front Immunol 9, 1701 (2018). [DOI] [PMC free article] [PubMed] [Google Scholar]
- 11.Savage PA, Klawon DEJ & Miller CH Regulatory T Cell Development. Annu Rev Immunol 38, 421–453 (2020). [DOI] [PubMed] [Google Scholar]
- 12.van der Veeken J et al. Genetic tracing reveals transcription factor Foxp3-dependent and Foxp3-independent functionality of peripherally induced Treg cells. Immunity 55, 1173–1184 e1177 (2022). [DOI] [PMC free article] [PubMed] [Google Scholar]
- 13.Kitagawa Y et al. Guidance of regulatory T cell development by Satb1-dependent super-enhancer establishment. Nat Immunol 18, 173–183 (2017). [DOI] [PMC free article] [PubMed] [Google Scholar]
- 14.Arpaia N et al. Metabolites produced by commensal bacteria promote peripheral regulatory T-cell generation. Nature 504, 451–455 (2013). [DOI] [PMC free article] [PubMed] [Google Scholar]
- 15.Gutcher I et al. Autocrine transforming growth factor-beta1 promotes in vivo Th17 cell differentiation. Immunity 34, 396–408 (2011). [DOI] [PMC free article] [PubMed] [Google Scholar]
- 16.Smith PM et al. The microbial metabolites, short-chain fatty acids, regulate colonic Treg cell homeostasis. Science 341, 569–573 (2013). [DOI] [PMC free article] [PubMed] [Google Scholar]
- 17.Newton R, Priyadharshini B & Turka LA Immunometabolism of regulatory T cells. Nat Immunol 17, 618–625 (2016). [DOI] [PMC free article] [PubMed] [Google Scholar]
- 18.Berod L et al. De novo fatty acid synthesis controls the fate between regulatory T and T helper 17 cells. Nat Med 20, 1327–1333 (2014). [DOI] [PubMed] [Google Scholar]
- 19.Field CS et al. Mitochondrial Integrity Regulated by Lipid Metabolism Is a Cell-Intrinsic Checkpoint for Treg Suppressive Function. Cell Metab 31, 422–437 e425 (2020). [DOI] [PMC free article] [PubMed] [Google Scholar]
- 20.AM AL, Syed DN & Ntambi JM Insights into Stearoyl-CoA Desaturase-1 Regulation of Systemic Metabolism. Trends Endocrinol Metab 28, 831–842 (2017). [DOI] [PMC free article] [PubMed] [Google Scholar]
- 21.Liu K et al. Scd1 controls de novo beige fat biogenesis through succinate-dependent regulation of mitochondrial complex II. Proc Natl Acad Sci U S A 117, 2462–2472 (2020). [DOI] [PMC free article] [PubMed] [Google Scholar]
- 22.Lochner M, Berod L & Sparwasser T Fatty acid metabolism in the regulation of T cell function. Trends Immunol 36, 81–91 (2015). [DOI] [PubMed] [Google Scholar]
- 23.Mottet C, Uhlig HH & Powrie F Cutting edge: cure of colitis by CD4+CD25+ regulatory T cells. J Immunol 170, 3939–3943 (2003). [DOI] [PubMed] [Google Scholar]
- 24.Owen DL et al. Thymic regulatory T cells arise via two distinct developmental programs. Nat Immunol 20, 195–205 (2019). [DOI] [PMC free article] [PubMed] [Google Scholar]
- 25.Bettelli E et al. Reciprocal developmental pathways for the generation of pathogenic effector TH17 and regulatory T cells. Nature 441, 235–238 (2006). [DOI] [PubMed] [Google Scholar]
- 26.Schmitt TM & Zuniga-Pflucker JC Induction of T cell development from hematopoietic progenitor cells by delta-like-1 in vitro. Immunity 17, 749–756 (2002). [DOI] [PubMed] [Google Scholar]
- 27.den Braber I et al. Maintenance of peripheral naive T cells is sustained by thymus output in mice but not humans. Immunity 36, 288–297 (2012). [DOI] [PubMed] [Google Scholar]
- 28.Sukseree S et al. Autophagy in the thymic epithelium is dispensable for the development of self-tolerance in a novel mouse model. PLoS One 7, e38933 (2012). [DOI] [PMC free article] [PubMed] [Google Scholar]
- 29.Sampath H et al. Skin-specific deletion of stearoyl-CoA desaturase-1 alters skin lipid composition and protects mice from high fat diet-induced obesity. J Biol Chem 284, 19961–19973 (2009). [DOI] [PMC free article] [PubMed] [Google Scholar]
- 30.Xue Y et al. SCD1 Sustains Homeostasis of Bulge Niche via Maintaining Hemidesmosomes in Basal Keratinocytes. Adv Sci (Weinh) 10, e2201949 (2023). [DOI] [PMC free article] [PubMed] [Google Scholar]
- 31.Vassar R, Rosenberg M, Ross S, Tyner A & Fuchs E Tissue-specific and differentiation-specific expression of a human K14 keratin gene in transgenic mice. Proc Natl Acad Sci U S A 86, 1563–1567 (1989). [DOI] [PMC free article] [PubMed] [Google Scholar]
- 32.Trebak M & Kinet JP Calcium signalling in T cells. Nat Rev Immunol 19, 154–169 (2019). [DOI] [PMC free article] [PubMed] [Google Scholar]
- 33.Dixon RE et al. Graded Ca(2)(+)/calmodulin-dependent coupling of voltage-gated CaV1.2 channels. Elife 4, e05608 (2015). [DOI] [PMC free article] [PubMed] [Google Scholar]
- 34.Vaeth M et al. Dependence on nuclear factor of activated T-cells (NFAT) levels discriminates conventional T cells from Foxp3+ regulatory T cells. Proc Natl Acad Sci U S A 109, 16258–16263 (2012). [DOI] [PMC free article] [PubMed] [Google Scholar]
- 35.Li MO & Rudensky AY T cell receptor signalling in the control of regulatory T cell differentiation and function. Nat Rev Immunol 16, 220–233 (2016). [DOI] [PMC free article] [PubMed] [Google Scholar]
- 36.Garcia BA et al. Chemical derivatization of histones for facilitated analysis by mass spectrometry. Nat Protoc 2, 933–938 (2007). [DOI] [PMC free article] [PubMed] [Google Scholar]
- 37.Ferrari F et al. DOT1L-mediated murine neuronal differentiation associates with H3K79me2 accumulation and preserves SOX2-enhancer accessibility. Nat Commun 11, 5200 (2020). [DOI] [PMC free article] [PubMed] [Google Scholar]
- 38.Bian Y et al. Cancer SLC43A2 alters T cell methionine metabolism and histone methylation. Nature 585, 277–282 (2020). [DOI] [PMC free article] [PubMed] [Google Scholar]
- 39.Suzuki K, Nagao K, Tokunaga J, Katayama N & Uyeda M Inhibition of DNA methyltransferase by microbial inhibitors and fatty acids. J Enzyme Inhib 10, 271–280 (1996). [DOI] [PubMed] [Google Scholar]
- 40.Hu G et al. Transformation of Accessible Chromatin and 3D Nucleome Underlies Lineage Commitment of Early T Cells. Immunity 48, 227–242 e228 (2018). [DOI] [PMC free article] [PubMed] [Google Scholar]
- 41.Yoshida H et al. The cis-Regulatory Atlas of the Mouse Immune System. Cell 176, 897–912 e820 (2019). [DOI] [PMC free article] [PubMed] [Google Scholar]
- 42.Lai B et al. Principles of nucleosome organization revealed by single-cell micrococcal nuclease sequencing. Nature 562, 281–285 (2018). [DOI] [PMC free article] [PubMed] [Google Scholar]
- 43.Baxter AG & Hodgkin PD Activation rules: the two-signal theories of immune activation. Nat Rev Immunol 2, 439–446 (2002). [DOI] [PubMed] [Google Scholar]
- 44.Curtsinger JM & Mescher MF Inflammatory cytokines as a third signal for T cell activation. Curr Opin Immunol 22, 333–340 (2010). [DOI] [PMC free article] [PubMed] [Google Scholar]
- 45.Dikiy S & Rudensky AY Principles of regulatory T cell function. Immunity 56, 240–255 (2023). [DOI] [PubMed] [Google Scholar]
- 46.Prentice AM The thymus: a barometer of malnutrition. Br J Nutr 81, 345–347 (1999). [PubMed] [Google Scholar]
- 47.Oh-Hora M et al. Dual functions for the endoplasmic reticulum calcium sensors STIM1 and STIM2 in T cell activation and tolerance. Nat Immunol 9, 432–443 (2008). [DOI] [PMC free article] [PubMed] [Google Scholar]
- 48.Kim KD et al. Calcium signaling via Orai1 is essential for induction of the nuclear orphan receptor pathway to drive Th17 differentiation. J Immunol 192, 110–122 (2014). [DOI] [PMC free article] [PubMed] [Google Scholar]
- 49.Guichard V et al. Calcium-mediated shaping of naive CD4 T-cell phenotype and function. Elife 6, e27215 (2017). [DOI] [PMC free article] [PubMed] [Google Scholar]
- 50.Velardi E, Tsai JJ & van den Brink MRM T cell regeneration after immunological injury. Nat Rev Immunol 21, 277–291 (2021). [DOI] [PMC free article] [PubMed] [Google Scholar]
Associated Data
This section collects any data citations, data availability statements, or supplementary materials included in this article.
Supplementary Materials
Data Availability Statement
Source data for figures and extended data figures are provided in the supplementary file. The sequencing data generated and analyzed in this publication have been deposited in NCBI’s Gene Expression Omnibus. The M. musculus reference genome (GRCm38/mm10 assembly) https://www.ncbi.nlm.nih.gov/assembly/GCF_000001635.20/ was used for Chip-seq and RNA-seq alignment. The Genome-wide maps of chromatin accessibility in DN3 thymocytes and splenic naïve CD4 T+ cells are deposited under the accession number GSE209563. The mRNA sequencing data for cTEC and mTEC is accessible under the accession number GSE237819, while the H3K79me2 Chip-seq analysis data on in vitro developed DN3 cells is available under the accession number GSE237573.