

Summary
Background
Micronutrient deficiencies compromise immune systems, hinder child growth and development, and affect human potential worldwide. Yet, to our knowledge, the only existing estimate of the global prevalence of micronutrient deficiencies is from over 30 years ago and is based only on the prevalence of anaemia. We aimed to estimate the global and regional prevalence of deficiency in at least one of three micronutrients among preschool-aged children (aged 6–59 months) and non-pregnant women of reproductive age (aged 15–49 years).
Methods
In this pooled analysis, we reanalysed individual-level biomarker data for micronutrient status from nationally representative, population-based surveys. We used Bayesian hierarchical logistic regression to estimate the prevalence of deficiency in at least one of three micronutrients for preschool-aged children (iron, zinc, and vitamin A) and for non-pregnant women of reproductive age (iron, zinc, and folate), globally and in seven regions using 24 nationally representative surveys done between 2003 and 2019.
Findings
We estimated the global prevalence of deficiency in at least one of three micronutrients to be 56% (95% uncertainty interval [UI] 48–64) among preschool-aged children, and 69% (59–78) among non-pregnant women of reproductive age, equivalent to 372 million (95% UI 319–425) preschool-aged children and 1·2 billion (1·0–1·4) non-pregnant women of reproductive age. Regionally, three-quarters of preschool-aged children with micronutrient deficiencies live in south Asia (99 million, 95% UI 80–118), sub-Saharan Africa (98 million, 83–113), or east Asia and the Pacific (85 million, 61–110). Over half (57%) of non-pregnant women of reproductive age with micronutrient deficiencies live in east Asia and the Pacific (384 million, 279–470) or south Asia (307 million, 255–351).
Interpretation
We estimate that over half of preschool-aged children and two-thirds of non-pregnant women of reproductive age worldwide have micronutrient deficiencies. However, estimates are uncertain due to the scarcity of population-based micronutrient deficiency data.
Funding
US Agency for International Development.
Introduction
Micronutrient deficiencies cause morbidity and mortality in individuals, affecting human potential worldwide.1,2 Deficiencies in iron, vitamin A, zinc, folate, vitamin B12, vitamin D, and iodine can each have severe consequences, including increased susceptibility to infections, birth defects, blindness, reduced growth, cognitive impairment, decreased school performance and work productivity, and even death.3–8 Adolescent girls and women of reproductive age (aged 15–49 years), pregnant and lactating women, and young children are particularly susceptible to the effects of micronutrient malnutrition due to high requirements. Increasing the micronutrient intake of the general population or of populations with increased requirements through improved diets, fortification of staple foods and condiments, biofortification, and supplementation have been shown to reduce the burden of maternal and child morbidity, impaired neurocognitive development, and mortality.9–12
Nevertheless, the global prevalence and number of people with micronutrient deficiencies is not well quantified. This is partially because most micronutrient deficiencies remain undiagnosed due to unclear specific symptoms—thus often referred to as hidden hunger. Moreover, biomarkers for micronutrient status are rarely included in population-based surveys, which has left an important evidence gap on the burden of micronutrient malnutrition within countries and worldwide.13 For over three decades, the nutrition community has reported that 2 billion people worldwide are affected by micronutrient deficiencies,14 on the basis of the estimated number of people with anaemia.14 However, anaemia is not synonymous with micronutrient deficiencies. Some micronutrient deficiencies cause anaemia whereas others do not, and there are causes of anaemia that are unrelated to micronutrient status.15
Robust and documented global and regional estimates of those experiencing micronutrient deficiencies are essential to inform funding and programmatic priorities, and support advocacy efforts to drive these priorities.16 Estimates of the burden of micronutrient deficiencies face three main constraints.17 First, population-representative biomarker data for micronutrient status remain sparse,13 and non-representative studies have little value for estimating burden. Scarce and often outdated data are available for preschool-aged children (aged 6–59 months) and non-pregnant women of reproductive age, but very few population-representative surveys include data on school-aged children, adolescent boys, pregnant women, men, and older adults. Second, although recommendations on appropriate biomarkers for micronutrient status and standardisation of field and laboratory methods have been published,18 available studies have used several field methods and biomarkers for micronutrient status, different assays for the same biomarker, different approaches to adjust for inflammation, and varying cutoffs to define deficiency, all of which limit the comparability of their results. Third, there are 29 known essential micronutrients;19 however, status data of only a few of these are generally collected in representative surveys.20 We also know that micronutrient deficiencies do not always occur alone,1,21 yet standardised methods to account for this coexistence have not been proposed.
Our primary objective for this study was to estimate the prevalence and number of preschool-aged children and non-pregnant women of reproductive age with one or more micronutrient deficiencies, globally and regionally, by reanalysing and pooling individual-level biomarker data for micronutrient status from nationally representative, population-based surveys that met predetermined inclusion criteria, using a transparent set of definitions for deficiency and defined methods to adjust for inflammation and assay used.
Methods
Overview
Our analysis focused on preschool-aged children and non-pregnant women of reproductive age because more data on micronutrient status were available for these groups, and previous evidence suggests these groups bear high burdens of deficiencies.13 Our analysis followed seven steps. First, we established consensus on a set of sentinel micronutrients and their biomarkers that should be included in the analysis. Second, we identified, reviewed, accessed, and included population-based, individual-level biomarker datasets containing at least two of six sentinel micronutrients. Third, we adjusted the micronutrient status biomarker concentrations for inflammation, where applicable, using the Biomarkers Reflecting Inflammation and Nutritional Determinants of Anemia (BRINDA) approach and applied thresholds to identify individuals with deficiencies in each micronutrient.22 Fourth, we identified three core micronutrients each for preschool-aged children and non-pregnant women of reproductive age from the six sentinel micronutrients. Fifth, we included the data sources that measure at least two of the three core micronutrients for preschool-aged children and non-pregnant women of reproductive age in the global and regional analysis. Sixth, we applied regression models to estimate the prevalence of deficiency for the unmeasured micronutrient when only two of the three core micronutrients were measured. Finally, we applied statistical models to estimate the global and regional prevalence of and number of preschool-aged children and non-pregnant women of reproductive age with deficiencies in one or more core micronutrients.
We grouped data into six geographical regions of low-income and middle-income countries (east Asia and the Pacific, Europe and central Asia, Latin America and the Caribbean, Middle East and north Africa, south Asia, and sub-Saharan Africa); we included high-income countries in a seventh group. We refer to these groupings as regions (appendix pp 4–5). An advisory panel including eight micronutrient experts and one statistics expert recruited and supported by the Micronutrient Forum provided input at each stage of the study, and all but two were included as members of the Global Micronutrient Deficiencies Research Group. These estimates have been documented following the Guidelines for Accurate and Transparent Health Estimates Reporting (appendix pp 6–7).23
Data sources
An initial set of sentinel micronutrients were selected a priori, based on the following criteria: (1) the micronutrient status biomarker was measured in multiple population-representative surveys alongside other micronutrient status biomarkers within the same individuals; (2) deficiency in the micronutrient can cause severe morbidity or death; and (3) prevalence of deficiency in the micronutrient is high in many countries. Six sentinel micronutrients were selected: iron, vitamin A, zinc, vitamin B12, folate, and vitamin D. This list was finalised after review and agreement by the advisory panel.
We included datasets that were representative of three or more first-level administrative divisions within a country, contained anonymised individual-level biomarker data for at least two of six sentinel micronutrients, included data collected in or after 2005, and met minimum data quality criteria (appendix pp 7–10).
Our primary data sources were datasets from the BRINDA collaboration. To identify additional datasets, we used a snowball approach whereby we searched the internet, the peer-reviewed literature, and the Micronutrients Database of the WHO Vitamin and Mineral Nutrition Information System,20 consulted our advisory panel, and contacted individuals and country representatives to request access using our own networks (appendix pp 7–10). This process provided an additional eight nationally representative datasets beyond what was available in the BRINDA database (appendix p 16).
Biomarker data for micronutrient status were adjusted for inflammation following the BRINDA approach (appendix pp 10–12).22 Similar definitions of deficiency were applied to all surveys, with cutoffs widely accepted and published in the available literature (table 1, appendix p 12). Assay-adjusted cutoffs were used for folate because the assay used can bias folate measurement (appendix pp 10–12, 19–24).24
Table 1:
Definition of deficiency and adjustment for inflammation for each included biomarker
| Biomarker | Definition of deficiency | Population | Adjust for inflammation? | |
|---|---|---|---|---|
| Vitamin B12 | Serum B12 | <150 pmol/L | All | No |
| Folate* | Red blood cell folate | <340 nmol/L | All | No |
| Folate* | Serum folate | <10 nmol/L | All | No |
| Vitamin A† | Serum retinol | <0·7 μmol/L | All | Preschool-aged children only |
| Vitamin A† | Retinol-binding protein | <0·7 μmol/L | All | Preschool-aged children only |
| Zinc‡ | Serum zinc | <9·9 μmol/L | Children younger than 10 years (morning, non-fasting) | Yes, provided conditions are met |
| Zinc‡ | Serum zinc | <8·7 μmol/L | Children younger than 10 years (afternoon, non-fasting) | Yes, provided conditions are met |
| Zinc‡ | Serum zinc | <10·7 μmol/L | Girls and women aged 10 years or older (morning, fasting) | No |
| Zinc‡ | Serum zinc | <10·1 μmol/L | Girls and women aged 10 years or older (morning, non-fasting) | No |
| Zinc‡ | Serum zinc | <9·0 μmol/L | Girls and women aged 10 years or older (afternoon, non-fasting) | No |
| Iron | Serum ferritin | <12·0 μg/L | Children younger than 5 years | Yes |
| Iron | Serum ferritin | <15·0 μg/L | Individuals aged 5 years or older | Yes |
| Vitamin D | Serum 25-hydroxyvitamin D | <25·0 nmol/L | All | No |
References for definitions of deficiency and adjustments for inflammation are available in the appendix (p 12).
When both red blood cell folate and serum folate were included in a dataset, red blood cell folate data were used. Folate thresholds were adjusted for survey assay (appendix pp 19–22).
When both serum retinol and retinol-binding protein were included in a dataset, serum retinol was used, provided that it was available for the full biological measurement sample. If serum retinol was only available for a subsample, retinol-binding protein data were used.
For surveys with blood collection throughout the day or if the blood collection protocol was not reported, the average of the morning non-fasting and afternoon non-fasting cutoffs was used (ie, <9·3 μmol/L for children and <9·55 μmol/L for women). Specific thresholds used for each dataset are listed in the appendix (pp 19–22).
We identified few datasets that measured all six sentinel micronutrients in the same individuals (two in preschool-aged children, four in non-pregnant women of reproductive age). Therefore, we reduced the number of micronutrients included in the global and regional analysis. We aimed to identify up to three core micronutrients that could be used to identify the majority of individuals with any micronutrient deficiency. We considered two factors: (1) some micronutrient deficiencies had a higher prevalence or often occurred independently and were therefore needed to capture a large proportion of individuals with any deficiency, and (2) some micronutrients were more frequently measured in the datasets initially included. As a result, we selected iron, zinc, and vitamin A as core micronutrients for preschool-aged children and iron, zinc, and folate as core micronutrients for non-pregnant women of reproductive age (appendix pp 12–15). We excluded data sources that did not include at least two core micronutrient biomarkers within each individual (appendix pp 15–25).
Statistical analysis
All statistical analyses were done separately for preschool-aged children and non-pregnant women of reproductive age. Prevalence of deficiency in one or more measured core micronutrients and its effective sample size were computed for each dataset and population group (appendix pp 15–25).
Data sources that included only two of the three core micronutrients might underestimate the prevalence of deficiency when considering all three core micronutrients. To adjust for this bias, we fitted four regression models to estimate the prevalence of deficiency in each of the unmeasured micronutrients (appendix pp 26–28). An effective sample size was computed that accounted for uncertainty from the surveys’ sample design and from this additional analysis step.
We fit a Bayesian hierarchical logistic regression model to estimate prevalence of deficiency in one or more of the three core micronutrients globally and in each of the seven regions (appendix pp 29–33). This approach has been recommended for global and regional estimates of health indicators with scarce data.25 The model’s hierarchical structure allowed the estimate for each region to be informed by data from the region and by data from other regions, particularly in regions where data were sparse or inconsistent. We included the sociodemographic index26 as a time-varying, country-level covariate in the model to borrow strength from countries of similar development level.
We fit the Bayesian model using a Markov Chain Monte Carlo algorithm. We obtained 4000 posterior samples of the model coefficients, from which we computed 4000 samples of the prevalence of deficiency in one or more core micronutrients for each country listed in the appendix (pp 4–5). The number of people affected by micronutrient deficiencies was computed by multiplying the total demographic group population in 2013 for each country (the median data year) from the UN Population Division’s 2019 Revision of the World Population Prospects by the prevalence of deficiency in one or more core micronutrients, and summing to obtain region totals.27 All reported uncertainty intervals represent the 2·5th–97·5th percentiles of these 4000 samples.
Role of the funding source
The funder of the study had no role in study design, data collection, data analysis, data interpretation, or writing of the report.
Results
We included 24 datasets from nationally representative surveys in 22 countries that were collected from 2003 to 2019 (appendix pp 19–22, 25). Of these datasets, 18 provided data for both preschool-aged children and non-pregnant women of reproductive age, with an additional four providing data for preschool-aged children only, and two for non-pregnant women of reproductive age only. Age ranges of included datasets varied, with exact age ranges given in the appendix (pp 19–22). The 22 datasets from 20 countries for preschool-aged children (appendix pp 19–20) included at least one data source for each region except for the Middle East and north Africa, and only one dataset each was available for the high-income countries, and for Europe and central Asia. The median year of data collection was 2013 (IQR 2011–2015) and the median number of micronutrients available of the six sentinel micronutrients was 4 (IQR 3–5). For non-pregnant women of reproductive age, 20 datasets from 19 countries were included, with at least two datasets for each region except for the Middle East and north Africa, for which there were no available data. The median year of data collection was 2013 (IQR 2010–2015) and the median number of micronutrients available of the six sentinel micronutrients was 5 (IQR 4–5).
For preschool-aged children, iron status was available in all 22 country datasets, vitamin A in 21, and zinc in 16 (table 2). Iron deficiency among preschool-aged children was 20% or more in 13 datasets (>50% in Liberia and Pakistan), 10–19% in eight datasets, and less than 10% in only Cambodia (5%). Zinc deficiency was 20% or more in 12 datasets (>50% in Cambodia, Malawi, Cameroon, and Viet Nam), 10–19% in four datasets, and less than 10% in no countries (table 2). Vitamin A deficiency was 51% in Pakistan and 39% in Afghanistan, 10–19% in Colombia, India, Ecuador, Bangladesh, Ghana, and Ethiopia, and less than 10% in 13 datasets (table 2). Data availability for other micronutrients was sparse; of the 22 datasets of preschool-aged children, nine included vitamin B12, eight included folate, and eight included vitamin D, with highly variable prevalence of deficiency for each of these micronutrients (table 2). Only two datasets (both from lower-middle-income countries) included all six sentinel micronutrients in preschool-aged children and they both indicated very high prevalence of having one or more sentinel micronutrient deficiencies (81% in Cambodia and 80% in India; table 2, figure 1). However, datasets from five additional countries included at least five of the six sentinel micronutrients, which permitted visualisation of coexisting deficiencies and deficiencies in any sentinel micronutrient (figure 1). Cameroon (78%) and Viet Nam (68%) had very high prevalence of deficiency in at least one of five included sentinel micronutrients (figure 1). The prevalence of any sentinel micronutrient deficiency in the UK (37%, driven primarily by iron deficiency) was similar to prevalence in Guatemala (38%) and higher than in Mexico (29%; figure 1). The prevalence of deficiencies in two or more measured sentinel micronutrients was highly variable from about 41% in Cameroon and 40% in India to just 1% in the UK (figure 1).
Table 2:
Prevalence of deficiency by type for each dataset included in the analysis of preschool-aged children aged 6–59 months
| Iron deficiency | Zinc deficiency | Vitamin A deficiency | Any core deficiency* | Sample size (any core deficiency)† | Folate deficiency | Vitamin B12 deficiency | Vitamin D deficiency | Any sentinel deficiency‡ | |
|---|---|---|---|---|---|---|---|---|---|
| Afghanistan, 2013 | 24% (20–29) | 12% (8–16) | 39% (34–44) | 54% (49–59)§ | 651 | ·· | ·· | 29% (24–35) | ·· |
| Azerbaijan, 2013 | 22% (19–26) | 17% (14–20) | 7% (5–9) | 40% (36–44)§ | 1019 | ·· | ·· | ·· | ·· |
| Bangladesh, 2011 | 11% (7–17) | 32% (24–41) | 15% (11–20) | 52% (41–63)§ | 302 | ·· | ·· | ·· | ·· |
| Cambodia, 2014 | 5% (3–7) | 67% (59–75) | 7% (4–9) | 71% (62–78)§ | 534 | 30% (25–35) | 2% (1–4) | 3% (2–5) | 81% (74–86) |
| Cameroon, 2009 | 34% (30–39) | 57% (52–61) | 9% (7–12) | 72% (68–76)§ | 776 | 18% (14–23) | 15% (12–20) | ·· | ·· |
| Colombia, 2010 | 14% (12–15) | 39% (37–41) | 19% (17–21) | 57% (55–59)§ | 4091 | ·· | 0% (0–4)¶ | ·· | ·· |
| Côte d’Ivoire, 2007 | 39% (35–43) | ·· | 3% (2–4) | 63% (54–73) | 746 | ·· | ·· | ·· | ·· |
| Ecuador, 2012 | 11% (9–14) | 28% (25–31) | 16% (13–19) | 43% (40–46)§ | 2017 | 8% (7–10) | ·· | ·· | ·· |
| Ethiopia, 2015 | 17% (14–20) | 21% (17–25) | 11% (9–14) | 40% (36–44)§ | 1116 | ·· | ·· | ·· | ·· |
| Ghana, 2017 | 30% (26–34) | ·· | 13% (11–16) | 57% (51–63) | 1165 | ·· | ·· | ·· | ·· |
| Guatemala, 2013–16 | 11% (9–13) | 25% (18–34) | 0% (0–1) | 31% (22–40)§ | 144 | ·· | 20% (15–27) | 0% (0–5)¶ | ·· |
| India, 2016–18 | 30% (28–33) | 19% (17–21) | 18% (16–20) | 53% (50–55)§ | 6514 | 52% (49–54) | 14% (12–16) | 9% (7–10) | 80% (77–83) |
| Liberia, 2011 | 51% (47–55) | ·· | 5% (4–7) | 72% (63–81) | 1434 | ·· | ·· | ·· | ·· |
| Malawi, 2015–16 | 22% (17–28) | 61% (55–67) | 8% (6–11) | 74% (69–78)§ | 1080 | ·· | ·· | ·· | ·· |
| Mexico, 2006 | 35% (32–39) | 27% (24–32) | ·· | 58% (52–63) | 1253 | ·· | 3% (1–4) | ·· | ·· |
| Mexico, 2012 | 18% (16–21) | ·· | 7% (6–9) | 46% (38–54) | 2595 | 1% (0–1) | 0% (0–1) | ·· | ·· |
| Mexico, 2018–19 | 17% (13–20) | 13% (10–17) | 2% (1–4) | 28% (24–33)§ | 965 | ·· | 1% (1–2) | 8% (6–11) | ·· |
| Nepal, 2016 | 27% (24–30) | 22% (19–25) | 3% (2–4) | 44% (41–48)§ | 1647 | 8% (6–11) | ·· | ·· | ·· |
| Nicaragua, 2003–05 | 45% (38–52) | ·· | 1% (0–1) | 64% (57–71) | 953 | ·· | ·· | ·· | ·· |
| Pakistan, 2011 | 51% (49–53) | 40% (38–42) | 51% (49–54) | 86% (85–87)§ | 6638 | ·· | ·· | 13% (12–15) | ·· |
| UK, 2008–19 | 31% (23–40) | ·· | 3% (1–11) | 48% (33–63) | 140 | 2% (1–5) | 0% (0–2)¶ | 12% (7–20) | ·· |
| Viet Nam, 2010 | 19% (15–23) | 56% (50–61) | 6% (4–9) | 66% (61–71)§ | 360 | 7% (4–13) | ·· | 14% (10–19) | ·· |
Data are % (95% uncertainty interval). Exact age ranges for preschool-aged children vary slightly and are listed in the appendix (pp 19–20). Definitions of deficiencies are specified in table 1. Empty cells indicate missing data or exclusion of the micronutrient in the dataset.
Core micronutrients are iron, zinc, and vitamin A.
Sample size varies by micronutrient; sample size for any included core deficiency is shown in this column.
Sentinel micronutrients are iron, zinc, vitamin A, folate, vitamin B12 and vitamin D; prevalence is only shown for surveys measuring all six sentinel micronutrients.
These values are for surveys measuring all three core micronutrients; the other values are predicted as described in the appendix (pp 26–28).
No individuals identified with deficiency in the sample; uncertainty interval does not take into account complex survey design.
Figure 1: Prevalence of single or two or more micronutrient deficiencies in preschool-aged children aged 6–59 months (A) and non-pregnant women aged 15–49 years (B).
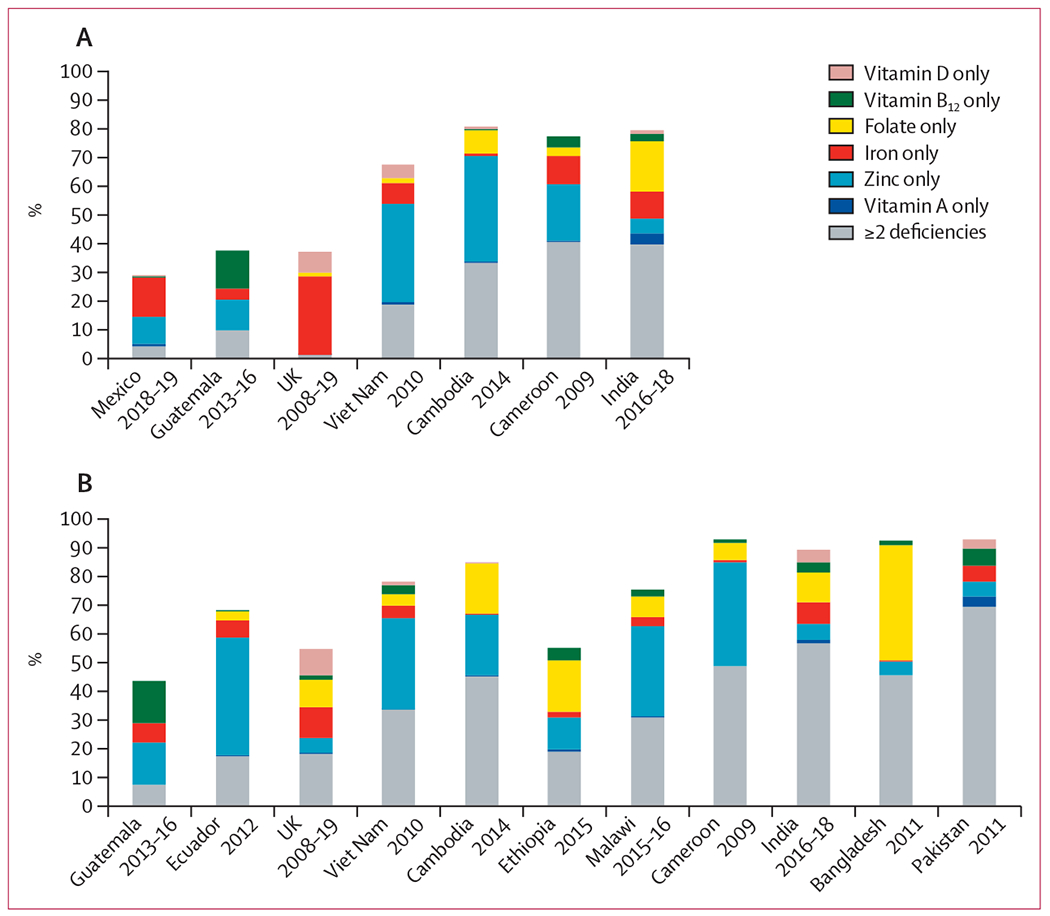
Results shown for datasets containing at least five of six sentinel micronutrients. Exact age ranges varied by dataset and are specified in the appendix (pp 19–22). Sample sizes and deficiency cutoffs used are in table 1 and in the appendix (pp 19–22). For both women and children, the dataset from Guatemala did not include folate and the dataset from Cameroon did not include vitamin D. For women, the survey in Pakistan measured folate but the data were not included here, and the surveys in Ecuador, Ethiopia, Malawi, and Bangladesh did not measure vitamin D. For children, the survey from Mexico did not measure folate, from the UK did not measure zinc, and from Viet Nam did not measure vitamin B12.
Among non-pregnant women of reproductive age, iron status was available in all 20 country datasets, folate and vitamin A in 16, and zinc and vitamin B12 in 15 (table 3). Iron, zinc, and folate deficiency were highly prevalent among non-pregnant women of reproductive age in most countries (table 3). Iron deficiency among non-pregnant women of reproductive age was 20% or more in ten datasets (>40% in Azerbaijan, Mexico in 2012, and Pakistan), including the USA (22%) and the UK (21%), 10–19% in six datasets, and less than 10% in Georgia, Cambodia, Bangladesh, and Ethiopia (table 3). Zinc deficiency was 20% or more in 13 datasets (>50% in Cameroon, Viet Nam, Cambodia, Malawi, and Ecuador), 14% in the USA and 10% in the UK, and less than 10% in no countries (table 3). Folate deficiency was 20% or more in 11 datasets (>50% in Côte d’Ivoire, Bangladesh, Cambodia, Ghana, India, and Georgia), 10–19% in the UK (19%), Nepal (16%), and Ecuador (10%), and less than 10% in only Mexico in 2012 (3%) and the USA (0%) (table 3). Vitamin A deficiency was 42% in Pakistan, 10–19% in India (12%) and Afghanistan (10%), and less than 10% in 13 datasets (table 3). Vitamin B12 deficiency was 52% in Pakistan, 29% in India, 20% in Azerbaijan, 10–19% in six datasets, and less than 10% in six datasets (table 3). Data availability for vitamin D deficiency was low (included in eight of 20 datasets) and highly variable; 78% in Afghanistan, 31% in Pakistan, 24% in India, 22% in the UK, and less than 10% in Guatemala, Cambodia, the USA, and Viet Nam. Only four datasets contained all six sentinel micronutrients and they all indicated prevalence of deficiency in at least one of the six to be more than 50%: 89% in India, 85% in Cambodia, 78% in Viet Nam, and 55% in the UK (table 3, figure 1). An additional seven country datasets included at least five of six sentinel micronutrients (figure 1). Among these, prevalence of deficiency in one or more included sentinel micronutrients was very high in Pakistan, Bangladesh, and Cameroon (all 93%), Malawi (75%), and Ecuador (68%). The prevalence of deficiency in one or more included sentinel micronutrients was higher in the UK (55%) than in Guatemala (44%), and similar to the prevalence in Ethiopia (55%). The prevalence of deficiencies in two or more included sentinel micronutrients was highly variable, from 69% in Pakistan and 57% in India to only 7% in Guatemala.
Table 3:
Prevalence of deficiency by type for each dataset included in the analysis for non-pregnant women aged 15-49 years
| Iron deficiency | Zinc deficiency | Folate deficiency | Any core deficiency* | Sample size (any core deficiency)† | Vitamin A deficiency | Vitamin B12 deficiency | Vitamin D deficiency | Any sentinel deficiency‡ | |
|---|---|---|---|---|---|---|---|---|---|
| Afghanistan, 2013 | 33% (28–39) | 23% (18–29) | ·· | 69% (52–87) | 1044 | 10% (8–13) | ·· | 78% (74–82) | ·· |
| Azerbaijan, 2013 | 43% (40–45) | ·· | 35% (31–39) | 76% (66–85) | 2551 | 0% (0–1) | 20% (16–24) | ·· | ·· |
| Bangladesh, 2011 | 9% (6–13) | 41% (35–48) | 84% (79–87) | 91% (86–94)§ | 699 | 6% (4–9) | 7% (3–13) | ·· | ·· |
| Cambodia, 2014 | 4% (2–6) | 63% (57–69) | 61% (55–67) | 84% (80–88)§ | 689 | 3% (2–4) | 1% (0–3) | 4% (3–7) | 85% (80–88) |
| Cameroon, 2009 | 18% (13–24) | 84% (78–89) | 35% (28–44) | 92% (88–94)§ | 332 | 1% (0–2) | 14% (10–20) | ·· | ·· |
| Côte d’Ivoire, 2007 | 22% (19–26) | ·· | 91% (88–94) | 96% (93–99) | 792 | 1% (0–1) | 18% (12–26) | ·· | ·· |
| Ecuador, 2012 | 17% (16–19) | 57% (55–59) | 10% (9–11) | 68% (66–69)§ | 7230 | 3% (2–4) | 1% (1–2) | ·· | ·· |
| Ethiopia, 2015 | 9% (7–11) | 21% (17–24) | 32% (28–36) | 49% (44–53)§ | 1607 | 5% (3–7) | 14% (11–16) | ·· | ·· |
| Georgia, 2009 | 2% (1–2) | ·· | 52% (44–59) | 72% (60–83) | 407 | ·· | ·· | ·· | ·· |
| Ghana, 2017 | 20% (16–24) | ·· | 59% (53–65) | 81% (74–89) | 466 | 2% (1–3) | 7% (5–10) | ·· | ·· |
| Guatemala, 2013–16 | 16% (15–17) | 25% (18–34) | ·· | 48% (37–59) | 209 | 0% (0–0) | 15% (12–17) | 0% (0–3)¶ | ·· |
| India, 2016–18 | 37% (34–41) | 31% (28–35) | 58% (54–61) | 81% (77–84)§ | 2348 | 12% (9–15) | 29% (26–33) | 24% (21–28) | 89% (86–92) |
| Malawi, 2015–16 | 15% (12–19) | 58% (52–64) | 23% (18–29) | 72% (67–77)§ | 746 | 3% (2–5) | 13% (9–17) | ·· | ·· |
| Mexico, 2006 | 35% (32–39) | 29% (25–34) | ·· | 61% (54–68) | 1813 | ·· | ·· | ·· | ·· |
| Mexico, 2012 | 43% (39–46) | ·· | 3% (2–4) | 67% (55–79) | 3603 | ·· | 2% (1–2) | ·· | ·· |
| Nepal, 2016 | 19% (16–21) | 25% (22–28) | 16% (13–19) | 49% (46–52)§ | 2125 | 1% (1–2) | ·· | ·· | ·· |
| Pakistan, 2011 | 42% (41–44) | 46% (44–48) | ·· | 78% (72–84) | 7390 | 42% (40–44) | 52% (50–55) | 31% (29–33) | ·· |
| UK, 2008–19 | 21% (18–24) | 10% (8–12) | 19% (16–22) | 43% (39–46)§ | 1310 | 1% (0–2) | 7% (5–9) | 22% (19–25) | 55% (51–59) |
| USA, 2015–16 | 22% (17–27) | 14% (10–19) | 0% (0–1) | 32% (26–39)§ | 551 | ·· | ·· | 3% (2–6) | ·· |
| Viet Nam, 2010 | 18% (16–20) | 67% (63–71) | 22% (19–25) | 78% (74–81)§ | 1348 | 1% (1–2) | 12% (9–15) | 9% (7–13) | 78% (73–83) |
Data are % (95% uncertainty interval) or n. The age range for non-pregnant women of reproductive age was 15–19 years for India. Other age ranges varied slightly by dataset and are specified in the appendix (pp 21–22). Definitions of deficiencies are specified in table 1. Empty cells indicate missing data or exclusion of the micronutrient in the dataset.
Core micronutrients are iron, zinc, and folate.
Sample size varies by deficiency; sample size for any included core deficiency is shown in this column.
Sentinel micronutrients are iron, zinc, vitamin A, folate, vitamin B12, and vitamin D; prevalence is only shown for datasets containing all six sentinel micronutrients.
These values are for datasets containing all three core micronutrients; the other values are predicted as described in the appendix (pp 26–28).
No individuals identified with deficiency in the sample; uncertainty interval does not take into account complex survey design.
Regionally, among preschool-aged children the estimated prevalence of deficiency in at least one of three core micronutrients was highest in sub-Saharan Africa (62%, 95% uncertainty interval [UI] 53–72) and lowest in Europe and central Asia (45%, 27–64), high-income countries (45%, 25–68), and Latin America and the Caribbean (48%, 38–58; table 4, figure 2). Among non-pregnant women of reproductive age, the estimated prevalence of deficiency in at least one of three core micronutrients was also highest in sub-Saharan Africa (80%, 70–89) and lowest in high-income countries (48%, 26–73; table 4, figure 2). Uncertainty intervals for both preschool-aged children and non-pregnant women of reproductive age were largest in the Middle East and north Africa due to a scarcity of data sources, followed by high-income countries, Europe and central Asia, and east Asia and the Pacific, due to only one or two included datasets.
Table 4:
Prevalence of and number of people with deficiencies in one or more of three core micronutrients in the world and in different regions (2003–19)
| Prevalence of any deficiency, % (95% UI) | Number of people with any deficiency, millions (95% UI) | |
|---|---|---|
| Children aged 6–59 months | ||
|
| ||
| World | 56% (48–64) | 372 (319–425) |
| East Asia and the Pacific | 58% (42–75) | 85 (61–110) |
| Europe and central Asia | 45% (27–64) | 14 (8–19) |
| High-income countries | 45% (25–68) | 30 (16–45) |
| Latin America and the Caribbean | 48% (38–58) | 24 (19–29) |
| Middle East and north Africa | 53% (26–78) | 22 (11–32) |
| South Asia | 57% (46–68) | 99 (80–118) |
| Sub-Saharan Africa | 62% (53–72) | 98 (83–113) |
|
| ||
| Non-pregnant women aged 15–49 years | ||
|
| ||
| World | 69% (59–78) | 1203 (1031–1358) |
| East Asia and the Pacific | 72% (52–88) | 384 (279–470) |
| Europe and central Asia | 68% (46–86) | 68 (46–86) |
| High-income countries | 48% (26–73) | 126 (68–190) |
| Latin America and the Caribbean | 63% (47–79) | 96 (71–119) |
| Middle East and north Africa | 68% (34–93) | 60 (31–83) |
| South Asia | 74% (61–85) | 307 (255–351) |
| Sub-Saharan Africa | 80% (70–89) | 161 (139–178) |
The median year of data collection was 2013. The population estimates are based on the year 2013. Core micronutrients for children are iron, zinc, and vitamin A, and for women are iron, zinc, and folate. Definitions of deficiency are specified in table 1. UI=uncertainty interval.
Figure 2: Estimated prevalence of three core micronutrient deficiencies (2003–19) in preschool-aged children 6–59 months (A) and women aged 15–49 years (B).
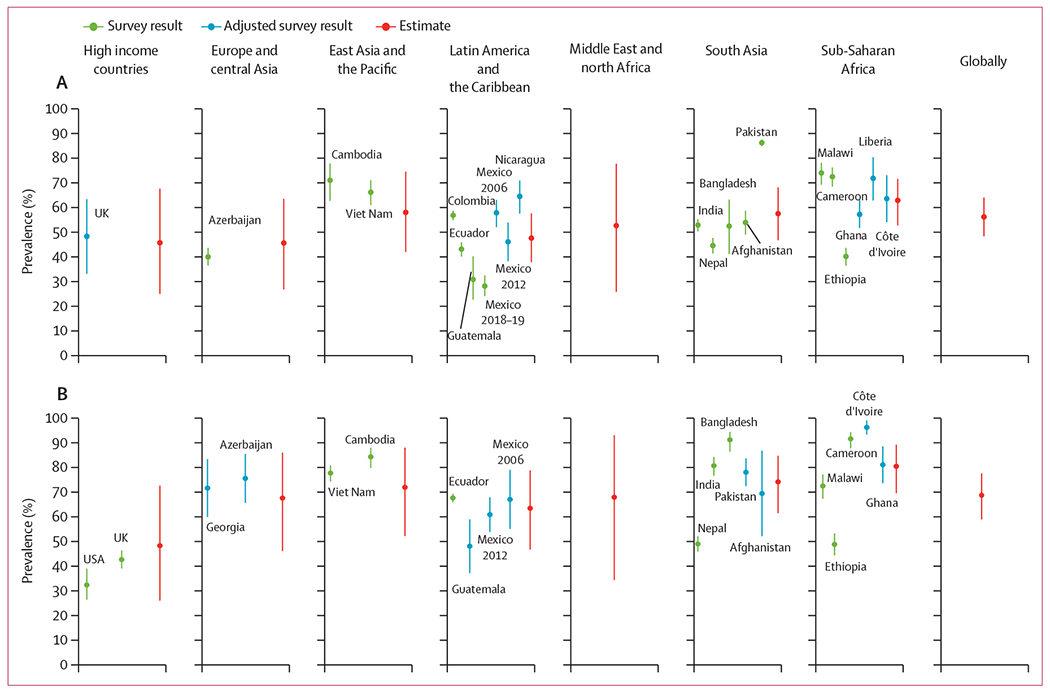
Direct survey results, survey results that were adjusted for one unmeasured micronutrient, and regional and global estimates are shown. Error bars show 95% uncertainty intervals. Exact age ranges varied and are listed in the appendix (pp 19–22). Sample sizes are also listed in the appendix (pp 19–22). Core micronutrients for children are iron, zinc, and vitamin A, and the median year of data collection was 2013. Core micronutrients for women are iron, zinc, and folate, and the median year of data collection was 2013.
Globally, the estimated prevalence of deficiency in at least one of three core micronutrients was 56% (95% UI 48–64) among preschool-aged children, and 69% (59–78) among non-pregnant women of reproductive age (table 4, figure 2). This translates into a global total of 372 million (95% UI 319–425) preschool-aged children and 1·2 billion (1·0–1·4) non-pregnant women of reproductive age with micronutrient deficiencies (table 4). Considering regional populations, three-quarters of preschool-aged children with micronutrient deficiencies live in one of three regions: south Asia (99 million, 95% UI 80–118), sub-Saharan Africa (98 million, 83–113), or east Asia and the Pacific (85 million, 61–110; table 3). Over half (57%) of non-pregnant women of reproductive age with micronutrient deficiencies live in east Asia and the Pacific (384 million, 279–470) or south Asia (307 million, 255–351).
Discussion
Our analysis suggests that during 2003–19, there were 372 million (95% UI 319–425) preschool-aged children and 1·2 billion (1·0–1·4) non-pregnant women of reproductive age with one or more micronutrient deficiencies worldwide. Although prevalence was the highest in, and the largest number of individuals with micronutrient deficiencies were in, low-income and middle-income countries, nearly half of women and children in high-income countries were estimated to have at least one micronutrient deficiency. This finding of a high burden of micronutrient deficiencies in high-income countries diverges from estimates of inadequacy in the food supply, which have found a negligible burden.28 Future studies should synthesise evidence on micronutrient inadequacies in the food supply and in dietary intake studies with estimates such as these on micronutrient status to better understand the global burden of inadequate diets and strategies for intervening in the food system to improve micronutrient supplies, intakes, and status.
Our estimate should not be interpreted as a reduction from the previous 2 billion estimate, which used different methods and included school-aged children, adolescents, men, and older adults. Rather, it can be considered a new starting point for global monitoring of micronutrient deficiencies. We hope this analysis motivates addressing the data gaps and spurs commitment to global monitoring to track progress and to address this public health burden in all regions globally.
Our analytical approach to estimating the global prevalence of micronutrient deficiencies among preschool-aged children and non-pregnant women of reproductive age has important strengths. First, we relied on recent, micronutrient status biomarkers for multiple micronutrients within individuals. Previous efforts to estimate the burden of micronutrient malnutrition have used proxy measures (eg, food availability data or stunting prevalence for zinc deficiency)29 or standardised adjustment factors to estimate the proportion of anaemia due to iron deficiency, usually 50% or 60%, which might not be appropriate.3 Second, we used a transparent and standardised approach to identify micronutrients upon which we based our analysis, taking into account prevalence of micronutrient deficiencies and data availability. Third, we identified, accessed, systematically included and pooled individual-level data from population-representative surveys from countries spanning multiple geographical regions and developmental levels, allowing for the application of standardised and recommended cutoffs and adjustments for inflammation as necessary. Fourth, we imputed the prevalence of unmeasured micronutrient deficiencies and made regional and global estimates, accounting for uncertainty in multiple steps of the analysis. Finally, we provided detailed documentation of the methods and assumptions for transparency and to enable replication.
The primary limitation of our analysis is the scarcity of population-based biomarker data to assess micronutrient status. This limitation was particularly evidenced by the absence of data in our analysis for the Middle East and north Africa. Additionally, scarcity of data prevented us from including other population subgroups in our analysis, which might also have a high prevalence of micronutrient deficiencies, including pregnant women, adolescents, older adults, school-aged children, and adult men.13 Due to scarce data, we were unable to make estimates for each country worldwide or assess change over time. Furthermore, data were available for few countries, and the regression model was fit under the assumption that countries with data were representative of countries within their region, after adjusting for country development level. The model underestimated uncertainty because it only accounted for heterogeneity between countries through the country development level. The scarcity of up-to-date biomarker data for micronutrient status has been well recognised and a recent publication has laid out several recommendations to address this problem.13 Additionally, although thresholds for deficiency and adjustments for inflammation were consistently applied to all data sources, these are based on scarce data and might not have accurately identified individuals whose health is negatively affected by the micronutrient deficiencies. Moreover, some of the included biomarkers, such as serum retinol,30 are not intended for identifying deficiency in individuals. Furthermore, biomarkers and laboratory methods differed by data source, which might have affected their accuracy and comparability. Thresholds used to define folate deficiency were adjusted for the assay used to improve comparability; however, the adjustments were based on scarce data and designed for population-level rather than individual-level analysis. When considered together, it is not clear whether these limitations might have led to an underestimate or overestimate of the prevalence of deficiency in one or more of the core micronutrients; our uncertainty intervals do not reflect these limitations. Finally, we limited our analysis to three core micronutrients in each population group on the basis of their prevalence and frequency of measurement in population-based data sources; by definition, this underestimated the full prevalence of micronutrient deficiencies.
Data on the prevalence and burden of micronutrient deficiencies is scarce or limited to a minimal selection of micronutrients and population groups, and is updated routinely in few countries. Yet, the pattern of micronutrient deficiencies varies across countries and regions, and it is therefore essential to characterise each condition locally, including subnationally within countries. Robust and timely data on the burden of micronutrient deficiencies is important for informing programmes and policies aimed at reducing malnutrition. We encourage reassessment of the global burden of micronutrient deficiencies periodically, building on the approach proposed here, particularly as additional and more comprehensive data become available.
Supplementary Material
Research in context.
Evidence before this study
For the past three decades, micronutrient (vitamin and mineral) deficiencies have been reported to have affected an estimated 2 billion people. This estimate is important for drawing attention to the problem and could be used to track global progress. However, the estimate is from three decades ago and is based on anaemia prevalence only, and not on micronutrient deficiencies.
Added value of this study
This study provides updated global and regional estimates of micronutrient deficiencies using individual-level biomarker data for multiple micronutrients collected between 2003 and 2019. We estimate that there are 372 million (95% uncertainty interval 319–425) preschool-aged children (aged 6–59 months) and 1·2 billion (1·0–1·4) non-pregnant women of reproductive age (aged 15–49 years) with one or more micronutrient deficiencies worldwide. This approach provides a transparent method for estimating the global and regional prevalence and can be replicated as more and better data from nationally representative surveys become available.
Implications of all the available evidence
Few population-based data sources measure micronutrient deficiencies. Whether this crucial evidence gap biased our prevalence estimates is an important question that can be addressed as additional surveys become available. Nevertheless, the results clearly show that micronutrient malnutrition is an important public health problem among preschool-aged children and non-pregnant women of reproductive age. Micronutrient malnutrition affects populations in all regions of the world, including high-income countries. Our estimates of those with micronutrient deficiencies are most likely underestimates of the true global burden of micronutrient malnutrition when considering all essential micronutrients, and all age and sex groups. These deficiencies are compromising immune systems, constraining the growth and development of children, exacerbating chronic diseases, and ultimately affecting the human potential of populations and nations.
Acknowledgments
We gratefully acknowledge feedback on the analysis from advisory panel members, Daniel Roth and Ashkan Afshin; support from Veronica Varela on the search process; feedback on the analysis and manuscript from Omar Dary; inputs and feedback on the methods and data from Juan Carlos Caro and James P Wirth; and assistance compiling data on survey methods from Emily Nieckula. The US Agency for International Development (USAID) provided financial support for this study through its flagship multisectoral nutrition project, the USAID Advancing Nutrition. It was prepared under the terms of contract 7200AA18C00070 awarded to JSI Research & Training Institute. The contents are the responsibility of the Global Alliance for Improved Nutrition and JSI and do not necessarily reflect the views of USAID or the US Government. We acknowledge the contributions of datasets and guidance from the BRINDA working group and steering committee members. The BRINDA project is supported by the Bill & Melinda Gates Foundation, US Centers for Disease Control and Prevention (CDC), Eunice Kennedy Shriver National Institute of Child Health and Human Development, HarvestPlus, and USAID. This analysis was also made possible by publicly available or shared data from: Population Council and UNICEF (India); University of Ghana-Legon; Ethiopian Public Health Institute; the UK data service; the US CDC; Instituto Nacional de Salud y Nutrición (México); and the Secretaría de Seguridad Alimentaria y Nutricional (Guatemala).
Global Micronutrient Deficiencies Research Group
O Yaw Addo, Seth Adu-Afarwuah, Silvia Alayón, Zulfiqar Bhutta, Kenneth H Brown, Maria Elena Jefferds, Reina Engle-Stone, Wafaie Fawzi, Sonja Y Hess, Robert Johnston, Joanne Katz, Julia Krasevec, Christine M McDonald, Zuguo Mei, Saskia Osendarp, Christopher J Paciorek, Nicolai Petry, Christine M Pfeiffer, Maria J Ramirez-Luzuriaga, Lisa M Rogers, Fabian Rohner, Vani Sethi, Parminder S Suchdev, Masresha Tessema, Salvador Villapando, Frank T Wieringa, Anne M Williams, Meseret Woldeyahannes, Melissa F Young
Footnotes
Declaration of interests
We declare no competing interests.
For more on the BRINDA project see https://www.brinda-nutrition.org/
See Online for appendix
For more on the Micronutrient Forum see https://micronutrientforum.org/
Data sharing
Following data use agreements, the authors cannot share individual-level data. Summary statistics derived from the individual-level data are reported in tables 2 and 3. Contact information for data owners, input data for the Bayesian model, and computer code are available at: https://github.com/GAINAlliance/hiddenhunger.
References
- 1.Bailey RL, West KP Jr, Black RE. The epidemiology of global micronutrient deficiencies. Ann Nutr Metab 2015; 66 (suppl 2): 22–33. [DOI] [PubMed] [Google Scholar]
- 2.Black RE, Victora CG, Walker SP, et al. Maternal and child undernutrition and overweight in low-income and middle-income countries. Lancet 2013; 382: 427–51. [DOI] [PubMed] [Google Scholar]
- 3.Petry N, Olofin I, Hurrell RF, et al. The proportion of anemia associated with iron deficiency in low, medium, and high human development index countries: a systematic analysis of national surveys. Nutrients 2016; 8: 693. [DOI] [PMC free article] [PubMed] [Google Scholar]
- 4.Sommer A. Vitamin A deficiency and its consequences: a field guide to detection and control, 3rd edn. Geneva: World Health Organization, 1995. [Google Scholar]
- 5.Black MM. Zinc deficiency and child development. Am J Clin Nutr 1998; 68 (suppl 2): 464S–69S. [DOI] [PMC free article] [PubMed] [Google Scholar]
- 6.Zimmermann MB. Iodine deficiency. Endocr Rev 2009; 30: 376–408. [DOI] [PubMed] [Google Scholar]
- 7.Roth DE, Abrams SA, Aloia J, et al. Global prevalence and disease burden of vitamin D deficiency: a roadmap for action in low- and middle-income countries. Ann N Y Acad Sci 2018; 1430: 44–79. [DOI] [PMC free article] [PubMed] [Google Scholar]
- 8.van Hagen P, de Jonge R, van Berge Henegouwen MI, et al. Vitamin B12 deficiency after esophagectomy with gastric tube reconstruction for esophageal cancer. Dis Esophagus 2017; 30: 1–8. [DOI] [PubMed] [Google Scholar]
- 9.Bhutta ZA, Ahmed T, Black RE, et al. What works? Interventions for maternal and child undernutrition and survival. Lancet 2008; 371: 417–40. [DOI] [PubMed] [Google Scholar]
- 10.Bhutta ZA, Das JK, Rizvi A, et al. Evidence-based interventions for improvement of maternal and child nutrition: what can be done and at what cost? Lancet 2013; 382: 452–77. [DOI] [PubMed] [Google Scholar]
- 11.Keats EC, Das JK, Salam RA, et al. Effective interventions to address maternal and child malnutrition: an update of the evidence. Lancet Child Adolesc Health 2021; 5: 367–84. [DOI] [PubMed] [Google Scholar]
- 12.Dewey K. Guiding principles for complementary feeding of the breastfed child. Washington, DC: Pan American Health Organization, 2003. [Google Scholar]
- 13.Brown KH, Moore SE, Hess SY, et al. Increasing the availability and utilization of reliable data on population micronutrient (MN) status globally: the MN Data Generation Initiative. Am J Clin Nutr 2021; 114: 862–70. [DOI] [PMC free article] [PubMed] [Google Scholar]
- 14.WHO. National strategies for overcoming micronutrient malnutrition. Geneva: World Health Organization, 1991. [Google Scholar]
- 15.Chaparro CM, Suchdev PS. Anemia epidemiology, pathophysiology, and etiology in low- and middle-income countries. Ann N Y Acad Sci 2019; 1450: 15–31. [DOI] [PMC free article] [PubMed] [Google Scholar]
- 16.Haddad L, Achadi E, Bendech MA, et al. The Global Nutrition Report 2014: actions and accountability to accelerate the world’s progress on nutrition. J Nutr 2015; 145: 663–71. [DOI] [PMC free article] [PubMed] [Google Scholar]
- 17.Svedberg P. How many people are malnourished? Annu Rev Nutr 2011; 31: 263–83. [DOI] [PubMed] [Google Scholar]
- 18.Centers for Disease Control and Prevention, WHO, Nutritional International, UNICEF. Micronutrient survey manual. Geneva: World Health Organization, 2020. [Google Scholar]
- 19.Institute of Medicine Committee to Review Dietary Reference Intakes for Vitamin D and Calcium. Dietary reference intakes for calcium and vitamin D. Washington, DC: National Academies Press, 2011. [Google Scholar]
- 20.WHO. Vitamin and Mineral Nutrition Information System (VMNIS). https://www.who.int/teams/nutrition-and-food-safety/databases/vitamin-and-mineral-nutrition-information-system (accessed June 13, 2021).
- 21.Ramakrishnan U. Prevalence of micronutrient malnutrition worldwide. Nutr Rev 2002; 60 (suppl 5): S46–52. [DOI] [PubMed] [Google Scholar]
- 22.Namaste SM, Aaron GJ, Varadhan R, Peerson JM, Suchdev PS. Methodologic approach for the Biomarkers Reflecting Inflammation and Nutritional Determinants of Anemia (BRINDA) project. Am J Clin Nutr 2017; 106 (suppl 1): 333S–47S. [DOI] [PMC free article] [PubMed] [Google Scholar]
- 23.Stevens GA, Alkema L, Black RE, et al. Guidelines for accurate and transparent health estimates reporting: the GATHER statement. PLoS Med 2016; 13: e1002056. [DOI] [PMC free article] [PubMed] [Google Scholar]
- 24.Rogers LM, Cordero AM, Pfeiffer CM, et al. Global folate status in women of reproductive age: a systematic review with emphasis on methodological issues. Ann N Y Acad Sci 2018; 1431: 35–57. [DOI] [PMC free article] [PubMed] [Google Scholar]
- 25.Mathers C, Hogan D, Stevens G. Global health estimates: modelling and predicting health outcomes. In: Macfarlane SB, AbouZahr C, eds. The Palgrave handbook of global health data methods for policy and practice. London: Palgrave Macmillan, 2019: 403–24. [Google Scholar]
- 26.Global Burden of Disease Collaborative Network. Global Burden of Disease 2019 (GBD 2019) covariates 1980–2019. https://ghdx.healthdata.org/record/global-burden-disease-study-2019-gbd-2019-covariates-1980-2019 (accessed Oct 17, 2020).
- 27.UN Department of Economic and Social Affairs. World Population Prospects 2019. https://population.un.org/wpp/(accessed Oct 14, 2019). [Google Scholar]
- 28.Beal T, Massiot E, Arsenault JE, Smith MR, Hijmans RJ. Global trends in dietary micronutrient supplies and estimated prevalence of inadequate intakes. PLoS One 2017; 12: e0175554. [DOI] [PMC free article] [PubMed] [Google Scholar]
- 29.Wessells KR, Singh GM, Brown KH. Estimating the global prevalence of inadequate zinc intake from national food balance sheets: effects of methodological assumptions. PLoS One 2012; 7: e50565. [DOI] [PMC free article] [PubMed] [Google Scholar]
- 30.Tanumihardjo SA, Russell RM, Stephensen CB, et al. Biomarkers of nutrition for development (BOND)–vitamin A review. J Nutr 2016; 146: 1816S–48S. [DOI] [PMC free article] [PubMed] [Google Scholar]
Associated Data
This section collects any data citations, data availability statements, or supplementary materials included in this article.
Supplementary Materials
Data Availability Statement
Following data use agreements, the authors cannot share individual-level data. Summary statistics derived from the individual-level data are reported in tables 2 and 3. Contact information for data owners, input data for the Bayesian model, and computer code are available at: https://github.com/GAINAlliance/hiddenhunger.