

Abstract
Among systemic lupus erythematosus (SLE) patients, neuropsychiatric symptoms are highly prevalent, being observed in up to 80% of adult and 95% of pediatric patients. Type 1 interferons, particularly interferon alpha (IFNα), have been implicated in the pathogenesis of SLE and its associated neuropsychiatric symptoms (NPSLE). However, it remains unclear how type 1 interferon signaling in the central nervous system (CNS) might result in neuropsychiatric sequelae. In this study, we validate an NPSLE mouse model and find an elevated peripheral type 1 interferon signature alongside clinically relevant NPSLE symptoms such as anxiety and fatigue. Unbiased single-nucleus sequencing of the hindbrain and hippocampus revealed that interferon-stimulated genes (ISGs) were among the most highly upregulated genes in both regions and that gene pathways involved in cellular interaction and neuronal development were generally repressed among astrocytes, oligodendrocytes, and neurons. Using image-based spatial transcriptomics, we found that the type 1 interferon signature is enriched as spatially distinct patches within the brain parenchyma of these mice. Our results suggest that type 1 interferon in the CNS may play an important mechanistic role in mediating NPSLE behavioral phenotypes by repressing general cellular communication pathways, and that type 1 interferon signaling modulators are a potential therapeutic option for NPSLE.
Keywords: Interferon alpha (IFNα), Interferon-stimulated gene (ISG), Neuropsychiatric, Glial cells, Spatial transcriptomics, Single-nucleus sequencing
1. Introduction
Systemic lupus erythematosus (SLE) is a clinically heterogeneous and incurable autoimmune disease that affects multiple organs. The prevailing paradigm is that defective apoptotic cell clearance results in cellular debris leading not only to the production of autoantibodies but also triggering the receptors TLR7 and TLR9, thus leading to pathological type 1 interferon secretion by plasmacytoid and follicular dendritic cells (Lisnevskaia et al., 2014; Moulton et al., 2017; Crow, 2014; Das et al., 2017). In fact, chronic expression of a type 1 interferon signature in peripheral blood is found in up to 80% and 100% of adult and pediatric SLE patients, respectively, suggesting a key pathogenic role for type 1 interferons, particularly interferon alpha (IFNα) (Crow, 2014; Hua et al., 2006; Rodero et al., 2017).
While the kidney and skin are typical organ sites for SLE pathology, the central nervous system (CNS) is increasingly appreciated to be widely impacted, with clinical symptoms observed in up to 80% and 95% of adult and pediatric patients, respectively. These symptoms range from mild cognitive dysfunction and anxiety to overt psychosis and are collectively termed neuropsychiatric lupus (NPSLE) (Jeltsch-David and Muller, 2014; Kivity et al., 2015). While the pathophysiology of NPSLE is not well understood, inflammatory cytokines, neurotoxic autoantibodies, and vascular pathologies have all been proposed to contribute to NPSLE etiology (Aw et al., 2021; Jeltsch-David and Muller, 2014; Schwartz et al., 2019). Given its clinical heterogeneity, the cause of NPSLE is unlikely to be singly attributable to any one of these factors. However, we hypothesize that IFNα plays a significant role, given (1) the high prevalence of the type 1 interferon signature in patients, a signature that can be triggered by IFNα signaling through IFNAR and the JAK/STAT pathway (Schreiber and Piehler, 2015), (2) the increased levels of serum IFNα in lupus patients (Rodero et al., 2017), (3) the correlation between NPSLE and an elevated IFNα-associated gene signature in patient serum and cerebrospinal fluid (CSF) (Oke et al., 2019; Shiozawa et al., 1992), and (4) the similarity of neuropsychiatric sequelae experienced by patients treated with recombinant IFNα (Schaefer et al., 2002; Valentine and Meyers, 2005). Given the heterogeneity of clinical symptoms experienced by both NPSLE and other patients receiving therapeutic IFNα, we hypothesized that different brain regions and cell types were affected by IFNα, resulting in spatial enrichments of type 1 interferon signaling within the brain parenchyma that functionally determine behavioral outcomes.
Given the scarcity of NPSLE patient brain and peripheral tissue, animal models are critical for further study of the disease. There are few well-established murine models of NPSLE, and to the best of our knowledge, those that exist do not have existent or well-characterized peripheral type 1 interferon signatures (El Khoury et al., 2020; Zhuang et al., 2015a). The disease-accelerated Sle1,Yaa mouse exhibits key SLE pathological characteristics, such as high antinuclear autoantibody titers and severe glomerulonephritis, and has a 50% survival rate at 30 weeks of age (Subramanian et al., 2006). Derived by crossing the B6.Sle1 strain with the BXSB strain, Sle1,Yaa mice have one copy of a segment of chromosome 1 that contains 3 subloci that promote various aspects of the autoimmune phenotype (originally derived from the lupus-susceptible NZM2410 strain) (Morel et al., 2001) and a translocation of a segment of the X chromosome onto the Y chromosome, resulting in the modified Yaa chromosome (Y-linked autoimmune acceleration), which causes accelerated autoimmunity. Importantly, in Sle1,Yaa mice, the overexpression of Tlr7 is thought to drive most of the accelerated autoimmune phenotypes (Fairhurst et al., 2008). Given the role of TLR7 signaling in generating the type 1 interferon response (Uematsu and Akira, 2007), we hypothesized that the Sle1,Yaa strain would likely exhibit the same elevated peripheral blood interferon signature seen in patients, as well as disease-associated sickness behaviors (neuropsychiatric symptoms). In this study, we validated the presence of a peripheral type 1 interferon signature and show clinically relevant anxiety- and fatigue-like behaviors in Sle1,Yaa mice. Strikingly, we also found that the type 1 interferon signature is elevated in the CNS of these mice and that it is spatially segregated in patches that are enriched within the subcortical areas. Thus, these results lay the foundation for further investigation of CNS IFNAR signaling in NPSLE.
2. Materials and methods
2.1. Animals
Sle1,Yaa (021569) and C57BL/6J (000664) mice were purchased from Jackson Laboratories and bred in-house. Male mice were exclusively used for all experiments due to the Yaa mutation on the Y-chromosome. Sle1−/− and Sle1+/+,Yaa mice were generated in-house as depicted in Supplementary Fig. 4A. Mice were maintained at Harvard Medical School in an American Association for the Accreditation of Laboratory Animal Care–accredited facility. All animal experiments were approved by the Boston Children’s Hospital and Harvard Medical School institutional animal use and care committee in accordance with NIH guidelines for the humane treatment of animals.
2.2. Autoantibody quantification
Serum autoantibodies were quantified using the Luminex xMAP platform (Luminex) with the MILLIPLEX MAP Human Autoimmune Autoantibody Panel (HAIAB-10 K, Millipore Sigma) following the manufacturer’s instructions.
2.3. Behavioral phenotyping
All behavioral analyses except the treadmill fatigue test were performed in the Harvard Medical School Mouse Behavior Core facility. Mice were acclimated for at least 30 min prior to behavioral testing in a holding room, and all testing was carried out between the hours of 0800 – 1200 EST. The tests for Fig. 2 and Supplementary Fig. 2–4 were carried out in the following order over 7 days: Bright open field, Elevated plus maze, Light-dark box, Locomotor, Rotarod, Grip strength/Wire hang, Gait. The treadmill fatigue test was performed in a separate cohort of mice for these figures.
Fig. 2.

Anxiety- and fatigue-like behavioral phenotypes in the Sle1,Yaa mouse model. (A) The bright open field test measures anxiety by the exploratory behavior of the subject in the brightly lit center of an open field enclosure as opposed to its periphery. Sle1,Yaa mice moved and spent less time in the brightly lit center field. (B) The light–dark box test measures anxiety by the exploratory behavior of the subject in the brightly lit half of an enclosure as opposed to the dark, covered half. Sle1, Yaa mice displayed less exploratory behavior in the brightly lit half of the box. (C) The locomotor test measures general exploratory behavior in a low stress environment. Sle1,Yaa mice displayed less locomotive and vertical exploratory behavior compared to B6 controls. (D) The rotarod test measures general motor function abilities. Sle1,Yaa mice showed decreased ability to stay on the accelerating rod compared to B6 controls. (E) The grip strength test measures general muscular strength. Sle1,Yaa mice displayed increased muscular weakness compared to B6 controls. (F) The treadmill fatigue test measures the exercise induced fatigue threshold. Sle1,Yaa mice showed an increased propensity to fatigue compared to B6 controls. Post-exercise lactate levels did not show any differences, suggesting that the fatigue-like phenotype is unlikely to be driven by muscular deficiencies, but possibly neuroinflammatory factors. Extrapolating from the well-established 3-zone exercise intensity threshold for humans (Seiler and Tønnessen, 2009), and based on our own experience, the mice did not reach the limit of their aerobic capacity; exceeding this limit would have resulted in a sharp spike of blood lactate above 10 mM as mice switched to anaerobic glycolysis. Sample sizes are as follows: B6 (N = 18), Sle1,Yaa (N = 17) for (A) – (E); B6 (N = 11), Sle1,Yaa (N = 12) for (F). Data were analyzed using either Student’s t test or Mann-Whitney U test, assessed by normality of data distribution. n.s., p > 0.05; *, p < 0.05; **, p < 0.01; ***, p < 0.001.
2.3.1. Bright open field
The bright open field test was used to measure anxiety-like behavior in mice (Yilmaz et al., 2021).
2.3.2. Elevated plus maze
The elevated plus maze (EPM) was used to measure anxiety-like behavior in mice. The EPM setup consisted of two open and two closed arms (30×5cm each) extended out from a central platform. The maze surface is elevated 46 cm above the ground. All tests were carried out in dim ambient lighting. Mice were placed in the center platform of the maze, facing an open arm, and allowed to explore the apparatus for 5 min. A computer-assisted video-tracking system (EthoVision XT, Noldus) was used to record the number of open and closed arm entries as well as the distance traveled and total time spent in either arm of the maze.
2.3.3. Light-Dark box
The light–dark box test was used to measure anxiety-like behavior in mice. The experimental setup was an open field chamber measuring 27×27cm (Med Associates) that was equally portioned into two chambers with an opening in between (Yilmaz et al., 2021).
2.3.4. Locomotor activity
Various parameters (ambulatory distance and vertical counts) of mouse activity in an open field chamber (Med Associates) were used to measure general locomotive behavior. Mice were placed in a chamber of dimensions 27×27×20cm and allowed to explore ad libitum for 1 h. A computer-assisted infrared tracking system and software (Activity Monitor, Med Associates) was used to record the number of beam breaks as proxy measures for ambulatory distance and vertical counts. Room lights were dimmed to 20 lx to create a low-stress environment.
2.3.5. Rotarod
The rotarod apparatus (Ugo Basile) was used to assay fatigue-like and/or sensorimotor coordination phenotypes in mice (Yilmaz et al., 2021).
2.3.6. Grip strength
Aggregate limb and forelimb grip strength was measured using a force transducer (Bioseb). Four independent measurements are performed, and the average was taken. Weight normalized strength was calculated by the following: force transduced (g) / body weight (g) (Schroeder et al., 2021).
2.3.7. Wire hanging
The wire hanging test was used to measure muscular endurance in mice. Mice were placed onto the center of a wire grill measuring 75×75cm, with the wire < 1 mm in diameter. The grill was inverted at 90 cm above ground, and the latency to fall was measured. Cotton pads were placed on the ground to minimize blunt trauma after falling. The maximum time on the wire grill was capped at 10 min. The holding impulse was calculated by the following: latency to fall (s) * body weight (kg) * standard gravity (m/s2).
2.3.8. Gait
The gait test was used to measure sensorimotor coordination in mice. Briefly, mice were placed on a treadmill at a constant speed of 13 cm/s, and movement patterns were captured and analyzed by a high frame rate camera and commercial software (TreadScan, CleverSys Inc.). Coordination across multiple axes (longitudinal, lateral, and body rotation) was measured by the standard deviation from the mean per mouse.
2.3.9. Treadmill fatigue
The treadmill fatigue test was adapted and modified (Dougherty et al., 2016) as a measure of fatigue-like behavior. Mice were acclimatized to the treadmill (Columbus Instruments Exer 3/6 Treadmill) for 2 consecutive days prior to testing. Paper towels were threaded through holes in the treadmill lid, spaced approximately one mouse body-length from the shock grid, in order to provide an innocuous cue as a surrogate for electrical shock. The distance between the paper towel inserts and the shock grid was defined as the fatigue zone. On day 1, mice were allowed to explore for 5 min on the treadmill without the shock grid on. After 5 min, the shock grid was powered on (1.5 mA, 3 Hz), and the treadmill belt speed was set to 6 m/min. After 5 min, the belt speed increased 2 m/min every 2 min in a stepwise pattern, to a maximum of 10 m/min for 5 min, before stopping the treadmill. Mice again explored the treadmill for 2 min without shock. Day 2 of acclimatization was the same as day 1 except that the top speed was 12 m/min for 5 min. During testing day, mice were placed in the treadmill at an elevation of 10°, and the treadmill belt speed was increased stepwise over time, to a maximum of 26 m/min (Fig. 2F). Mice were considered fatigued if they entered the fatigue zone for>5 s in 3 separate instances and were subsequently removed from the treadmill. Blood was collected immediately after the mice were removed from the treadmill, and lactate levels were assayed using the Lactate Plus Meter (Nova Biomedical) according to the manufacturer’s instructions. Work done was calculated by the following: total distance traveled (m) * body weight (kg) * standard gravity (m/s2) * sin (10°).
2.4. Gene expression quantification by qPCR
RNA was isolated by phenol–chloroform extraction from whole blood and homogenized brain tissue, followed by cDNA synthesis for qPCR reactions and analysis as previously described (Aw et al., 2020). Gene expression was normalized to Hprt1 and compared using the ΔΔCt method. The ISG index by sample was calculated by taking the geometric mean of the normalized expression values of all 5 ISGs. qPCR primers were as follows:
Hprt1 (F: 5′-GCGTCGTGATTAGCGATGATG, R: 5′-CTCGAG-CAAGTCTTTCAGTCC); Mx1 (F: 5′-CAGCAGTTCAGTCCCATAAC, R: 5′-GACTATAGCTGCTGGTTGTATG); Ifit3 (F: 5′-TCATGAGTGAGGT-CAACCGGG, R: 5′-TGGTTGCACACCCTGTCTTC); Oas2 (F: 5′-GAAACTTCATTCAAACCCGGCCCA, R: 5′-CCGGAAGCCTTCAGCAATGTCAAA); Isg15 (F: 5′-GGCCACAGCAACATCTATGA, R: 5′-CGCAAATGCTTGATCACTGT); Rsad2 (F: 5′ TGCTGGCTGAGAA-TAGCATTAGG, R: 5′-GCTGAGTGCTGTTCCCATCT).
2.5. Genotyping
Genotyping was performed using the primers indicated in Supplementary Table 1.
2.6. Histology
Mouse tissue was dissected and fixed in 4% PFA (Electron Microscopy Sciences) before delivery to the Dana Farber/Harvard Cancer Center (DF/HCC) rodent histopathology core facility for further processing. Samples were embedded in paraffin, sectioned, and stained using hematoxylin and eosin by the core facility. 2 sections per tissue per subject were analyzed in a single-blind manner by an experienced pathologist at the core facility. Images were captured using an IX70 bright field microscope (Olympus) at 10X magnification.
2.7. Multiplexed error robust fluorescent In-Situ hybridization (MERFISH) and analysis
The full list of MERFISH probes is indicated in Supplementary Table 2. Probe design, sample staining, imaging, imaging analysis, and cell segmentation protocols have been described previously (Moffitt et al., 2018). MERFISH probe sequences were designed using reference transcriptomic data from the Ensembl Genome Reference Consortium Mouse Build 38 (mm10). “Pan” versions of murine Ifna and Ifnl were designed by selecting probe sequences that bind to multiple family members of each gene (allowing for 1nt mismatch), such that each gene had between 60 and 70 cognate probes. Quality control metrics for a representative B6 and Sle1,Yaa dataset are reported in Supplementary Figure 7, with per sample metadata reported in Supplementary Table 3.
Cellular, RNA count, and spatial metadata obtained after MERFISH imaging and decoding were incorporated into the Anndata format, then filtered for cellular features and RNA counts and normalized by cell volume prior to concatenation and downstream analysis using the Scanpy package (v1.8.2) (Wolf et al., 2018). Cells were further filtered at this stage by counts (>20 and < 2000) and genes (>2) prior to the application of standard dimensional reduction and clustering workflows. Differential gene expression was performed using the Wilcoxon rank-sum test, and the Benjamini-Hochberg method for multiple testing correction was used, as implemented in the Scanpy package.
2.8. Rnascope in situ hybridization and analysis
Mouse brains were dissected following terminal anesthesia and transcardial perfusion of 20 mL ice-cold PBS. RNAscope in situ hybridization was performed on 16 μm thick cryosections as previously described (Aw et al., 2020) using probes directed against Ifit3 (508251, ACD Bio) according to the manufacturer’s instructions. Confocal images were obtained at either 10X or 30X magnification using the FV3000 confocal system (Olympus). Stitching of tiled images was performed on the Fluoview FV3000 software (Olympus).
2.9. Serum ELISA for murine cytokines
Serum samples were assayed on the VeriPlex Mouse Cytokine 9-Plex ELISA Kit (PBL Assay Science) by contract service from the company (PBL Assay Science).
2.10. Single-nucleus sequencing (sNucSeq) and analysis
The protocol for single-nucleus isolation was adapted from previous studies (Habib et al., 2016, 2017). Briefly, brain regions (hindbrain and whole hippocampus) were dissected and snap frozen on dry ice after mice were transcardially perfused with 20 mL ice-cold PBS. The tissue was dounce homogenized in 2 mL ice-cold nuclei EZ Prep buffer (Sigma), washed, and resuspended in ice-cold NSB (1% BSA, 0.1% RNase inhibitor in 1X RNase free PBS). Nuclei were stained with eFluor-780 (eBioscience) on ice, washed, and FACS-sorted (BD FACSAria) through a 70 μm nozzle in “Purity” mode. An aliquot of nuclei was stained with 0.4% trypan blue (Sigma) and counted in a hemacytometer (VWR Scientific). The appropriate concentration of viable nuclei for a target nuclei number (5000) per sample lane was then used as input for the Chromium NextGem Single Cell 3’ GEM, Library & Gel Bead Kit v3.1 (10X Genomics) following the manufacturer’s instructions. Samples were pooled equimolarly, and sequencing was performed on a NovaSeq 6000 sequencer (Illumina) with 1 pM input on an S4 flow cell. Sequencing output files were demultiplexed, aligned to a reference genome, and single-cell counts were generated using the cellranger (v5.0.0, 10X Genomics) pipeline with parameters optimized for nuclei samples as recommended by the manufacturer. Individual datasets from each 10X chip sample lane were first filtered for genes and cells with a minimum value threshold (min.cells = 3, min.features = 200), followed by a second round of filtering for minimum RNA counts (>3000), gene number (>1000 and < 7500), and mitochondrial content (<5). Post-quality control metrics are reported in Supplementary Table 4.
Read counts were then normalized and variance-stabilized using the sctransform package (Hafemeister and Satija, 2019) prior to integration and standard downstream analysis with the Seurat v3 package (Stuart et al., 2019). Differential expression testing was performed using the DESingle package (Miao et al., 2018). Gene ontology analysis was performed using the gProfiler2 package (Raudvere et al., 2019). Receptor-ligand analysis was performed using the Squidpy package’s (Palla et al., 2021) implementation of permutation testing originally described in the CellPhone DB package (Efremova et al., 2020).
2.11. Statistical analysis
For all statistical analyses, R and GraphPad Prism 8 (GraphPad Software) were used. Error bars represent the standard deviation (s.d.) in all figures. All replicate numbers, statistical tests, p values, and q values used are indicated in the figure legends where appropriate. Statistical tests were selected based on the normality of the data distribution, as assessed by the Shapiro-Wilk test or quantile–quantile (QQ) plot, and on the equality of variance, as assessed by the F test. For comparisons across multiple groups, the appropriate ANOVA tests were used, and the resultant pairwise comparisons were corrected for multiple testing. The specific tests used are indicated in the figure legends where appropriate. Sample sizes and power were not estimated using any statistical methods.
3. Results
3.1. Peripheral correlates of autoimmunity reach peak expression by 14 weeks in Sle1,Yaa males
An enhanced ISG signature is frequently observed in the peripheral blood of lupus patients, with the enrichment of ISG-high cell types correlating with disease severity (Banchereau et al., 2016; Nehar-Belaid et al., 2020). Various murine models of lupus express different intensities of the type 1 interferon gene signature (Zhuang et al., 2015). However, granular temporal data on how these gene expression signatures develop longitudinally remain sparse. Thus, we determined the kinetics of the peripheral blood ISG signature by assessing the aggregate gene expression of a 5-ISG panel (Mx1, Ifit3, Oas2, Isg15, Rsad2) in serially bled B6 and Sle1,Yaa mice. These genes were selected because their human orthologues are enriched in PBMC transcripts from lupus patients across multiple studies (Baechler et al., 2003; Banchereau et al., 2016; Bennett et al., 2003). While the temporal trajectory of individual genes was variable, they all reached peak expression at about 14 weeks of age (Supplementary Fig. 1). These gene-level differences could be due to changes in cell type composition or to modulatory signaling events from other cytokines. Interestingly, we also observed an age-dependent increase in serum TNFα, decreased serum CCL5, and trends toward increased serum IL-6 and IL-10 in Sle1,Yaa mice (Supplementary Fig. 1B).
In aggregate, the ISG signature peaked at 14 weeks of age in Sle1,Yaa mice then decreased until at least 20 weeks of age (Fig. 1A). IFNα is thought to be the predominant interferon responsible for the heightened type 1 interferon signature observed in SLE patients (Crow, 2016; Hua et al., 2006). However, we did not observe statistically significant differences in serum IFNα between genotypes and age groups (Fig. 1B), although there was a trend toward higher levels in 14-week and 20-week-old Sle1,Yaa mice. Given known difficulties in measuring serum IFNα levels, we speculate that the development of higher sensitivity techniques could unmask differences. A similar temporal trend was observed in autoantibody titers, where an aggregated autoantibody score comprising 19 autoantigens peaked at 14 weeks of age but appeared to level off at 20 weeks of age (Fig. 1C and Supplementary Fig. 1C). Collectively, these observations suggest that key peripheral blood autoimmune correlates in the Sle1,Yaa lupus mouse model begin developing by 8 weeks of age and reach a peak at 14 weeks of age, before diverging by 20 weeks of age.
Fig. 1. Temporal profiling of peripheral autoimmune correlates in the Sle1,Yaa mouse model.
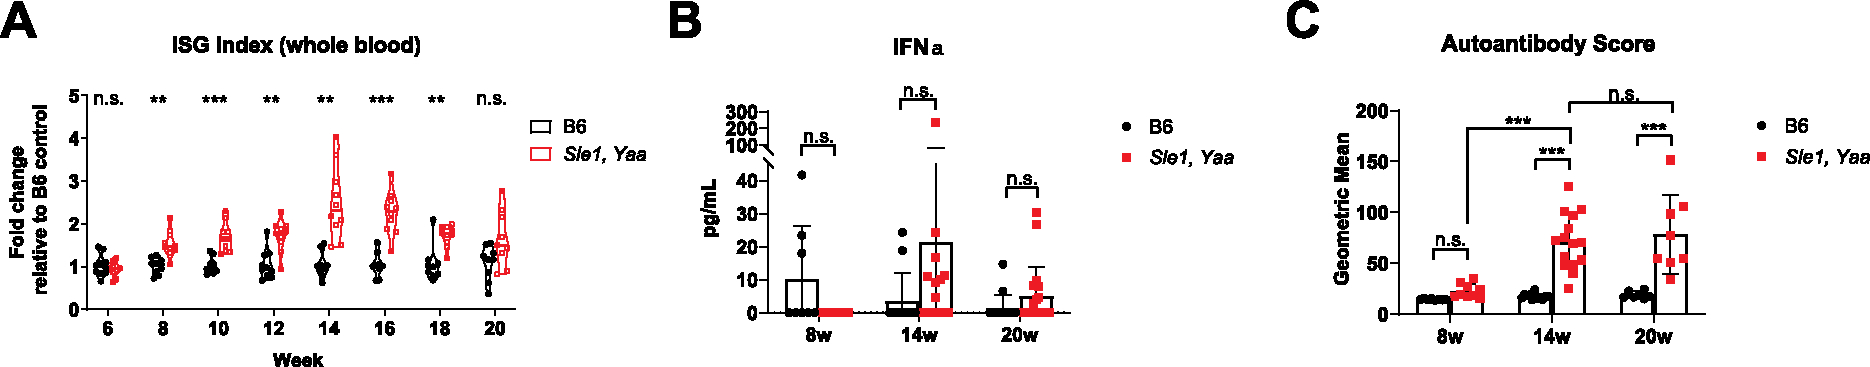
(A) Age matched B6 and Sle1,Yaa male mice were serially bled every 2 weeks starting from 6 weeks of age (N = 10 per group). The peripheral blood ISG index was calculated using the geometric mean of ΔΔCt normalized gene expression values of the following ISGs: Mx1, Ifit3, Oas2, Isg15, and Rsad2. 1 B6 mouse died at week 14, and 1 Sle1,Yaa mouse died at week 20; data points for these mice were included in statistical analyses up until the point of death. Statistics were calculated with two-way fixed effects ANOVA, and post hoc comparisons were corrected using Sidak’s method. (B) Serum IFNα was assessed across the 8 week (N = 8, B6; N = 9, Sle1,Yaa), 14 week (N = 12, B6; N = 15, Sle1,Yaa), and 20 week (N = 15, B6; N = 19, Sle1,Yaa) age groups. Statistics were calculated with two-way fixed effects ANOVA, and post hoc comparisons were corrected using Tukey’s method. (C) Serum autoantibody titers targeting 19 different autoantigens were assessed across the 8 week (N = 8, B6; N = 9, Sle1,Yaa), 14 week (N = 12, B6; N = 15, Sle1,Yaa), and 20 week (N = 7, B6; N = 8, Sle1,Yaa) age groups. The autoantibody score was computed by taking the geometric mean of MFI values across 19 autoantigens per sample. Statistics were calculated with two-way fixed effects ANOVA, and post hoc comparisons were corrected using Sidak’s method. n.s., p > 0.05; *, p < 0.05; **, p < 0.01; ***, p < 0.001.
3.2. Sle1,Yaa mice exhibit anxiety- and fatigue-like behavioral phenotypes
We hypothesized that any type 1 interferon signaling-dependent behavioral phenotypes would correlate with proxy measures of the peripheral blood ISG signature. Consequently, we performed behavioral phenotyping at the 14-week timepoint, when peak type 1 interferon signature was observed. A pilot battery of behavioral tests did not reveal any social-, cognitive-, or depressive-like phenotypes, but suggested anxiety- and fatigue-like phenotypes (data not shown), which are found in 37% and 80% of NPSLE patients, respectively (Ahn and Ramsey-Goldman, 2012; Zhang et al., 2017). Using an expanded battery of behavioral tests for anxiety- and fatigue-like phenotypes, we confirmed that Sle1,Yaa mice displayed increased anxiety-(Fig. 2A – 2B; Supplementary Fig. 2A) and fatigue-like behaviors (Fig. 2C – 2F; Supplementary Fig. 2B). Gait analyses did not reveal any statistically significant differences in motor coordination between B6 and Sle1,Yaa mice (Supplementary Fig. 2C), and gross pathology was not observed in major joint or muscular tissues from B6 or Sle1,Yaa mice (Supplementary Fig. 2D), suggesting that fatigue, not ataxia or peripheral tissue inflammation or damage, is the main contributor to the decreased locomotive phenotypes observed. These anxiety- and fatigue-like behaviors also persisted at 20 weeks of age despite the altered cytokine and type 1 interferon signature profile present at this age in Sle1,Yaa mice (Supplementary Fig. 3), suggesting a potential decoupling between peripheral inflammation and behavioral phenotypes.
Maternal inflammation and genetic drift contribute to rodent behavioral phenotypes (Aw et al., 2021; Crusio et al., 2009). Due to the location of the Yaa mutation on the Y chromosome, gender-matched littermates could not be used to control for the aforementioned factors. Therefore, we utilized a breeding scheme (Supplementary Fig. 4A) where subjects were derived from Sle1 heterozygous dams that were themselves derived from crosses between B6 and Sle1,Yaa mice (complex breeders). Because pups were derived from dams with the same genotype, maternal inflammation could be controlled. The effect of genetic drift was minimized by using breeder mice that were derived from multiple crosses between the 2 genotypes. The fold change increase in the peripheral blood ISG signature in 14-week complex breeder–derived Sle1,Yaa mice was comparable to that of normal breeder–derived Sle1,Yaa mice (Supplementary Fig. 4B). In comparing the behavioral phenotypes of complex breeders with normal breeders, we also found that genotype, but not breeding, accounted for most of the variance observed except for grip strength, where both genotype and breeding accounted for similar levels of variance (Supplementary Fig. 4C–J). These results suggest that contributions from maternal inflammation and genetic drift to both peripheral autoimmunity and behavior are minimal and that genotype is the largest explanatory factor for the observed phenotypes. Therefore, we utilized homozygously bred mice for all other experiments.
3.3. Unbiased single-nucleus sequencing confirms the dominant upregulation of type 1 interferon signaling and reveals a general decrease in cellular and synaptic interactions
Using spatial transcriptomic techniques which are described further in Section 3.4, we prescreened brain regions which display (1) a relatively high degree and consistency of ISG enrichment and (2) evidence of anatomical correlation with our observed behavioral phenotypes of anxiety- and fatigue-like behavior (Supplementary Fig. 5A–D). Additional support by RNAscope showed a greater ISG signature in the subcortical region, particularly the ventral hippocampus (Supplementary Figure 5E). The hindbrain was also selected, and a dissection schematic demonstrates inclusion of the brain stem, which notably contains the raphe nuclei (Supplementary Figure 5F). The raphe nuclei contain serotonergic neurons and are thought to have implications for anxiety and fatigue via regulation of this neurotransmitter (Azmitia and Segal, 1978). Thus, we leveraged unbiased single-nuclei sequencing (sNucSeq, Habib et al., 2016, 2017) on the whole (dorsal and ventral) hippocampus (Arriaga and Han, 2017; Jimenez et al., 2018) and hindbrain (Barnden et al., 2011; Venkatraman et al., 2017) of 14-week-old B6 and Sle1,Yaa mice (N = 2 per genotype). After quality control filtering and separate concatenation of the hindbrain and hippocampal datasets, 33,327 cells with 2639 median genes per cell and 7403 median UMI counts per cell and 31,005 cells with 4414 median genes per cell and 17,441 median UMI counts per cell were retained, respectively, from B6 or Sle1,Yaa mice (Supplementary Figure 5G and Supplementary Table 4).
We identified the expected major cell classes in each of the datasets (Fig. 3A; Supplementary Figure 6A and 6B), with similar clustering patterns across individual samples and genotypes (Supplementary Figure 6C and 6D). Enrichment of the ISG index was apparent in vascular and glial cell types in both the hindbrain and hippocampus within the Sle1,Yaa genotype. Interestingly, there also appeared to be a small ISG signature–enriched population in the Sle1,Yaa hippocampal dentate gyrus (DG) and CA3 cell types (Fig. 3B and 3C). Lower numbers of nuclei were obtained for the vascular and polydendrocyte cell classes, and only a small proportion of neurons expressed ISGs. We focused our analyses on the other glial cell types (astrocytes and oligodendrocytes) that make up the bulk of the ISG expressing cluster of cells. In light of recent studies demonstrating that nuclear RNA levels are comparable to the cytoplasmic pool of RNAs, microglia were included in initial analyses for differential expression, especially due to their role as resident macrophages of the brain (Habib et al., 2017). However, due to the low number of isolated microglial nuclei, meaningful differential gene expression analysis was limited. Thus, this cell class will be explored more deeply in future studies.
Fig. 3.

Upregulation of the type 1 interferon response across all CNS cell types. (A) UMAP plot for all major cell classes within the hindbrain and hippocampus, with cell types colored by cluster. (B) UMAP plots of the hindbrain, separated by genotype and colored by the ISG expression index. (C) UMAP plots of the hippocampus, separated by genotype and colored by the ISG expression index. (D) Volcano plots showing DEGs in the hindbrain and hippocampus between the B6 and Sle1,Yaa genotypes. ISGs were defined by querying the DE gene list with the Interferome database (Rusinova et al., 2013). Dotted lines delineate Log2 Fold Change > 1.32 and −Log10q > 3.
We first confirmed that ISGs accounted for most of the differentially expressed genes (DEGs) between genotypes in both brain regions (Fig. 3D), supporting the hypothesis that dysregulated type 1 interferon signaling is a key driver of pathology in the Sle1,Yaa brain. Narrowing down to astrocytes, oligodendrocytes, and hindbrain microglia, ISGs were the predominant class of DEGs, accounting for > 50% total DEGs (Supplementary Figure 7A and 7B). Hippocampal microglia did not reveal any significant DEGs, likely due to low nuclei count. Pathway analyses of DEGs within astrocytes from both brain regions showed an expected upregulation of the type 1 interferon response pathway. Also interestingly, our analyses show asymmetric downregulation of biological pathways between brain regions: nervous system development and neurogenesis terms were downregulated only in hindbrain astrocytes and the lipid metabolism term was downregulated only in hippocampal astrocytes, suggesting regional differences in the biological response to IFNα among astrocytes (Supplementary Figure 8A and 8B). Cholesterol synthesis and secretion by hippocampal astrocytes are critical for synaptic maturation and, consequently, for short- and long-term potentiation in neurons (van Deijk et al., 2017); it could therefore be of interest to further investigate the role of perturbed astrocyte lipid metabolism on neuronal function in Sle1,Yaa mice.
Interestingly, despite the high proportion of ISG DEGs in oligodendrocytes, only the hippocampal oligodendrocytes had strongly upregulated antiviral/type 1 interferon–related pathways, once again reflecting a possible region-specific difference in the cellular response to IFNα signaling. Conversely, hindbrain oligodendrocytes had stronger upregulation of multiple metabolic pathways, including nitrogen metabolism and oxidative phosphorylation (OXPHOS). Oligodendrocytes from both brain regions had a general downregulation of neuronal developmental and synaptic interaction pathways (Supplementary Figure 8C and 8D), suggesting they had fewer interactions with other CNS cell types. This is another interesting avenue of further investigation, as cellular interactions between oligodendrocytes and neurons are necessary for targeted axon myelination (Almeida, 2018). In fact, NPSLE patients tend to have white matter abnormalities (Costallat et al., 2018; Jung et al., 2010), suggesting a clear clinical phenotype that may be replicated in the Sle1,Yaa mouse model.
Given the enrichment of ISGs across these regions, as well as the spatial clustering of these cells (refer to results in Section 3.4), we arbitrarily defined a subset of cells that highly express ISGs and queried their potential interactions between astrocytes, oligodendrocytes, and major neuronal clusters with all other cell types within this subset using Squidpy’s ligand-receptor analysis package (Palla et al., 2021). We prioritized interaction factors with source cell types containing genes that were previously defined as differentially expressed and found a general decrease in cellular and synaptic interaction pathways. By querying the Interferome database (Rusinova et al., 2013), some of these interaction factor genes were also identified as ISGs (e.g. Nlgn1, Nlgn2) or negatively regulated by type 1 interferon signaling (e.g. Nrxn3, Fgf14), suggesting that particular interactions may in fact be enriched, or repressed, within the ISG patches relative to the non-ISG milieu. We observe an almost uniform decrease in components of the type 1 interferon-regulated Neuroligin (Nlgn) – Neurexin (Nrxn) synapse adhesion module across hindbrain astrocytes, hippocampal oligodendrocytes, and most major neuronal clusters, except for the Excitatory Neuron 1 cluster in the hindbrain, and the DG cluster in the hippocampus (Supplementary Figure 9, Supplementary Tables 5 and 6). We also found a universal decrease in the expression of Fgf12 and Fgf14 among the major neuronal classes. FGF12 and FGF14 physically interact with voltage-gated sodium channels and regulate action potential transmission (Pablo et al., 2016). Interestingly, Fgf14 knockout (Fhf4−/−) and Fgf12, Fgf14 double knockout (Fhf1−/−, Fhf4−/−) mice showed clear evidence of ataxia and motor weakness, which was attributed to decreased intrinsic excitability of cerebellar granule neurons (Goldfarb et al., 2007).
The overall downregulation of cellular communication interactions in these cell types across brain regions of Sle1,Yaa mice suggests that neurons have fewer interactions with each other, astrocytes, and oligodendrocytes within this type 1 interferon inflammation milieu. Given the multifaceted roles of glial-neuron synaptic communication in maintaining neuronal homeostasis, particularly with respect to astrocytes (Mederos et al., 2018), it will be important to further define key dysregulated interaction factors between these cell types and interrogate their possible roles in mediating behavioral phenotypes in Sle1,Yaa mice.
3.4. The type 1 interferon signature is spatially enriched within the brain parenchyma of Sle1,Yaa mice
Given the varying functions across regions of the brain, we hypothesized that spatial specificity in ISG enrichment could underlie differences in behavior. Leveraging the multiplexed error-robust fluorescence in situ hybridization (MERFISH) (Chen et al., 2015), we designed a 224-plex gene library that included a curated panel of 58 ISGs that impact other cellular processes, such as metabolism and transcription, and that were highly conserved across different animal phylogenies (Shaw et al., 2017) (Supplementary Table 2). Other gene sets included broad cell type markers and genes involved in neuronal activation and phagocytic engulfment. These genes were selected to reflect the known roles of type 1 interferon in modulating neuronal firing rates and increasing microglial synaptic engulfment, both of which influence behavioral outcomes (Blank et al., 2016; Dafny et al., 1996; Reyes-Vazquez et al., 1982; Aw et al., 2020; Roy et al., 2020). A selection of cytokines (including pan-Ifna and pan-Ifnl) and chemokines were also included to leverage the greater sensitivity of FISH-based approaches in detecting short genes, which have higher dropout rates in single-cell sequencing approaches (Phipson et al., 2017). Given the clear behavioral phenotypes observed at 14 weeks of age, we performed MERFISH on 2 biological replicates each of 14-week-old Sle1,Yaa and B6 controls.
In total, we profiled > 400,000 cells with a total RNA count of ~ 197 million across the 4 samples (Supplementary Table 3 and Supplementary Figure 10) and identified all major cell classes present in the brain (Fig. 4A), in their expected spatial distribution (Supplementary Figure 11A). We identified a subset of the ISG gene set that appeared to be enriched in aggregate within the vascular and glial cell classes of Sle1, Yaa mice (Fig. 4B). Strikingly, these ISGs appeared to be spatially segregated into distinct patches across the brain parenchyma (Fig. 4C), with distinct spatial “ranges” across different ISGs (Supplementary Figure 11B). The presence of these ISG patches was independently validated using RNAscope in situ hybridization, which showed spatially heterogeneous localizations across the brain parenchyma that appear to be more prevalent in the subcortical regions (Fig. 4D). Interestingly, these patches also appeared to be present at both 8 weeks and 20 weeks of age (Supplementary Figure 12), suggesting that type 1 interferon-mediated inflammation in the brain could predate overt peripheral autoimmune inflammation and that it persists despite changes in the peripheral blood interferon signature.
Fig. 4. Spatially enriched patches of ISGs in the brain parenchyma of Sle1,Yaa mice.

(A) Uniform manifold approximation and projection (UMAP) plot for all major cell classes within the brain parenchyma, with cell types colored by cluster. (B) Volcano plot showing DEGs between all cell classes of the B6 and Sle1,Yaa genotypes. Genes belonging to the ISG class of genes are highlighted. UMAP plots comparing the ISG signature in B6 and Sle1,Yaa mice (N = 2 per group), with clear enrichment in the Sle1,Yaa group. Statistically significant (q < 0.05) genes that were part of the a priori defined library of ISGs were identified, and the geometric mean (ISG index) of normalized count expression across these genes was computed on a per-cell basis. ISG index-high gene expression appeared to be enriched in the vascular compartment as well as in glial cells such as astrocytes, microglia, and oligodendrocytes. (C) Spatial plots of the ISG index across each individual sample, showing clustered patches of ISG index-high cells in the Sle1,Yaa mice. (D) Tiled confocal images of RNAscope in situ hybridized Ifit3 probe in independent 14 week old B6 and Sle1,Yaa samples, showing spatial patches in the Sle1,Yaa genotype and validating the MERFISH observations.
In summary, our transcriptomic data collectively suggest that dysregulated IFNAR signaling is a key event within the CNS of Sle1,Yaa mice that is spatially restricted and more enriched in glial cells compared to neurons. Despite brain region-specific differences in other affected cellular pathways, there appeared to be a uniform cellular response to type 1 interferon signaling, as well as a concomitant decrease in cellular and synaptic interactions among most clusters.
4. Discussion
In the Sle1,Yaa mouse model of lupus, which develops accelerated autoimmune disease due to over-exuberant TLR7 signaling, we found that an elevated peripheral blood type 1 interferon signature appears at 8 weeks of age, peaks at 14 weeks of age, and declines by 20 weeks of age. This observation could be due to the differential expression of cytokines, most notably TNFα (Supplementary Fig. 1A), which can repress type 1 interferon signaling but also independently induce a subset of ISGs (Cantaert et al., 2010; Wang et al., 2016). Elevated TNFα levels are also observed in SLE patients and correlate strongly with renal disease activity (Idborg et al., 2018). Furthermore, serum autoantibody titers in the Sle1,Yaa model show a similar trend, being slightly elevated at 8 weeks of age, prior to peaking at 14 and 20 weeks of age (Supplementary Fig. 1B). The Sle1,Yaa mouse model therefore exhibits an accelerated lupus-like autoimmune disease that recapitulates key immunological features of human disease. Importantly, we found that the Sle1,Yaa mouse model displays anxiety- and fatigue-like behavioral deficits that are reflective of common neuropsychiatric symptoms experienced by NPSLE patients (Ahn and Ramsey-Goldman, 2012; Zhang et al., 2017) and may be linked to ISG-enriched patches in the brain.
Our findings raise important questions about the source of type 1 interferon stimulating the formation of these ISG patches and how the patches lead to behavioral phenotypes. The patch-like nature of ISGs argues against a model of peripheral type 1 interferons randomly crossing the blood–brain barrier. Since CNS blood vessels are IFNAR-signaling competent and the first point of CNS contact from circulating cytokines, a peripheral source of IFNα would be expected to result in ISG positivity across the brain vasculature, which was not observed. Moreover, our preliminary experiments with B6-Sle1,Yaa parabiotic mice and peripherally injected IFNα do not show evidence of ISG patch formation (Aw et al 2020; E.A., unpublished data). Given low levels of circulating peripheral blood IFNα in SLE patients (Rodero et al., 2017), it is likely that peripherally produced type 1 interferons in lupus are largely consumed by a peripheral “sink”, leaving insignificant amounts to cross the blood–brain barrier, which already possesses limited permeability to IFNα (Pan et al., 1997). However, we cannot discount the possibility of immune cells that circulate to the meninges early in life or those derived from the calvarial bone marrow as sources of local type 1 interferon (Brioschi et al., 2021; Cugurra et al., 2021). Another possibility is intracerebroventricular (ICV) production of IFNα, which has been detected in the cerebrospinal fluid (CSF) of NPSLE patients (Shiozawa et al., 1992; Varley et al., 2020). While this could be a potential source during the later course of disease, it is unlikely prior to the 20-week timepoint in Sle1,Yaa mice, given that ISG expression was not apparent among ependymal cells in either of our sequencing or in situ hybridization data.
Another possibility would be brain parenchyma-derived type 1 interferon; Tlr7 is most abundantly expressed by microglia within the CNS (Michaelis et al., 2019), and the Yaa allele-mediated Tlr7 could enhance signaling and endogenous production of type 1 interferons and other inflammatory cytokines. Consequently, the observations of ISG patches could result from stochastic activation of TLR7 signaling by individual microglia, leading to geographically restricted areas of inflammation. While our MERFISH data show small but statistically significant differences in some microglial cytokine expression, they were not spatially enriched. Moreover, we did not detect any transcriptional enrichment of microglial cytokines within our sNucSeq dataset. Therefore, much remains to be uncovered regarding the source of inflammatory cytokines driving the formation of CNS ISG patches, and as a corollary, their temporal persistence within defined geographies.
Among ISG patches, our sNucSeq pathway analysis demonstrated a general downregulation of synaptic adhesion components (e.g. Nlgn1, Nlgn2, Lrfn5) in several neuronal clusters. These synaptic adhesion molecules play a key role in synaptic maturation and organization, and show strong genome-wide associations with several neuropsychiatric diseases (Lie et al., 2018; Südhof, 2017). However, in the hindbrain, these interaction factors were contrarily enriched in pairings between the Serotonergic Neuron cluster with clusters of Excitatory Neuron 2, Excitatory Neuron 3, and Interneuron. Serotonin plays a critical role in mediating higher-order behaviors, especially the anxiety- and fatigue-like behaviors we observe in Sle1,Yaa mice (Fischer and Ullsperger, 2017; Marcinkiewcz et al., 2016). The altered connectivity between the raphe nuclei (main producers of serotonin, located in the hindbrain) and their afferent inputs could therefore result in dysregulated serotonergic neurotransmission, thereby affecting behavior.
In summary, while all cell types within the CNS parenchyma can respond to type 1 interferon, it is unlikely that any one cell type will singularly be sufficient to cause behavioral pathology in the Sle1,Yaa model. It will be important to systematically dissect the contributions of individual CNS cell types, within and outside the ISG patches, to behavioral phenotypes in the Sle1,Yaa model. We hypothesize that deeper understanding of CNS-restricted IFNAR signaling can drive therapeutic blockade of IFNAR in the CNS and rescue behavioral deficits.
5. Study limitations and future directions
A key limitation of our study is that the Yaa-driven male bias in the Sle1,Yaa model does not reflect the overwhelming female (9 to 1) bias in human disease (Tsokos, 2011). However, genetic polymorphisms and copy number variations in the TLR7 signaling pathway, as well as in T and B cell signaling, have been identified as risk factors for SLE (Moulton et al., 2017). Furthermore, there is 14-fold increased risk of SLE in male Klinefelter’s syndrome (XXY chromosome configuration) patients (Scofield et al., 2008). These human genetic studies suggest that the immunological basis of the Sle1,Yaa mouse model is relevant to human disease despite the incongruency in gender bias. The Sle1,Tg7 mouse is a modified version of Sle1,Yaa that could address this gender limitation. Instead of Yaa, Sle1,Tg7 contains a transgenic Tlr7 without the flanking genes in Yaa, mirroring the two-fold increase in expression of Tlr7 as well as autoimmune sequelae seen in Sle1,Yaa male mice (Hwang et al., 2012). Thus, the Sle1,Tg7 strain would likely be a viable alternative that better reflects the gender bias seen in human patients, given that the Tg7 transgene is present on an autosomal chromosome, and female Sle1,Tg7 can therefore be experimentally prioritized.
In order to test the necessity of the Sle1,Yaa genetic background in the CNS parenchyma in generating ISG patches, we have planned to perform B6 and Sle1,Yaa bone marrow transfers into irradiated Ifnar1-sufficient and deficient Sle1,Yaa recipients.
Finally, a key next step in terms of human translatability would involve validation of the type 1 interferon signature in the brains of NPSLE patients, as well as the possibility of the interferon signature being spatially restricted in patches vis-a-vis the Sle1,Yaa mouse brain.
6. Conclusions
Our work lays the foundation for further investigation of CNS IFNAR signaling in NPSLE. We demonstrate that the Sle1,Yaa mouse model of NPSLE exhibits spatially enriched patches of ISGs in the brain and that the type 1 interferon signature is a dominantly upregulated pathway in the brain. A greater understanding of the mechanistic link between the spatially restricted interferon signaling and subsequent behavior changes will support the potential therapeutic use and development of blood brain barrier–permeable type 1 interferon signaling modulators for NPSLE.
Supplementary Material
8. Funding sources
This work was supported by the National Institutes of Health, grants numbers: R01 AR072965, P50MH112491, and R01 AR074105. U.S.H. was supported by a postdoctoral mobility fellowship from the Swiss National Science Foundation (P400PM_186763) and a grant of the Novartis Foundation for Medical-Biological Research (#19B072).
Footnotes
Declaration of Competing Interest
The authors declare that they have no known competing financial interests or personal relationships that could have appeared to influence the work reported in this paper.
Appendix A. Supplementary data
Supplementary data to this article can be found online at https://doi.org/10.1016/j.bbi.2023.06.021.
7. Data accessibility statement
Raw and processed sNucSeq data discussed in this publication will be deposited in NCBI’s Gene Expression Omnibus (Edgar et al., 2002) and will be accessible through GEO Series upon request. Raw and processed data for MERFISH supporting the findings of this study are located on the local Moffitt Lab server of the Boston Children’s Hospital Program in Cellular and Molecular Medicine, available upon request.
Data availability.
Data will be made available on request.
References
- Ahn GE, Ramsey-Goldman R, 2012. Fatigue in systemic lupus erythematosus. Int. J. Clin. Rheumtol. 7 (2), 217–227. [DOI] [PMC free article] [PubMed] [Google Scholar]
- Almeida RG, 2018. The Rules of Attraction in Central Nervous System Myelination. Front. Cell, Neurosci, p. 12. [DOI] [PMC free article] [PubMed] [Google Scholar]
- Arriaga M, Han EB, 2017. Dedicated hippocampal inhibitory networks for locomotion and immobility. J. Neurosci. 37 (38), 9222–9238. [DOI] [PMC free article] [PubMed] [Google Scholar]
- Aw E, Zhang Y, Carroll M, 2020. Microglial responses to peripheral type 1 interferon. J. Neuroinflammation 17, 340. [DOI] [PMC free article] [PubMed] [Google Scholar]
- Aw E, Zhang Y, Yalcin E, Herrmann US, Carroll MC, 2021. Neuropsychiatric disorders: an immunological perspective. In Advances in Immunology 83–155. [DOI] [PubMed] [Google Scholar]
- Azmitia EC, Segal M, 1978. An autoradiographic analysis of the differential ascending projections of the dorsal and median raphe nuclei in the rat. J. Comp. Neurol. 179 (3), 641–667. [DOI] [PubMed] [Google Scholar]
- Baechler EC, Batliwalla FM, Karypis G, Gaffney PM, Ortmann WA, Espe KJ, Shark KB, Grande WJ, Hughes KM, Kapur V, Gregersen PK, Behrens TW, 2003. Interferon-inducible gene expression signature in peripheral blood cells of patients with severe lupus. Proc. Natl. Acad. Sci. U. S. A. 100 (5), 2610–2615. [DOI] [PMC free article] [PubMed] [Google Scholar]
- Banchereau R, Hong S, Cantarel B, Baldwin N, Baisch J, Edens M, Cepika A-M, Acs P, Turner J, Anguiano E, Vinod P, Khan S, Obermoser G, Blankenship D, Wakeland E, Nassi L, Gotte A, Punaro M, Liu Y-J, Banchereau J, Rossello-Urgell J, Wright T, Pascual V, 2016. Personalized immunomonitoring uncovers molecular networks that stratify lupus patients. Cell 165 (3), 551–565. [DOI] [PMC free article] [PubMed] [Google Scholar]
- Barnden LR, Crouch B, Kwiatek R, Burnet R, Mernone A, Chryssidis S, Scroop G, Del Fante P, 2011. A brain MRI study of chronic fatigue syndrome: evidence of brainstem dysfunction and altered homeostasis. NMR Biomed. 24 (10), 1302–1312. [DOI] [PMC free article] [PubMed] [Google Scholar]
- Bennett L, Palucka AK, Arce E, Cantrell V, Borvak J, Banchereau J, Pascual V, 2003. Interferon and granulopoiesis signatures in systemic lupus erythematosus blood. J. Exp. Med. 197, 711–723. [DOI] [PMC free article] [PubMed] [Google Scholar]
- Blank T, Detje C, Spieß A, Hagemeyer N, Brendecke S, Wolfart J, Staszewski O, Zöller T, Papageorgiou I, Schneider J, Paricio-Montesinos R, Eisel UM, Manahan-Vaughan D, Jansen S, Lienenklaus S, Lu B, Imai Y, Müller M, Goelz S, Baker D, Schwaninger M, Kann O, Heikenwalder M, Kalinke U, Prinz M, 2016. Brain endothelial- and epithelial-specific interferon receptor chain 1 drives virus-induced sickness behavior and cognitive impairment. Immunity 44 (4), 901–912. [DOI] [PubMed] [Google Scholar]
- Brioschi S, Wang W-L, Peng V, Wang M, Shchukina I, Greenberg ZJ, Bando JK, Jaeger N, Czepielewski RS, Swain A, Mogilenko DA, Beatty WL, Bayguinov P, Fitzpatrick JAJ, Schuettpelz LG, Fronick CC, Smirnov I, Kipnis J, Shapiro VS, Wu GF, Gilfillan S, Cella M, Artyomov MN, Kleinstein SH, Colonna M, 2021. Heterogeneity of meningeal B cells reveals a lymphopoietic niche at the CNS borders. Science (80- 373 (6553). [DOI] [PMC free article] [PubMed] [Google Scholar]
- Cantaert T, Baeten D, Tak PP, van Baarsen LG, 2010. Type I IFN and TNFα cross-regulation in immune-mediated inflammatory disease: basic concepts and clinical relevance. Arthritis Res. Ther. 12, 219. [DOI] [PMC free article] [PubMed] [Google Scholar]
- Chen KH, Boettiger AN, Moffitt JR, Wang S, Zhuang X, 2015. Spatially resolved, highly multiplexed RNA profiling in single cells. Science (80-. ). 348, 1360–1363. [DOI] [PMC free article] [PubMed] [Google Scholar]
- Costallat BL, Ferreira DM, Lapa AT, Rittner L, Costallat LTL, Appenzeller S, 2018. Brain diffusion tensor MRI in systematic lupus erythematosus: a systematic review. Autoimmun. Rev. 17 (1), 36–43. [DOI] [PubMed] [Google Scholar]
- Crow MK, 2014. Type I interferon in the pathogenesis of lupus. J. Immunol. 192 (12), 5459–5468. [DOI] [PMC free article] [PubMed] [Google Scholar]
- Crow MK, 2016. Interferon α or β: which is the culprit in autoimmune disease? Nat. Rev. Rheumatol. 12 (8), 439–440. [DOI] [PubMed] [Google Scholar]
- Crusio WE, Goldowitz D, Holmes A, Wolfer D, 2009. Standards for the publication of mouse mutant studies. Genes, Brain Behav. 8, 1–4. [DOI] [PubMed] [Google Scholar]
- Cugurra A, Mamuladze T, Rustenhoven J, Dykstra T, Beroshvili G, Greenberg ZJ, Baker W, Papadopoulos Z, Drieu A, Blackburn S, Kanamori M, Brioschi S, Herz J, Schuettpelz LG, Colonna M, Smirnov I, Kipnis J, 2021. Skull and vertebral bone marrow are myeloid cell reservoirs for the meninges and CNS parenchyma. Science 373 (6553). [DOI] [PMC free article] [PubMed] [Google Scholar]
- Dafny N, Prieto-Gomez B, Dong W-Q, Reyes-Vazquez C, 1996. Interferon modulates neuronal activity recorded from the hypothalamus, thalamus, hippocampus, amygdala and the somatosensory cortex. Brain Res. 734 (1–2), 269–274. [PubMed] [Google Scholar]
- Das A, Heesters BA, Bialas A, O’Flynn J, Rifkin IR, Ochando J, Mittereder N, Carlesso G, Herbst R, Carroll MC, 2017. Follicular dendritic cell activation by TLR ligands promotes autoreactive B cell responses. Immunity 46 (1), 106–119. [DOI] [PMC free article] [PubMed] [Google Scholar]
- Dougherty JP, Springer DA, Gershengorn MC, 2016. The Treadmill Fatigue Test: A Simple. High-throughput Assay of Fatigue-like Behavior for the Mouse. J. Vis, Exp [DOI] [PMC free article] [PubMed] [Google Scholar]
- Efremova M, Vento-Tormo M, Teichmann SA, Vento-Tormo R, 2020. Cell PhoneDB: inferring cell–cell communication from combined expression of multi-subunit ligand–receptor complexes. Nat. Protoc. 15 (4), 1484–1506. [DOI] [PubMed] [Google Scholar]
- El Khoury L, Zarfeshani A, Diamond B, 2020. Using the mouse to model human diseases: cognitive impairment in systemic lupus erythematosus. J. Rheumatol. 47 (7), 1145–1149. [DOI] [PMC free article] [PubMed] [Google Scholar]
- Fairhurst A-M, Hwang S-H, Wang A, Tian X-H, Boudreaux C, Zhou X, Casco J, Li Q-Z, Connolly J, Wakeland E, 2008. Yaa autoimmune phenotypes are conferred by overexpression of TLR7. Eur. J. Immunol. 38 (7), 1971–1978. [DOI] [PMC free article] [PubMed] [Google Scholar]
- Fischer AG, Ullsperger M, 2017. An Update on the Role of Serotonin and its Interplay with Dopamine for Reward. Front. Hum, Neurosci, p. 11. [DOI] [PMC free article] [PubMed] [Google Scholar]
- Goldfarb M, Schoorlemmer J, Williams A, Diwakar S, Wang Q, Huang X, Giza J, Tchetchik D, Kelley K, Vega A, Matthews G, Rossi P, Ornitz DM, D’Angelo E, 2007. Fibroblast growth factor homologous factors control neuronal excitability through modulation of voltage-gated sodium channels. Neuron 55 (3), 449–463. [DOI] [PMC free article] [PubMed] [Google Scholar]
- Habib N, Li Y, Heidenreich M, Swiech L, Avraham-Davidi I, Trombetta JJ, Hession C, Zhang F, Regev A, 2016. Div-Seq: Single-nucleus RNA-Seq reveals dynamics of rare adult newborn neurons. Science (80- 353 (6302), 925–928. [DOI] [PMC free article] [PubMed] [Google Scholar]
- Habib N, Avraham-Davidi I, Basu A, Burks T, Shekhar K, Hofree M, Choudhury SR, Aguet F, Gelfand E, Ardlie K, Weitz DA, Rozenblatt-Rosen O, Zhang F, Regev A, 2017. Massively parallel single-nucleus RNA-seq with DroNc-seq. Nat. Methods 14 (10), 955–958. [DOI] [PMC free article] [PubMed] [Google Scholar]
- Hafemeister C, Satija R, 2019. Normalization and variance stabilization of single-cell RNA-seq data using regularized negative binomial regression. Genome Biol. 20, 296. [DOI] [PMC free article] [PubMed] [Google Scholar]
- Hua J, Kirou K, Lee C, Crow MK, 2006. Functional assay of type I interferon in systemic lupus erythematosus plasma and association with anti–RNA binding protein autoantibodies. Arthritis Rheum. 54 (6), 1906–1916. [DOI] [PubMed] [Google Scholar]
- Hwang S-H, Lee H, Yamamoto M, Jones LA, Dayalan J, Hopkins R, Zhou XJ, Yarovinsky F, Connolly JE, Curotto de Lafaille MA, et al. (2012). B Cell TLR7 Expression Drives Anti-RNA Autoantibody Production and Exacerbates Disease in Systemic Lupus Erythematosus–Prone Mice. J. Immunol. 189, 5786–5796. [DOI] [PMC free article] [PubMed] [Google Scholar]
- Idborg H, Eketjäll S, Pettersson S, Gustafsson JT, Zickert A, Kvarnström M, Oke V, Jakobsson P-J, Gunnarsson I, Svenungsson E, 2018. TNF-α and plasma albumin as biomarkers of disease activity in systemic lupus erythematosus. Lupus Sci. Med. 5 (1), e000260. [DOI] [PMC free article] [PubMed] [Google Scholar]
- Jeltsch-David H, Muller S, 2014. Neuropsychiatric systemic lupus erythematosus: pathogenesis and biomarkers. Nat. Rev. Neurol. 10 (10), 579–596. [DOI] [PubMed] [Google Scholar]
- Jimenez JC, Su K, Goldberg AR, Luna VM, Biane JS, Ordek G, Zhou P, Ong SK, Wright MA, Zweifel L, Paninski L, Hen R, Kheirbek MA, 2018. Anxiety cells in a hippocampal-hypothalamic circuit. Neuron 97 (3), 670–683.e6. [DOI] [PMC free article] [PubMed] [Google Scholar]
- Jung RE, Caprihan A, Chavez RS, Flores RA, Sharrar J, Qualls CR, Sibbitt W, Roldan CA, 2010. Diffusion tensor imaging in neuropsychiatric systemic lupus erythematosus. BMC Neurol. 10 (1). [DOI] [PMC free article] [PubMed] [Google Scholar]
- Kivity S, Agmon-Levin N, Zandman-Goddard G, Chapman J, Shoenfeld Y, 2015. Neuropsychiatric lupus: a mosaic of clinical presentations. BMC Med. 13, 1–11. [DOI] [PMC free article] [PubMed] [Google Scholar]
- Lie E, Li Y, Kim R, Kim E, 2018. SALM/Lrfn Family Synaptic Adhesion Molecules. Front. Mol, Neurosci, p. 11. [DOI] [PMC free article] [PubMed] [Google Scholar]
- Lisnevskaia L, Murphy G, Isenberg D, 2014. Systemic lupus erythematosus. Lancet 384 (9957), 1878–1888. [DOI] [PubMed] [Google Scholar]
- Marcinkiewcz CA, Mazzone CM, D’Agostino G, Halladay LR, Hardaway JA, DiBerto JF, Navarro M, Burnham N, Cristiano C, Dorrier CE, Tipton GJ, Ramakrishnan C, Kozicz T, Deisseroth K, Thiele TE, McElligott ZA, Holmes A, Heisler LK, Kash TL, 2016. Serotonin engages an anxiety and fear-promoting circuit in the extended amygdala. Nature 537 (7618), 97–101. [DOI] [PMC free article] [PubMed] [Google Scholar]
- Mederos S, González-Arias C, Perea G, 2018. Astrocyte-neuron networks: a multilane highway of signaling for homeostatic brain function. Front. Synaptic Neurosci. 10, 45. [DOI] [PMC free article] [PubMed] [Google Scholar]
- Miao Z, Deng K, Wang X, and Zhang X (2018). DEsingle for detecting three types of differential expression in single-cell RNA-seq data. Bioinformatics 34, 3223–3224. [DOI] [PubMed] [Google Scholar]
- Michaelis KA, Norgard MA, Levasseur PR, Olson B, Burfeind KG, Buenafe AC, Zhu X, Jeng S, McWeeney SK, Marks DL, 2019. Persistent Toll-like receptor 7 stimulation induces behavioral and molecular innate immune tolerance. Brain. Behav. Immun 82, 338–353. [DOI] [PMC free article] [PubMed] [Google Scholar]
- Moffitt JR, Bambah-Mukku D, Eichhorn SW, Vaughn E, Shekhar K, Perez JD, Rubinstein ND, Hao J, Regev A, Dulac C, Zhuang X, 2018. Molecular, spatial, and functional single-cell profiling of the hypothalamic preoptic region. Science 362 (6416). [DOI] [PMC free article] [PubMed] [Google Scholar]
- Morel L, Blenman KR, Croker BP, Wakeland EK, 2001. The major murine systemic lupus erythematosus susceptibility locus, Sle1, is a cluster of functionally related genes. Proc. Natl. Acad. Sci. U. S. A. 98 (4), 1787–1792. [DOI] [PMC free article] [PubMed] [Google Scholar]
- Moulton VR, Suarez-Fueyo A, Meidan E, Li H, Mizui M, Tsokos GC, 2017. Pathogenesis of human systemic lupus erythematosus: a cellular perspective. Trends Mol. Med. 23 (7), 615–635. [DOI] [PMC free article] [PubMed] [Google Scholar]
- Nehar-Belaid D, Hong S, Marches R, Chen G, Bolisetty M, Baisch J, Walters L, Punaro M, Rossi RJ, Chung C-H, Huynh RP, Singh P, Flynn WF, Tabanor-Gayle J-A, Kuchipudi N, Mejias A, Collet MA, Lucido AL, Palucka K, Robson P, Lakshminarayanan S, Ramilo O, Wright T, Pascual V, Banchereau JF, 2020. Mapping systemic lupus erythematosus heterogeneity at the single-cell level. Nat. Immunol. 21 (9), 1094–1106. [DOI] [PMC free article] [PubMed] [Google Scholar]
- Oke V, Gunnarsson I, Dorschner J, Eketjäll S, Zickert A, Niewold TB, Svenungsson E, 2019. High levels of circulating interferons type I, type II and type III associate with distinct clinical features of active systemic lupus erythematosus. Arthritis Res. Ther. 21, 1–11. [DOI] [PMC free article] [PubMed] [Google Scholar]
- Pablo JL, Wang C, Presby MM, Pitt GS, 2016. Polarized localization of voltage-gated Na + channels is regulated by concerted FGF13 and FGF14 action. Proc. Natl. Acad. Sci. 113, E2665–E2674. [DOI] [PMC free article] [PubMed] [Google Scholar]
- Palla G, Spitzer H, Klein M, Fischer D, Schaar AC, Kuemmerle LB, Rybakov S, Ibarra IL, Holmberg O, Virshup I, et al. , 2021. Squidpy: a scalable framework for spatial single cell analysis. BioRxiv, 2021.02.19.431994. [DOI] [PMC free article] [PubMed] [Google Scholar]
- Pan W, Banks WA, Kastin AJ, 1997. Permeability of the blood-brain and blood-spinal cord barriers to interferons. J. Neuroimmunol. 76 (1–2), 105–111. [DOI] [PubMed] [Google Scholar]
- Phipson B, Zappia L, Oshlack A, 2017. Gene length and detection bias in single cell RNA sequencing protocols. F1000Research 6, 595. [DOI] [PMC free article] [PubMed] [Google Scholar]
- Raudvere U, Kolberg L, Kuzmin I, Arak T, Adler P, Peterson H, and Vilo J (2019). g:Profiler: a web server for functional enrichment analysis and conversions of gene lists (2019 update). Nucleic Acids Res. 47, W191–W198. [DOI] [PMC free article] [PubMed] [Google Scholar]
- Reyes-Vazquez C, Prieto-Gomez B, Dafny N, 1982. Novel effects of interferon on the brain: microiontophoretic application and single cell recording in the rat. Neurosci. Lett. 34 (2), 201–206. [DOI] [PubMed] [Google Scholar]
- Rodero MP, Decalf J, Bondet V, Hunt D, Rice GI, Werneke S, McGlasson SL, Alyanakian M-A, Bader-Meunier B, Barnerias C, Bellon N, Belot A, Bodemer C, Briggs TA, Desguerre I, Frémond M-L, Hully M, van den Maagdenberg AMJM, Melki I, Meyts I, Musset L, Pelzer N, Quartier P, Terwindt GM, Wardlaw J, Wiseman S, Rieux-Laucat F, Rose Y, Neven B, Hertel C, Hayday A, Albert ML, Rozenberg F, Crow YJ, Duffy D, 2017. Detection of interferon alpha protein reveals differential levels and cellular sources in disease. J. Exp. Med. 214 (5), 1547–1555. [DOI] [PMC free article] [PubMed] [Google Scholar]
- Roy ER, Zheng H, and Cao W (2020). Type I interferon response drives neuroinflammation and synapse loss in Alzheimer disease. J Clin Invest 130, 1912–1930. [DOI] [PMC free article] [PubMed] [Google Scholar]
- Rusinova I, Forster S, Yu S, Kannan A, Masse M, Cumming H, Chapman R, Hertzog PJ, 2013. INTERFEROME v2.0: An updated database of annotated interferon-regulated genes. Nucleic Acids Res. 41, 1040–1046. [DOI] [PMC free article] [PubMed] [Google Scholar]
- Schaefer M, Engelbrechta MA, Gut O, Fiebich BL, Bauer J, Schmidt F, Grunze H, Lieb K, 2002. Interferon alpha (IFNα) and psychiatric syndromes: a review. Prog. Neuro-Psychopharmacology Biol. Psychiatry 26, 731–746. [DOI] [PubMed] [Google Scholar]
- Schreiber G, Piehler J, 2015. The molecular basis for functional plasticity in type I interferon signaling. Trends Immunol. 36 (3), 139–149. [DOI] [PubMed] [Google Scholar]
- Schroeder MK, Liu B, Hinshaw RG, Park M-A, Wang S, Dubey S, Liu GG, Shi Q, Holton P, Reiser V, Jones PA, Trigg W, Di Carli MF, Caldarone BJ, Williams JP, O’Banion MK, Lemere CA, 2021. Long-term sex-and genotype-specific effects of 56Fe irradiation on wild-type and APPswe/PS1dE9 transgenic mice. Int. J. Mol. Sci. 22 (24), 13305. [DOI] [PMC free article] [PubMed] [Google Scholar]
- Schwartz N, Stock AD, Putterman C, 2019. Neuropsychiatric lupus: new mechanistic insights and future treatment directions. Nat. Rev. Rheumatol. 15 (3), 137–152. [DOI] [PMC free article] [PubMed] [Google Scholar]
- Scofield RH, Bruner GR, Namjou B, Kimberly RP, Ramsey-Goldman R, Petri M, Reveille JD, Alarcón GS, Vilá LM, Reid J, Harris B, Li S, Kelly JA, Harley JB, 2008. Klinefelter’s syndrome (47, XXY) in male systemic lupus erythematosus patients: support for the notion of a gene-dose effect from the X chromosome. Arthritis Rheum. 58 (8), 2511–2517. [DOI] [PMC free article] [PubMed] [Google Scholar]
- Seiler S, Tønnessen E, 2009. Intervals, thresholds, and long slow distance : the role of intensity and duration in endurance training. Sportscience 13. [Google Scholar]
- Shaw AE, Hughes J, Gu Q, Behdenna A, Singer JB, Dennis T, Orton RJ, Varela M, Gifford RJ, Wilson SJ, Palmarini M, Malik H, 2017. Fundamental properties of the mammalian innate immune system revealed by multispecies comparison of type I interferon responses. PLoS Biol. 15 (12), e2004086. [DOI] [PMC free article] [PubMed] [Google Scholar]
- Shiozawa S, Kuroki Y, Kim M, Hirohata S, Ogino T, 1992. Interferon alpha in lupus psychosis. Arthritis Rheum. 35 (4), 417–422. [DOI] [PubMed] [Google Scholar]
- Stuart T, Butler A, Hoffman P, Hafemeister C, Papalexi E, Mauck WM, Hao Y, Stoeckius M, Smibert P, Satija R, 2019. Comprehensive Integration of Single-Cell Data. Cell 177 (7), 1888–1902.e21. [DOI] [PMC free article] [PubMed] [Google Scholar]
- Subramanian S, Tus K, Li Q-Z, Wang A, Tian X-H, Zhou J, Liang C, Bartov G, McDaniel LD, Zhou XJ, Schultz RA, Wakeland EK, 2006. A Tlr7 translocation accelerates systemic autoimmunity in murine lupus. Proc. Natl. Acad. Sci. U. S. A. 103 (26), 9970–9975. [DOI] [PMC free article] [PubMed] [Google Scholar]
- Südhof TC, 2017. Synaptic neurexin complexes: a molecular code for the logic of neural circuits. Cell 171 (4), 745–769. [DOI] [PMC free article] [PubMed] [Google Scholar]
- Tsokos GC, 2011. Systemic lupus erythematosus. N. Engl. J. Med. 365 (22), 2110–2121. [DOI] [PubMed] [Google Scholar]
- Uematsu S, Akira S, 2007. Toll-like receptors and type I interferons. J. Biol. Chem. 282 (21), 15319–15323. [DOI] [PubMed] [Google Scholar]
- Valentine AD, Meyers CA, 2005. Neurobehavioral effects of interferon therapy. Curr. Psychiatry Rep. 7 (5), 391–395. [DOI] [PubMed] [Google Scholar]
- van Deijk A-L, Camargo N, Timmerman J, Heistek T, Brouwers JF, Mogavero F, Mansvelder HD, Smit AB, Verheijen MHG, 2017. Astrocyte lipid metabolism is critical for synapse development and function in vivo. Glia 65 (4), 670–682. [DOI] [PubMed] [Google Scholar]
- Varley JA, Andersson M, Grant E, Berretta A, Zandi MS, Bondet V, Duffy D, Hunt D, Piehl F, Waters P, Irani SR, 2020. Absence of neuronal autoantibodies in neuropsychiatric systemic lupus erythematosus. Ann. Neurol. 88 (6), 1244–1250. [DOI] [PubMed] [Google Scholar]
- Venkatraman A, Edlow BL, Immordino-Yang MH, 2017. The brainstem in emotion: a review. Front. Neuroanat. 11, 1–12. [DOI] [PMC free article] [PubMed] [Google Scholar]
- Wang W, Xu L, Brandsma JH, Wang Y, Hakim MS, Zhou X, Yin Y, Fuhler GM, Van Der Laan LJW, Van Der Woude CJ, et al. , 2016. Convergent transcription of interferon-stimulated genes by TNF-α and IFN-α augments antiviral activity against HCV and HEV. Sci. Rep. 6, 1–14. [DOI] [PMC free article] [PubMed] [Google Scholar]
- Wolf FA, Angerer P, Theis FJ, 2018. SCANPY: large-scale single-cell gene expression data analysis. Genome Biol. 19, 15. [DOI] [PMC free article] [PubMed] [Google Scholar]
- Yilmaz M, Yalcin E, Presumey J, Aw E, Ma M, Whelan CW, Stevens B, McCarroll SA, Carroll MC, 2021. Overexpression of schizophrenia susceptibility factor human complement C4A promotes excessive synaptic loss and behavioral changes in mice. Nat. Neurosci. 24 (2), 214–224. [DOI] [PMC free article] [PubMed] [Google Scholar]
- Zhang L, Fu T, Yin R, Zhang Q, Shen B, 2017. Prevalence of depression and anxiety in systemic lupus erythematosus: a systematic review and meta-analysis. BMC Psychiatry 17, 70. [DOI] [PMC free article] [PubMed] [Google Scholar]
- Zhuang H, Szeto C, Han S, Yang L, Reeves WH, 2015. Animal models of interferon signature positive lupus. Front. Immunol. 6, 6–11. [DOI] [PMC free article] [PubMed] [Google Scholar]
Associated Data
This section collects any data citations, data availability statements, or supplementary materials included in this article.
Supplementary Materials
Data Availability Statement
Data will be made available on request.