

Abstract

Activated carbon-supported CuO catalysts were prepared by an ammonia evaporation method and applied to catalyze the selective oxidation of glycerol to lactic acid. The effects of CuO loadings on the structure and catalytic performance of the catalyst were investigated. Results showed that CuO could be dispersed uniformly on the surface of activated carbon, promoting the increase of the reaction rate and accelerating the glycerol conversion significantly. As CuO loadings increased, the rate of glycerol consumption and yield to lactic acid was increased. However, too high CuO loadings would destroy the original pore structure of activated carbon and aggravate the agglomeration of CuO, resulting in a decrease in the catalytic performance of the catalyst. The best catalytic performance was obtained over 10% CuO/AC when the reaction temperature was 190 °C and the reaction time was 5 h. At this point, the selectivity to lactic acid reached 92.61%. In addition, power-function type reaction kinetic equations were used to evaluate the effect of glycerol and NaOH concentrations and the reaction temperature on the oxidation of glycerol to lactic acid over 10% CuO/AC. The activation energy of the reaction is 134.39 kJ·mol–1, which is higher than that using single CuO as the catalyst. This indicates that CuO/AC is more temperature-sensitive than CuO and can probably achieve a higher lactic acid yield at high temperatures. At the same time, it is indicated that CuO supported on activated carbon can enhance the catalytic activity of CuO effectively.
1. Introduction
In the field of renewable energy utilization, biodiesel has broad development prospects and has received widespread attention.1−3 During the production process of biodiesel, a large amount of byproduct glycerol is inevitably generated, with 10 kg of glycerol produced for every 100 kg of biodiesel.4−7 The continuous large-scale production of biodiesel has directly led to a decrease in glycerol market prices. However, glycerol can be used as an inexpensive raw material to produce high-value-added chemicals, such as lactic acid (LA), dihydroxyacetone (DHA), acrylic acid, 1,2-propanediol, etc.8−13
Among them, lactic acid as the most important raw material can be applied to the production of biobased chemicals,14−16 which have a wide range of applications in food, pharmaceuticals, cosmetics, etc.17−19 So far, lactic acid is mainly produced by traditional fermentation routes, which have a low yield and high cost. The production of lactic acid through chemical catalysis has become another alternative and promising pathway. In 2005, Kishida20 reported that the highest yield of 90% to lactic acid was obtained by homogeneous catalysis of glycerol in a strongly alkaline aqueous solution (NaOH) at 300 °C under hydrothermal conditions for the first time. The realization of the large-scale production of lactic acid by chemical synthesis to replace the traditional fermentation process is full of possibilities.
The most critical technology for catalyzing glycerol to produce lactic acid is the catalyst. In the past decade, the catalysts used for glycerol oxidation to produce lactic acid were mainly focused on noble metals, such as Pt, Pd, Au, Ir, Ru, etc.,21−29 and the lactic acid yields were close to 60% in most studies. However, by considering the cost of noble metals, some researchers began to apply non-noble metals in the conversion of glycerol to lactic acid, among which copper-based catalysts showed the best catalytic performance.30 It is reported that oxide phases (CuO and Cu2O) are more efficient than metallic copper for the glycerol conversion.31,32 In addition, the catalytic performance of CuO is superior to that of Cu2O under the same reaction conditions.31
Some researchers have supported CuO onto carriers to further improve the catalytic activity of the catalysts. Commonly used carriers include SiO2 and metal oxides. When the copper oxide is supported onto SiO2 and Al2O3, high lactic acid selectivity is obtained (78–80%), and the glycerol conversions are 75 and 98%, respectively.32 Due to the strong alkalinity of the reaction system, the conventional carrier SiO2 and metal oxide Al2O3 are not stable enough for long-term reactions. When using metal oxides as carriers, CuO/CeO2 catalysts demonstrated excellent properties with a conversion of 87% and a yield of 64.38% to lactic acid (8 h, 220 °C, under a N2 atmosphere).33 The CuO/ZrO2 catalysts with 30% CuO loadings exhibited 67.5% glycerol conversion and 85% lactic acid yield (1.4 MPa of N2, 160 °C, 6 h).34 In addition, metal oxide carriers also have the problems of multiple side reactions and high cost.35 Compared to other carriers, carbon materials are considered the most commercially valuable carriers because of their stable physicochemical properties and low price. Among carbon carriers, activated carbon (AC) is popular due to its large specific surface area and excellent structural stability.
Activated carbon-supported copper oxide (CuO/AC) catalysts have exhibited a superior oxidation performance compared to CuO in tail gas treatment.36−38 Moreover, CuO supported onto activated carbon is beneficial for increasing the number of active sites in the catalyst and providing oxygen vacancies to accelerate the formation of free radicals.37 Compared with CuO, the cyclic stability of CuO/AC is significantly improved due to the excellent performance of AC and its special function as a good support material for the surface bonding of CuO.39 The surface of the CuO/AC catalyst has a higher charge transfer rate than unsupported CuO. To the best of our knowledge, CuO/AC catalysts have not been used for the hydrothermal conversion of glycerol to lactic acid.
At present, the main methods for loading CuO onto carriers are impregnation and hydrothermal and deposition precipitation.40−42 Compared to the above methods, ammonia evaporation provides higher metal utilization. Moreover, the active ingredient can be formed with high stability and is uniformly dispersed with a smaller particle size.
In this work, activated carbon-supported copper oxide (CuO/AC) composites with different loadings were synthesized by the ammonia evaporation method and used to catalyze the conversion of glycerol to lactic acid. The dispersion state of CuO species at different loadings was analyzed by X-ray diffraction (XRD), scanning electron microscoy (SEM), and transmission electron microscopy (TEM) characterizations. The effects of reaction parameters, such as time, temperature, and the NaOH/glycerol molar ratio, on the catalytic performance of CuO/AC were investigated in detail. In addition, the reaction rate changes of CuO/AC with different CuO loadings were compared by plotting a quasi-first-order rate model. The effect of different reaction conditions on glycerol conversion was evaluated by using a power-function type reaction kinetics equation to calculate the reaction orders and activation energy.
2. Experimental Section
2.1. Catalyst Preparation
CuO/AC catalysts were synthesized by an ammonia evaporation method. A certain amount of Cu(NO3)2·3H2O was dissolved in 78 mL of deionized water under stirring at 60 °C. Ammonia aqueous solution (25–28%) was then added dropwise until the pH value of the solution reached 8. Five gram of activated carbon was dispersed in the above copper precursor solution, which was stirred for 4 h and then heated up to 90 °C to allow for the evaporation of ammonia and the deposition of copper species onto activated carbon. The evaporation was stopped after the pH of the suspension was decreased to 7. The mixture was filtered and washed three times with deionized water. The obtained solid was dried overnight at 100 °C and calcined at 250 °C for 4 h under a N2 atmosphere. Samples are denoted by X CuO/AC, where X indicates the CuO loading (Table 1).
Table 1. Catalyst Naming, CuO Loadings, and Textural Properties of Catalysts.
| CuO loadings (wt %) | |||||
|---|---|---|---|---|---|
| sample | Cu(NO3)2·3H2O addition amount (g) | theoretical valuea | actual valueb | SBET (m2·g–1) | pore radius (nm) |
| AC | 924 | 3.76 | |||
| 5% CuO/AC | 0.9438 | 5.85 | 5.78 | 894 | 3.76 |
| 10% CuO/AC | 1.8875 | 11.05 | 11.12 | 836 | 3.66 |
| 15% CuO/AC | 2.8313 | 15.72 | 16.27 | 404 | 2.69 |
| 20% CuO/AC | 3.7750 | 19.91 | 19.65 | 343 | 2.33 |
Calculated by the loading formula: loading (wt %) = mass ofactive component/(mass of active component + mass of carrier).
Measured by ICP-OES.
2.2. Characterization
The CuO loadings in X CuO/AC composites were determined using an inductively coupled plasma optical emission spectrometer (ICP-OES, Thermo ICAP PRO). For analysis, composites were dissolved in a mixture of perchloric acid and nitric acid. N2 physisorption analyses were performed using an Autosorb-IQ gas adsorption analyzer (Beijing Builder, China) at 77 K. The samples were degassed at 150 °C for 3 h under vacuum before the measurement. Specific surface areas were obtained using the multipoint Barrett–Emmett–Teller (BET) method. The pore-size distribution was determined by the Barrett–Joyner–Halenda (BJH) method from the desorption branches of the adsorption isotherms. Powder X-ray diffraction (XRD) measurement of the samples was conducted on a Shimadzu-7000 X-ray generator with Cu Kα (λ = 0.1541 nm) radiation. The X-ray intensity was measured over a 2θ diffraction angle from 10 to 55°. The morphologies and microstructures were observed by scanning electron microscopy (SEM, Gemini 300-71-31) and transmission electron microscopy (TEM, JEM-2100 PLUS). The TEM specimens were prepared by placing a drop of CuO/AC anhydrous ethanol suspension onto a coated molybdenum grid. The particle size distributions of the CuO nanoparticles on the activated carbon support were measured from the SEM images by counting at least 100 individual particles. The average particle sizes of the CuO nanoparticles on the activated carbon support were calculated by a weighted-average method according to the individual particle sizes of all of the counted particles.
2.3. Catalytic Test
The oxidation of glycerol to lactic acid was carried out in a 100 mL autoclave reactor (NSG100-P5-T3-SS1-SV-R, Anhui Kemi Machinery Technology Co., Ltd., Hefei, China). Typically, 15 g of 20 wt % (mass fraction) glycerol aqueous solution, NaOH, and 0.6 g of the catalyst were added into the vessel and reacted in an air atmosphere at a temperature range of 150–210 °C. The self-generated pressure of the system during the reaction process was 1.5–2 MPa. After the reaction was completed, the system was centrifuged to separate the catalyst and then 1 M dilute sulfuric acid was added until the solution achieved a pH value of 2. Two times the solution volume of ethanol was added to the acidified solution in order to remove inorganic salts from the sample. Then, the products were analyzed using an Agilent 1200 high-performance liquid chromatograph (HPLC) with a refractive index detector (RID) and a C18 column. The mobile phase was a mixture of acetonitrile/water (v/v) = 1:4 at a flow rate of 1 mL·min–1. The glycerol conversion, selectivity, and yield of lactic acid were calculated according to eqs 1–3:
| 1 |
| 2 |
| 3 |
where XGly is the glycerol conversion, nfeed is the initial molar amount of glycerol, and nremained is the remaining molar amount of glycerol after the reaction; nproduct is the molar amount of the product, and Sproduct and Yproduct represent the selectivity and yield of the product, respectively.
3. Results and Discussion
3.1. Characterization
The actual loadings of CuO in the CuO/AC catalysts were analyzed by ICP-OES and the results are shown in Table 1. It is shown that the actual CuO loadings were in good agreement with the theoretical values and that the error at the maximum between the theoretical loadings and the actual loadings of the CuO/AC catalyst was 3.38%. The specific surface area and pore size of CuO/AC are shown in Table 1. At low loadings (5–10%), the specific surface area of CuO/AC and the pore size are very close to the original specific surface area of activated carbon. At the highest 20% loadings, the specific surface area of CuO/AC is only 343 m2·g–1, which is only 37.1% of the original specific surface area of activated carbon. The results showed that CuO did not affect the original pore structure of activated carbon under low CuO loadings (5–10%). When the loadings were increased, the CuO particles assembled and blocked some of the pores of activated carbon, resulting in a decrease of the specific surface area. The N2 adsorption–desorption isotherms of CuO/AC catalysts with different loadings are shown in Figure S1. All of the isotherms are type IV with H2 hysteresis loops. The saturated adsorption plateau of the CuO/AC catalysts gradually decreased with increasing loadings, which indicated that the adsorption capacity of the catalysts decreased and the micropore volume decreased with increasing CuO loadings. The hysteresis loop decreased at 15–20% CuO loadings, which indicated a decrease in the internal pore size.
The XRD patterns of CuO/AC catalysts with different loadings are shown in Figure 1. The XRD pattern of activated carbon displays two broad diffraction peaks of (002) and (101) (2θ = 24.16 and 43.64°, respectively) corresponding to the characteristic reflections of the crystalline graphite-like structure.43−45 Meanwhile, the characteristic diffraction peaks of CuO (2θ = 32.496, 35.495, and 38.730°) prove that CuO has been supported on activated carbon. The 5 and 10% CuO/AC catalysts do not show significant diffraction peaks of CuO in the XRD patterns, probably due to the poor crystallinity of CuO at the low loadings.46 The crystallite sizes of CuO are estimated by Scherrer’s equation. Results show that the crystallite sizes of CuO increased from 11.22 ± 0.11 to 12.47 ± 0.15 nm when the loadings increased from 5 to 20%. It is also indicated that loaded CuO in the catalysts was all in the nanoscale.
Figure 1.

XRD patterns of CuO/AC catalysts with different loadings.
SEM images of CuO/AC catalysts with different loadings are listed in Figure 2. Pure activated carbon shows a fragmented morphology of a few micrometers to tens of micrometers, which remains after the deposition of CuO. Dense packed clusters of the CuO nanosphere with different diameters are formed on the surface and pores of activated carbon. As shown in Figure 2a,b, nanosized CuO particles are attached to the surface of bulk activated carbon at low loadings (5–10%), whereas serious clustering of CuO appeared with the increase of loadings. In addition, with the increase of CuO loadings, the CuO particles become larger, while the agglomeration phenomenon is more serious (Figure 2c,d). With the CuO loadings increasing to 15–20%, the surface support skeleton of activated carbon is corroded during deposition and new bores are formed due to the increase of Cu2+ ions.47 Through the creation of new surface bores, the activated carbon pores are clogged with larger CuO nanoparticles, leading to a decrease in the specific surface area at high CuO loadings.
Figure 2.

SEM images of CuO/AC catalysts: (a) 5% CuO/AC, (b) 10% CuO/AC, (c) 15% CuO/AC, and (d) 20% CuO/AC.
EDS spectroscopy was used to determine the elemental composition and contents of samples. The EDS spectra of four CuO/AC composites with different loadings shown in Figures S2–S5 indicate the presence of C, O, and Cu elements in all samples. Based on the elemental ratios of Cu and O in the EDS spectra, it is concluded that the copper species existed in the form of CuO. At the same time, the weight percentages of CuO in the samples increased with increasing loadings.
Figure 3 shows the TEM, high-resolution transmission electron microscopy (HRTEM), and elemental mapping images of the CuO/AC catalysts. The average particle sizes of CuO particles in 5, 10, 15, and 20% CuO/AC catalysts were 29.726, 37.417, 37.999, and 42.949 nm, and the corresponding particle size distributions were 19.764–43.564, 25.636–56.236, 25.195–60.395, and 29.646–66.746 nm, respectively. It is apparent that the average particle sizes of CuO nanoparticles increased with the increase of CuO loadings.
Figure 3.

(I) TEM and HRTEM images and (II, III) elemental mapping analysis of CuO/AC catalysts with different loadings: (a) 5% CuO/AC, (b) 10% CuO/AC, (c) 15% CuO/AC, and (d) 20% CuO/AC.
For 5% CuO/AC, no visible CuO particles were observed (Figure 3a) due to the low CuO loading. Nevertheless, the results of elemental mapping show that the copper element is uniformly distributed on the surface of activated carbon (Figure 3a, II and III). With the increase of CuO loadings, irregularly shaped CuO is present in the layers as well as on the surface of activated carbon (Figure 3b–d). All of the changes in the size and shape of the CuO particles were caused probably by the increased CuO loadings on activated carbon and localized changes of the CuO contents, which could influence the growth process of CuO in samples. Based on the results of elemental mapping images (Figure 3b, II and III), it is illustrated that CuO particles in the 5% CuO/AC sample still maintain a relatively well-dispersed state, but a small portion of regional aggregation has occurred. For samples with high CuO loadings (15 and 20% CuO/AC), severe aggregation is clearly observable (Figure 3c,d). Therefore, at high CuO loadings, there are large CuO-enriched regions on the surface of activated carbon, and the aggregations are aggravated.
3.2. Catalytic Performance
The results of the catalytic performance are summarized in Table 2. Adding only activated carbon had almost no activity in the conversion of glycerol to lactic acid. Single CuO exhibited a high glycerol conversion of 97.75% but a low selectivity of 56.89% to lactic acid. As expected, a significant enhancement of 18.39–28.37% in selectivity to lactic acid was observed over 5–15% CuO/AC at the same amount of catalysts, whereas there has been a varying degree (11.64–23.67%) of decrease in glycerol conversion, mainly attributed to the decrease in the absolute amount of CuO. Unexpectedly, 20% CuO/AC shows the lowest glycerol conversion and selectivity to lactic acid, probably due to the occurrence of serious clustering of CuO particles under too high CuO loadings as well as the less CuO absolute amount. About 70% yield to lactic acid was obtained via 10% CuO/AC and 15% CuO/AC catalysts, 15% higher than that of single CuO, indicating that CuO supported on activated carbon with a larger specific surface area would enhance its catalytic performance.
Table 2. Catalytic Performance Results of CuO/AC Catalystsa.
| catalyst | XGly (%) | Slactic acid (%) | Ylactic acid (%) | C balance (%) |
|---|---|---|---|---|
| AC | 57.23 | 13.37 | 7.65 | 51.20 |
| CuO | 97.75 | 56.89 | 55.61 | 57.86 |
| 5% CuO/AC | 74.08 | 75.28 | 55.77 | 81.69 |
| 10% CuO/AC | 86.11 | 81.56 | 70.23 | 84.12 |
| 15% CuO/AC | 84.79 | 82.26 | 69.75 | 84.96 |
| 20% CuO/AC | 64.18 | 26.30 | 16.88 | 67.70 |
Reaction conditions: 20 wt % glycerol aqueous solution, glycerol/NaOH molar ratio of 1:1, catalyst amount of 0.6 g, reaction temperature of 200 °C, and reaction time of 5 h.
Figure 4 shows the glycerol conversion, reaction rate profiles, and yields to lactic acid over CuO/AC catalysts at different reaction times at 200 °C. As shown in Figure 4a, with the extension of the reaction time from 2 to 7 h, all CuO/AC catalysts exhibited a continuous increase in glycerol conversion. The highest conversion of 93.11% was obtained after 7 h of reaction on the 10% CuO/AC catalyst. The reaction rate profiles represented in Figure 4a show that 15% CuO/AC possessed the fastest glycerol consumption rate before 5 h, and the 10% CuO/AC catalyst had the maximum value after 5 h. Figure 4b shows that the yields to lactic acid increased sharply with a reaction time from 2 to 5 h. The maximum yield of 70.23% to lactic acid was obtained with 10% CuO/AC for 5 h. As the reaction time continued to extend, the yield to lactic acid showed a significant downward trend.
Figure 4.

Effect of the reaction time on the performance of CuO/AC catalysts at 200 °C: (a) glycerol conversion and reaction rate profiles and (b) the yield to lactic acid.
Figure 5 demonstrates the relationship between ln(1 – X) (glycerol conversion is X) and the reaction time. The straight lines with different slopes are obtained, and all of them have good linear regression coefficients. This is commonly used to test the first-order rate law for batch reactors, which shows that the rate of glycerol consumption has a first-order relationship with glycerol concentration.48 As shown in Figure 5, all straight lines do not pass through zero, probably due to the reacted amount of glycerol before the reactor reached 200 °C (retimed after the temperature reached 200 °C). Among these, 10% CuO/AC shows the largest reaction rate constant of 0.4043 h–1, while 20% CuO/AC shows the smallest.
Figure 5.

Quasi-first-order kinetic models obtained using CuO/AC catalysts with different loadings. The reaction conditions are the same as those in Figure 4.
Based on the highest yield to lactic acid and the reaction rate, as well as the maximum reaction rate constant obtained at 5 h, the following experiments were carried out using the 10% CuO/AC catalyst. The glycerol conversion, selectivity, and yield to lactic acid of 10% CuO/AC at different reaction temperatures are shown in Figure 6. When the reaction temperature was increased from 150 to 210 °C, the glycerol conversion increased from 65.41 to 84.95%. The selectivity to lactic acid increased from 7.34 to 92.61% first and then gradually decreased to 40%. The results show that the reaction temperature had a significant effect on the conversion of glycerol to lactic acid, and the suitable reaction temperature range was 190–200 °C. As the temperature increases, the reaction rate increases, leading to an increase in the glycerol conversion rate. After reaching the maximum value of 73.85% at 190 °C, the yield to lactic acid decreased with an increase in temperature, which was attributed to the increase in by-reactions and the further oxidation of lactic acid.
Figure 6.

Effect of the reaction temperature on the performance of the 10% CuO/AC catalyst.
Figure 7 shows the effect of the molar ratio of glycerol/NaOH on the catalytic performance over the 10% CuO/AC catalyst at 190 °C for 5 h. First, the glycerol conversion was only 11.73% without adding NaOH into the reaction system, and no lactic acid was detected in the product. With the molar ratio of glycerol/NaOH increasing from 1:0.5 to 1:1.5, the glycerol conversion increased from 28.3 to 91.08%. Meanwhile, the selectivity to lactic acid decreased from 92.61 to 50%. It is indicated that a higher NaOH concentration is beneficial to the conversion of glycerol, but at the same time, it intensifies the further oxidation of lactic acid. It is documented that the presence of NaOH has a positive effect on glycerol protonation; thus, the increase in the molar ratio of glycerol/NaOH promotes the conversion of glycerol. It is also reported that a low concentration of NaOH was more effective in obtaining high glycerol conversions due to the relative solubility in water,49 and excess NaOH leads to the decomposition of the product into carbonates in an air atmosphere.50
Figure 7.
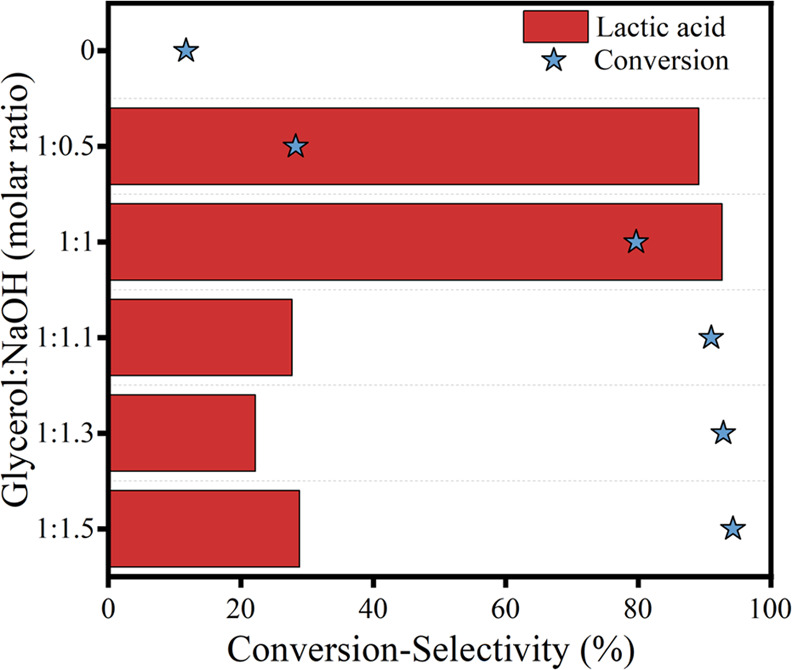
Effect of the molar ratio of glycerol/NaOH on the catalytic performance over the 10% CuO/AC catalyst.
3.3. Reaction Kinetics Model
Considering the best catalytic activity for the hydrothermal conversion of glycerol to lactic acid, 10% CuO/AC was selected as the catalyst model to investigate the reaction kinetics.
To determine the parametrization of reaction kinetics, several experiments were carried out to determine the reaction time and the effect of stirring speed. Raising the autoclave temperature to the prescribed reaction temperature from room temperature needed ca. 0.75 h without stirring. The experiments showed that glycerol was almost not converted during the period of increasing the reaction temperature to 190 °C without stirring (Table S1). Furthermore, when the reactions were carried out at 500 and 800 rpm for 1 h, the glycerol conversions were close to each other (Table S1), indicating that the diffusion effect was eliminated at 500 rpm.51,52
A power-function type reaction kinetic equation (eq 4) was used to investigate the effect of reaction parameters, such as glycerol concentrations, NaOH concentrations, and the reaction temperature on the glycerol consumption rate over 10% CuO/AC catalysts.
| 4 |
where −rA is the rate of glycerol consumption, mol·gcat–1·h–1; mcat is the amount of catalyst, g; nA is the mole number of glycerol, mol; t is the reaction time, h; CA and CB are the concentrations of glycerol and NaOH, respectively, mol·L–1; and a and b are the number of reaction orders of glycerol and NaOH, respectively.
The reaction rate constant k follows the Arrhenius equation in eq 5:
| 5 |
where k is the rate constant; A is the pre-exponential (frequency) factor; R is the ideal gas constant 8.314 × 10⁻³ kJ·mol–1·K–1; Ea is the activation energy of the reaction, kJ·mol–1; and T is the reaction temperature, K.
Equations 6 and 7 are obtained by taking the natural logarithm of the left and right sides of eqs 4 and 5, respectively.
| 6 |
| 7 |
Equation 7 is substituted with eq 6 to obtain eq 8.
| 8 |
To calculate the reaction orders of a and b according to the equation, the initial conversion of glycerol was calculated based on the data shown in Figure S6a,b, which show the variation of glycerol conversion with the reaction time at 190 °C under different initial concentrations of glycerol and NaOH. The plots of glycerol conversion versus the reaction time were linear at low glycerol conversions. The initial conversion rates of glycerol at different initial concentrations of glycerol and NaOH were calculated at the first hour at 190 °C (Table 3). By the multiple linear regression method, the reaction orders a and b were calculated to be 0.37 and 0.87, respectively, and the reaction rate constant was 0.0243 mol1–(a+b)·gcat(a+b)–1·h–1 with a good regression coefficient of 0.9663. The reaction rate constants and reaction steps for glycerol and NaOH are listed in Table 3.
Table 3. Reaction Rate Constant and Reaction Orders over the 10% CuO/AC Catalysta.
| glycerol (mol·L–1) | NaOH (mol·L–1) | glycerol conversion (%) | reaction rate (mol·gcat–1·h–1) | kb | a | b | R2 |
|---|---|---|---|---|---|---|---|
| 1 | 1 | 38.09 | 0.0248 | 0.0243 | 0.37 ± 0.07 | 0.87 ± 0.08 | 0.9663 |
| 0.5 | 1 | 61.55 | 0.0201 | ||||
| 1.5 | 1 | 30.61 | 0.0299 | ||||
| 2 | 1 | 24.99 | 0.0326 | ||||
| 1 | 0.5 | 18.7 | 0.0122 | ||||
| 1 | 1.5 | 50.88 | 0.0332 | ||||
| 1 | 2 | 64.08 | 0.0418 |
Experimental conditions: glycerol aqueous solution, 30 mL; catalyst loading, 0.46 g; reaction time, 1 h; and reaction temperature, 190 °C.
Reaction rate constant k, mol1–(a+b)·gcat(a+b)–1·h–1.
The conversion of glycerol at different reaction temperatures for different reaction time periods was calculated (Figure S6c). The values of the reaction rate constant at different temperatures were calculated according to eq 4. According to eq 7, the pre-exponential factor A and the reaction activation energy Ea were obtained by the linear regression method with a good regression coefficient of 0.9823. The values of k, A, and Ea are listed in Table 4.
Table 4. Rate Constant, Frequency Factor, and Activation Energy of the 10% CuO/AC Catalyst.
| temperature (°C) | glycerol conversion (%) | kic | Ad | Ea (kJ·mol–1) | R2 |
|---|---|---|---|---|---|
| 160a | 2.61 | 0.0017 | 2.82 × 10¹³ | 134.39 | 0.9823 |
| 170a | 6.35 | 0.0041 | |||
| 180a | 12.76 | 0.0083 | |||
| 190b | 38.09 | 0.0248 | |||
| 200a | 54.69 | 0.0357 |
Experimental conditions: glycerol aqueous solution, 30 mL; glycerol concentration, 1 mol·L–1; NaOH concentration, 1 mol·L–1; catalyst loading, 0.46 g; and reaction time, 1 h.
Reaction rate constant k at different temperatures, mol1–(a+b)·gcat(a+b)–1·h–1.
Pre-exponential factor A, mol1-(a+b)·gcat(a+b)–1·h–1.
All of the experimental data gave good regression coefficients and were well simulated by using eqs 6 and 7. Combined with this, eq 8 showed that the power-function type kinetic model was appropriate for assessing the effect of glycerol concentration, NaOH concentration, and the reaction temperature on the hydrothermal conversion of glycerol. The overall reaction kinetics was expressed as follows:
| 9 |
4. Conclusions
CuO/AC catalysts with different loadings were prepared by ammonia evaporation. The CuO particles loaded on the surface of activated carbon ranged from uniformly dispersed at low loadings to aggregated clusters at high loadings, and the size of the CuO particles became larger with increasing loadings. As-prepared CuO/AC exhibited an excellent catalytic performance for the selective oxidation of glycerol to lactic acid under alkaline conditions. Moreover, the CuO loadings showed significant effects on the glycerol conversion and selectivity of lactic acid. With excessively high loading, CuO particles blocked the pores of activated carbon and agglomerated significantly, which decreased the reaction rate constant and had a disadvantage on the conversion of glycerol. At 10% loading of CuO, the glycerol conversion was 79.75% and the selectivity to lactic acid was up to 92.61%. A power-function type reaction kinetic model well fitted the experimental data, −rA = A exp(−134.39/RT) Cglycerol0.37CNaOH0.87. The reaction activation energy was 134.39 kJ·mol–1.
Acknowledgments
The authors gratefully acknowledge the Shenyang Young and Middle-Aged Science and Technology Innovation Talent Support Program, China (no. RC210184), the Basic Research Projects of Liaoning Provincial Department of Education, China (no. JYTMS20231497), the LiaoNing Revitalization Talents Program (no. XLYC2002001), and the Applied Basic Research Programs of Liaoning Province (no. 2023JH2/101300243).
Supporting Information Available
The Supporting Information is available free of charge at https://pubs.acs.org/doi/10.1021/acsomega.3c08845.
Glycerol conversion over the 10% CuO/AC catalyst at different stirring speeds (Table S1); N2 adsorption–desorption isotherm of CuO/AC catalysts (Figure S1); EDS spectrum of CuO/AC catalysts with different loadings (Figure S2–S5); and glycerol conversion over 10% CuO/AC catalyst under different initial conditions (Figure S6) (PDF)
The authors declare no competing financial interest.
Supplementary Material
References
- Wang H.; Zhou H.; Yan Q.; Wu X.; Zhang H. Superparamagnetic nanospheres with efficient bifunctional acidic sites enable sustainable production of biodiesel from budget non-edible oils. Energy Convers. Manage. 2023, 297 (1), 117758 10.1016/j.enconman.2023.117758. [DOI] [Google Scholar]
- He L.; Chen L.; Zheng B.; Zhou H.; Wang H.; Li H.; Zhang H.; Xu C. C.; Yang S. Deep eutectic solvents for catalytic biodiesel production from liquid biomass and upgrading of solid biomass into 5-hydroxymethylfurfural. Green Chem. 2023, 25 (19), 7410–7440. 10.1039/D3GC02816J. [DOI] [Google Scholar]
- Chen L.; He L.; Zheng B.; Wei G.; Li H.; Zhang H.; Yang S. Bifunctional acid-activated montmorillonite catalyzed biodiesel production from non-food oil: Characterization, optimization, kinetic and thermodynamic studies. Fuel Process. Technol. 2023, 250, 107903 10.1016/j.fuproc.2023.107903. [DOI] [Google Scholar]
- Anitha M.; Kamarudin S.; Kofli N. The potential of glycerol as a value-added commodity. Chem. Eng. J. 2016, 295, 119–130. 10.1016/j.cej.2016.03.012. [DOI] [Google Scholar]
- Quispe C. A.; Coronado C. J.; Carvalho J. A. Jr Glycerol: Production, consumption, prices, characterization and new trends in combustion. Renewable Sustainable Energy Rev. 2013, 27, 475–493. 10.1016/j.rser.2013.06.017. [DOI] [Google Scholar]
- Yurdakul M.; Ayas N.; Bizkarra K.; El Doukkali M.; Cambra J. F. Preparation of Ni-based catalysts to produce hydrogen from glycerol by steam reforming process. Int. J. Hydrogen Energy 2016, 41 (19), 8084–8091. 10.1016/j.ijhydene.2015.11.178. [DOI] [Google Scholar]
- Tan H.; Aziz A. A.; Aroua M. Glycerol production and its applications as a raw material: A review. Renewable Sustainable Energy Rev. 2013, 27, 118–127. 10.1016/j.rser.2013.06.035. [DOI] [Google Scholar]
- Arcanjo M. R. A.; Silva I. J. Jr; Rodríguez-Castellón E.; Infantes-Molina A.; Vieira R. S. Conversion of glycerol into lactic acid using Pd or Pt supported on carbon as catalyst. Catal. Today 2017, 279, 317–326. 10.1016/j.cattod.2016.02.015. [DOI] [Google Scholar]
- Gupta N.; Khavryuchenko O.; Villa A.; Su D. Metal-Free Oxidation of Glycerol over Nitrogen-Containing Carbon Nanotubes. ChemSusChem 2017, 10 (15), 3030–3034. 10.1002/cssc.201700940. [DOI] [PubMed] [Google Scholar]
- Jiang Z.; Zhang Z.; Wu T.; Zhang P.; Song J.; Xie C.; Han B. Efficient Generation of Lactic Acid from Glycerol over a Ru-Zn-CuI/Hydroxyapatite Catalyst. Chem. - Asian J. 2017, 12 (13), 1598–1604. 10.1002/asia.201700412. [DOI] [PubMed] [Google Scholar]
- Ainembabazi D.; Wang K.; Finn M.; Ridenour J.; Voutchkova-Kostal A. Efficient transfer hydrogenation of carbonate salts from glycerol using water-soluble iridium N-heterocyclic carbene catalysts. Green Chem. 2020, 22 (18), 6093–6104. 10.1039/D0GC01958E. [DOI] [Google Scholar]
- Fu C. P.; She Q. M.; Tesser R.; Zhou C. H. Cleaner one-pot transformation of glycerol to acrylic acid and 1, 2-propanediol over bifunctional Cu2O/montmorillonite catalysts without external oxygen and hydrogen. Catal.: Sci. Technol. 2022, 12 (21), 6495–6506. 10.1039/D1CY02359D. [DOI] [Google Scholar]
- Mohan K.; Pai S. D. K. R.; Reghunath B. S.; Pinheiro D. Unveiling Cutting Edge Innovations in the Catalytic Valorization of Biodiesel Byproduct Glycerol into Value Added Products. ChemistrySelect 2023, 8 (25), e202204501 10.1002/slct.202204501. [DOI] [Google Scholar]
- Dusselier M.; Van Wouwe P.; Dewaele A.; Makshina E.; Sels B. F. Lactic acid as a platform chemical in the biobased economy: the role of chemocatalysis. Energy Environ. Sci. 2013, 6 (5), 1415–1442. 10.1039/c3ee00069a. [DOI] [Google Scholar]
- Auneau F.; Arani L. S.; Besson M.; Djakovitch L.; Michel C.; Delbecq F.; Sautet P.; Pinel C. Heterogeneous transformation of glycerol to lactic acid. Top. Catal. 2012, 55, 474–479. 10.1007/s11244-012-9823-1. [DOI] [Google Scholar]
- Pereira C. S. M.; Silva V. M.; Rodrigues A. E. Ethyl lactate as a solvent: Properties, applications and production processes-a review. Green Chem. 2011, 13 (10), 2658–2671. 10.1039/c1gc15523g. [DOI] [Google Scholar]
- Mäki-Arvela P.; Simakova I. L.; Salmi T.; Murzin D. Y. Production of lactic acid/lactates from biomass and their catalytic transformations to commodities. Chem. Rev. 2014, 114 (3), 1909–1971. 10.1021/cr400203v. [DOI] [PubMed] [Google Scholar]
- Rodrigues C.; Vandenberghe L.; Woiciechowski A.; de Oliveira J.; Letti L.; Soccol C.. Production and Application of Lactic Acid. In Current Developments in Biotechnology and Bioengineering; Ashok Pandey S. N.; Soccol C. S., Eds.; Elsevier, 2017; pp 543–556. [Google Scholar]
- Razali N.; Abdullah A. Z. Production of lactic acid from glycerol via chemical conversion using solid catalyst: A review. Appl. Catal., A 2017, 543, 234–246. 10.1016/j.apcata.2017.07.002. [DOI] [Google Scholar]
- Kishida H.; Jin F.; Zhou Z.; Moriya T.; Enomoto H. Conversion of glycerin into lactic acid by alkaline hydrothermal reaction. Chem. Lett. 2005, 34 (11), 1560–1561. 10.1246/cl.2005.1560. [DOI] [Google Scholar]
- Evans C. D.; Douthwaite M.; Carter J. H.; Pattisson S.; Kondrat S. A.; Bethell D.; Knight D. W.; Taylor S. H.; Hutchings G. J. Enhancing the understanding of the glycerol to lactic acid reaction mechanism over AuPt/TiO2 under alkaline conditions. J. Chem. Phys. 2020, 152 (13), 134705 10.1063/1.5128595. [DOI] [PubMed] [Google Scholar]
- Maris E. P.; Davis R. J. Hydrogenolysis of glycerol over carbon-supported Ru and Pt catalysts. J. Catal. 2007, 249 (2), 328–337. 10.1016/j.jcat.2007.05.008. [DOI] [Google Scholar]
- Dutta M.; Das K.; Prathapa S. J.; Srivastava H. K.; Kumar A. Selective and high yield transformation of glycerol to lactic acid using NNN pincer ruthenium catalysts. Chem. Commun. 2020, 56 (68), 9886–9889. 10.1039/D0CC02884C. [DOI] [PubMed] [Google Scholar]
- Chen S.; Xu S.; Ge C.; Hu C. Mechanistic Investigations of the Synthesis of Lactic Acid from Glycerol Catalyzed by an Iridium-NHC Complex. Processes 2022, 10, 626 10.3390/pr10040626. [DOI] [Google Scholar]
- Sever B.; Yildiz M. Conversion of glycerol to lactic acid over Au/bentonite catalysts in alkaline solution. React. Kinet., Mech. Catal. 2020, 130 (2), 863–874. 10.1007/s11144-020-01805-9. [DOI] [Google Scholar]
- Marques F. L.; Oliveira A. C.; Mendes Filho J.; Rodríguez-Castellón E.; Cavalcante C. L. Jr; Vieira R. S. Synthesis of lactic acid from glycerol using a Pd/C catalyst. Fuel Process. Technol. 2015, 138, 228–235. 10.1016/j.fuproc.2015.05.032. [DOI] [Google Scholar]
- Maris E. P.; Ketchie W. C.; Murayama M.; Davis R. J. Glycerol Hydrogenolysis on Carbon-Supported PtRu and AuRu Bimetallic Catalysts. J. Catal. 2007, 251 (2), 281–294. 10.1016/j.jcat.2007.08.007. [DOI] [Google Scholar]
- Pemmana H. R.; Barnwal P. K.; Uppaluri R. V.; Peela N. R. Selective aerobic-oxidation of glycerol to lactic acid over ruthenium-vanadium bimetallic catalysts. J. Ind. Eng. Chem. 2023, 124 (25), 224–231. 10.1016/j.jiec.2023.04.010. [DOI] [Google Scholar]
- Ke Y.-H.; Qin H.-Y.; Wang X.; Li H.; Liu H.; Yuan H. Facile conversion of glycerol to 1, 3-dihydroxyacetone by using mesoporous CuO–SnO2 composite oxide supported Au catalysts. J. Porous Mater. 2023, 30 (3), 723–737. 10.1007/s10934-022-01373-4. [DOI] [Google Scholar]
- Tang C.; Li S.; Li S.; Wang Y.; He M.; Huang M.; Yu S. The Structure–Activity Relationship of CuO in the Catalytic Conversion Reaction of Glycerol to Lactic Acid. Catalysts 2023, 13 (8), 1218 10.3390/catal13081218. [DOI] [Google Scholar]
- Li K.-T.; Li H.-H. Glycerol conversion to lactic acid with unsupported copper salts and bulk cupric oxide in aqueous alkali media. Appl. Biochem. Biotechnol. 2020, 191 (4), 125–134. 10.1007/s12010-020-03237-6. [DOI] [PubMed] [Google Scholar]
- Roy D.; Subramaniam B.; Chaudhari R. V. J. A. C. Cu-Based Catalysts Show Low Temperature Activity for Glycerol Conversion to Lactic Acid. ACS Catal. 2011, 1 (5), 548–551. 10.1021/cs200080j. [DOI] [Google Scholar]
- Palacio R.; Torres S.; Royer S.; Mamede A. S.; López D.; Hernández D. CuO/CeO2 catalysts for glycerol selective conversion to lactic acid. Dalton Trans. 2018, 47 (13), 4572–4582. 10.1039/C7DT04340F. [DOI] [PubMed] [Google Scholar]
- Yang G. Y.; Ke Y. H.; Ren H. F.; Liu C. L.; Yang R. Z.; Dong W. S. The conversion of glycerol to lactic acid catalyzed by ZrO2-supported CuO catalysts. Chem. Eng. J. 2016, 283, 759–767. 10.1016/j.cej.2015.08.027. [DOI] [Google Scholar]
- Yin H.; Zhang C.; Yin H.; Gao D.; Shen L.; Wang A. Hydrothermal conversion of glycerol to lactic acid catalyzed by Cu/hydroxyapatite, Cu/MgO, and Cu/ZrO2 and reaction kinetics. Chem. Eng. J. 2016, 288 (15), 332–343. 10.1016/j.cej.2015.12.010. [DOI] [Google Scholar]
- Le T. K. T.; Kongparakul S.; Zhang H.; Zhao J.; Guan G.; Chanlek N.; Tran T. T. V.; Samart C. Highly efficient liquid-phase oxidation of 5-hydroxymethylfurfural over Co-Cu/activated carbon catalysts. Mol. Catal. 2023, 539 (15), 113017 10.1016/j.mcat.2023.113017. [DOI] [Google Scholar]
- Chen X.; Chen Z.; Sun X.; Tian J.; Wang Y.; Pan T.; Hu X.; Zhang X.; Gu H. Enhancing Ozone Oxidation of Reverse Osmosis Concentrate Using Activated Carbon-Supported Cu–Co–Mn Catalysts. Catal. Lett. 2023, 153 (5), 1359–1371. 10.1007/s10562-022-04064-6. [DOI] [Google Scholar]
- Xu Z.; Li Y.; Lin Y.; Wang Y.; Wang Q.; Zhu T. Loading mechanism and double-site reaction mechanism of Cu on activated carbon for enhanced oxidation of CO from flue gas. Chem. Eng. J. 2021, 419, 129994 10.1016/j.cej.2021.129994. [DOI] [Google Scholar]
- Sham Lal M.; Lavanya T.; Ramaprabhu S. An efficient electrode material for high performance solid-state hybrid supercapacitors based on a Cu/CuO/porous carbon nanofiber/TiO2 hybrid composite. Beilstein J. Nanotechnol. 2019, 10 (1), 781–793. 10.3762/bjnano.10.78. [DOI] [PMC free article] [PubMed] [Google Scholar]
- Sawadsitang S.; Duangchuen T.; Karaphun A.; Putjuso T.; Kumnorkaew P.; Swatsitang E. J. S. Interfaces, Synthesis, characterization and electrochemical properties of activated coconut fiber carbon (ACFC) and CuO/ACFC nanocomposites for applying as electrodes of supercapacitor devices. Surf. Interfaces 2021, 25, 101174 10.1016/j.surfin.2021.101174. [DOI] [Google Scholar]
- Wang W. G.; Bai C.; Zhang L. CuO/graphene oxide composite as a highly active catalyst for one-step amination of benzene to aniline. Catal. Commun. 2019, 125, 1–5. 10.1016/j.catcom.2019.03.016. [DOI] [Google Scholar]
- Zhang C.; Wang T.; Liu X.; Ding Y. Cu-promoted Pt/activated carbon catalyst for glycerol oxidation to lactic acid. J. Mol. Catal. A: Chem. 2016, 424, 91–97. 10.1016/j.molcata.2016.08.018. [DOI] [Google Scholar]
- Dandekar A.; Baker R.; Vannice M. Characterization of activated carbon, graphitized carbon fibers and synthetic diamond powder using TPD and DRIFTS. Carbon 1998, 36 (12), 1821–1831. 10.1016/S0008-6223(98)00154-7. [DOI] [Google Scholar]
- Islam M. S.; Ang B. C.; Gharehkhani S.; Afifi A. B. M. Adsorption capability of activated carbon synthesized from coconut shell. Carbon Lett. 2016, 20 (1), 1–9. 10.5714/CL.2016.20.001. [DOI] [Google Scholar]
- Raj K. G.; Joy P. A. Coconut shell based activated carbon–iron oxide magnetic nanocomposite for fast and efficient removal of oil spills. J. Environ. Chem. Eng. 2015, 3 (3), 2068–2075. [Google Scholar]
- He C.; Cao L.; Liu X.; Fu W.; Zhao J. Catalytic behavior and synergistic effect of nonthermal plasma and CuO/AC catalyst for benzene destruction. Int. J. Environ. Sci. Technol. 2015, 12 (11), 3531–3540. 10.1007/s13762-015-0765-6. [DOI] [Google Scholar]
- Wang W.; Yao H.; Yue L. Supported-catalyst CuO/AC with reduced cost and enhanced activity for the degradation of heavy oil refinery wastewater by catalytic ozonation process. Environ. Sci. Pollut. Res. 2020, 27 (7), 7199–7210. 10.1007/s11356-019-07410-1. [DOI] [PubMed] [Google Scholar]
- Li K. T.; Li J. Y.; Li H. H. Conversion of glycerol to lactic acid over Cu–Zn–Al and Cu–Cr catalysts in alkaline solution. J. Taiwan Inst. Chem. Eng. 2017, 79, 74–79. 10.1016/j.jtice.2017.03.029. [DOI] [Google Scholar]
- Shen L.; Yu Z.; Zhang D.; Yin H.; Wang C.; Wang A. Glycerol valorization to lactic acid catalyzed by hydroxyapatite-supported palladium particles. J. Chem. Technol. Biotechnol. 2019, 94 (1), 204–215. 10.1002/jctb.5765. [DOI] [Google Scholar]
- Ramírez-López C. A.; Ochoa-Gómez J. R.; Fernández-Santos M.; Gómez-Jiménez-Aberasturi O.; Alonso-Vicario A.; Torrecilla-Soria J. Synthesis of lactic acid by alkaline hydrothermal conversion of glycerol at high glycerol concentration. Ind. Eng. Chem. Res. 2010, 49 (14), 6270–6278. 10.1021/ie1001586. [DOI] [Google Scholar]
- Feng Y.; Yin H.; Wang A.; Gao D.; Zhu X.; Shen L.; Meng M. Selective oxidation of 1, 2-propanediol to lactic acid catalyzed by nanosized Mg(OH)2-supported bimetallic Au–Pd catalysts. Appl. Catal., A 2014, 482, 49–60. 10.1016/j.apcata.2014.05.022. [DOI] [Google Scholar]
- Yin H.; Yin H.; Wang A.; Shen L. Catalytic conversion of glycerol to lactic acid over graphite-supported nickel nanoparticles and reaction kinetics. J. Ind. Eng. Chem. 2018, 57, 226–235. 10.1016/j.jiec.2017.08.028. [DOI] [Google Scholar]
Associated Data
This section collects any data citations, data availability statements, or supplementary materials included in this article.