Abstract
Various miniature Clark-type oxygen electrodes (COEs), which are typically used to measure dissolved oxygen (DO) concentration in cellular respiration, have been developed since the 1980s. Arrays with individually addressable electrodes that constitute the sensor were used for various applications. However, the large number of leads and contact pads required for connecting the electrodes and the external instrument complicate the electrode layout and make the operation of integrated COE arrays challenging. Here, we fabricated closed bipolar electrochemical systems comprising 6 × 8 and 4 × 4 arrays of COEs for imaging and multiplexed detection. The cathodic compartment was sealed with a hydrophobic oxygen-permeable membrane to separate the internal electrolyte solution from the sample solutions. Using the bipolar Clark-type oxygen electrode (BCOE) arrays and electrochemiluminescence (ECL), we measured the DO concentration at each cathode. The results revealed that the ECL intensity changed linearly with the DO concentration. In addition, we used ECL imaging to investigate the respiratory activity of Escherichia coli (E. coli) and Pseudomonas aeruginosa (P. aeruginosa) in suspensions with different cell densities. The ECL images showed that the ECL intensity changed noticeably with the bacterial density. The bacterial respiratory activity was then qualitatively analyzed based on the ECL images acquired successively over a time duration. Further, we measured the antibiotic efficacy of piperacillin, oxacillin, gentamicin, and cefmetazole against E. coli and P. aeruginosa using the BCOE. We found that the ECL intensity increased with the antibiotic concentration, thus indicating the suppression of the bacterial respiratory activity.
Introduction
With the recent advances in cell engineering, it is crucial to develop improved methods and systems for monitoring concentration changes of physiologically relevant molecules. One such molecule is oxygen, which is involved in cellular respiration. Electrochemical devices such as Clark-type oxygen electrodes (COEs) were generally used to measure the dissolved oxygen (DO) concentration in cellular respiration. The original COE configuration consists of a cathode to detect oxygen, an anode that serves as both the reference electrode and auxiliary electrode, and an electrolyte solution in a container with a hydrophobic oxygen-permeable membrane that closes the end of the container. Unlike electrochemical oxygen sensing devices without an oxygen-permeable membrane, a COE is impervious to electroactive interferents and unaffected by contamination by molecules such as proteins. Moreover, it is not necessary to add a supporting electrolyte to sample solutions for each measurement.
Miniature devices and devices with arrayed sensing components are increasingly critical for enabling various cell engineering and clinical analysis applications. Miniature sensors are indispensable for obtaining information about the physiological status of cultured animal and microbial cells in solutions of limited volumes. Therefore, various miniature COEs were developed based on microfabrication techniques used for semiconductor chips and microelectromechanical systems (MEMS) since the 1980s.1−10 Arrays with individually addressable electrodes that constitute the sensor were developed for various purposes.11−14 However, in constructing arrays of integrated COEs, there is an issue related to the increase in the number of leads and contact pads for connecting the electrodes and the external instrument.14 The issue is not limited to COEs, as it is common to electrochemical devices in general. A solution to this problem is a matrix configuration in which multiple electrodes with the same function share common leads arranged in rows and columns.15−21 Representative examples are devices for the multiplexed detection of DO that do not comprise an oxygen-permeable membrane. Ino et al. used sensing electrodes connected in a column to detect oxygen and rows of electrodes aimed at eliminating oxygen around unused sensing electrodes, thereby making only a selected sensing site active to detect oxygen.19 Han et al. demonstrated the effectiveness of this approach using a 4 × 6 oxygen electrode array in which the cathodes or anodes share the same leads.21 However, even with this method, the number of integrated oxygen electrodes that can be used is limited. Bipolar electrochemistry provides a solution to overcome this limitation.22−25
Bipolar electrochemistry enables the use of bipolar electrodes (BPEs) electrically isolated from external instruments, thus allowing for the simple integration of multiple probes. Two different setups are used for this purpose. One is an open bipolar system, where the BPEs are placed in a single solution. A potential gradient is generated in the solution, which becomes a motive force to generate redox reactions on both poles of the BPEs. Given that the BPEs cannot be connected to external instruments, electrochemiluminescence (ECL) is often used to visualize changes that occur on the sensing pole. With this setup, oxidation and reduction reactions occur in the same solution, thus limiting the utility of these devices.
In a closed bipolar system, two solutions are used separately for the BPE anodic and cathodic reactions. Ino et al. fabricated a closed bipolar device with BPEs directly exposed to a sample solution, to monitor the respiratory activity of MCF-7 cell aggregates.26 Although a limited number of BPEs (compared with the open bipolar systems) can be integrated into the device, the problem can be overcome using a BPE structure in which the cathodic and anodic poles are connected with a lead.27
The application of bipolar electrochemical devices is not limited to fundamental research in cell engineering. Currently, most clinical tests report results as numerical values, which can lead to the misinterpretation of results in emergencies. Applying this ECL-based approach in point-of-care testing provides significant potential to reduce human error by providing qualitative and quantitative results regarding luminescence intensity. An ECL-based system would be attractive to healthcare professionals because it can be used as a rapid antibiotic resistance test for bacteria.
In this study, we designed a COE array as a closed bipolar electrochemical system and demonstrated its applicability to the assessment of antibiotic efficacy.
Experimental Section
Reagents and Materials
Reagents and materials used for fabrication and characterization of the devices were obtained from the following commercial sources: glass wafers (3-in. diameter, 500-μm thick) from TEMPAX Float (Schott AG, Tokyo, Japan); polyimide prepolymer solution (SP-341, Toray, Tokyo, Japan); a thick-film photoresist (SU-8 25, Kayaku Advanced Materials, Westborough, MA); silicone sheet used as the oxygen-permeable membrane (50-μm thick, Mitsubishi Chemical, Tokyo, Japan); poly(methyl methacrylate) (PMMA) plate (5-mm thick, Sumitomo Chemical, Tokyo, Japan); tris(2,2′-bipyridyl)dichloro-ruthenium(II) hexahydrate (Ru(bpy)3Cl2·6H2O) (Sigma-Aldrich, St. Louis, MO); tris-n-propylamine (TPA), sodium sulfite (Na2SO3), potassium chloride (KCl), tris(hydroxymethyl)aminomethane-HCl (Tris–HCl) buffer solution (Wako Pure Chemical Industries, Osaka, Japan); and Bacto brain heart infusion (BHI) (Becton, Dickinson and Company, Sparks, MD). Piperacillin, oxacillin, gentamicin, and cefmetazole were purchased from Sigma-Aldrich, St. Louis, MO. Deionized Milli-Q water (18.2 MΩ cm, Millipore, Billerica, MA) was used to prepare all solutions.
Structure and Fabrication of the BCOE Array
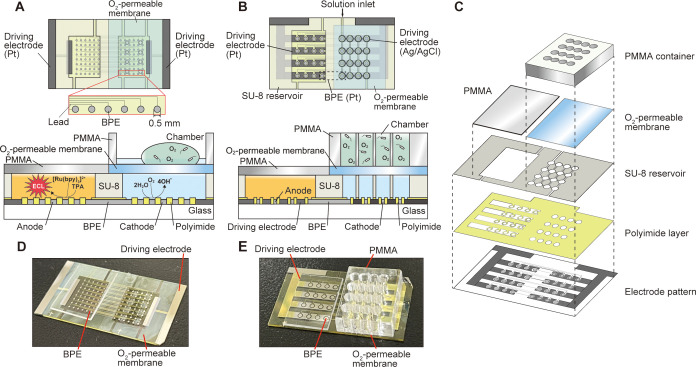
Figure 1 shows the structures and construction of the devices. Here, two types of arrays of COEs were fabricated as closed bipolar systems. One was for imaging DO concentration (type I), and the other was for measuring the DO concentration in separate sample solutions (type II). Details of the fabrication are described in the Supporting Information. Electrodes were formed on a glass substrate by sputtering and lift-off. Platinum (150-nm thick) was used for all electrodes with an intermediate chromium layer (50-nm thick) to promote adhesion. For the type I and II devices, 6 × 8 arrays of 48 circular poles (500-μm diameter) and 4 × 4 arrays of 16 circular poles (1-mm diameter) were formed, respectively, for the reduction of oxygen and the anodic ECL reaction by the Ru(bpy)32+/TPA system. In each BPE, the cathodic and anodic poles were connected with an 80-μm-wide lead (Figure S1). Simple rectangular driving electrodes formed at both ends of the chip were used for the type I device. For the type II device, driving electrodes surrounded the cathodic and anodic poles. A silver layer (200-nm thick) was formed only on the driving electrode area in the cathodic chamber to provide a fixed potential of Ag/AgCl. A 500-nm-thick polyimide insulating layer was then formed to cover the area other than the cathodic and anodic poles and active areas of the driving electrodes. The silver driving electrode of the cathodic pole had a 50-μm-wide slit, and AgCl was grown from there into the silver layer. This structure enabled the rapid growth of AgCl during device operation, thus resulting in the stabilization of the anode potential and a longer lifetime than simple silver anodes without slit structures.28 In the cathodic chamber, circular reservoirs for the electrolyte solution were formed with SU-8 for each cathodic pole. The reservoirs were connected such that the electrolyte solution could be injected into the outlet. A common chamber was shared by all of the anodic poles. A 50-μm-thick silicone sheet was placed onto the reservoir on the cathode side as the oxygen-permeable membrane.
Figure 1.
Bipolar Clark-type oxygen electrode (BCOE) arrays: (A) top view of the electrode substrate (top) and cross section of the completed device (bottom) for imaging (type I); (B) top view of the electrode substrate (top) and cross section of the completed device (bottom) for multiplexed measurement (type II). The dimensions of the devices are 20 × 35 mm2; (C) exploded view of the device shown in panel (B); (D) photograph of the imaging device; (E) photograph of the device for multiplexed measurement with PMMA chambers.
The SU-8 reservoirs for the cathodic poles were filled with a 1.0 M Tris–HCl buffer solution (pH 8.5) containing 1.0 M KCl by placing the cathodic side of the device in the solution in a beaker, placing it in a chamber, and evacuating the chamber. Throughout these steps, the reservoir for the anodes was closed using a PMMA plate. The anodic chamber was then filled with a solution for the ECL reaction, and the compartment was covered using a PMMA plate. The solution contained 5.0 mM Ru(bpy)32+, 25 mM TPA, and 1.0 M KCl prepared with 50 mM phosphate buffer solution (PB, pH 7.4). Finally, a PMMA plate (14 mm × 18 mm × 5 mm) with chambers for sample solutions was placed on top of the cathodic chamber. Sixteen 2-mm diameter through-holes were formed in the PMMA plate to measure bacterial activity using the type II device. The through-holes served to accommodate the bacteria suspensions. The PMMA plate was placed on the oxygen-permeable membrane, thus, aligning the through-holes with the cathodic poles.
Measurement of ECL Intensity Using the BCOE Array
A voltage was applied between the two driving electrodes on the chip in the device using a direct current (DC) power supply (PMX 110–0.6A, Kikusui Electronics, Yokohama, Japan). Electrochemiluminescence (ECL) images were acquired using a charge-coupled device (CCD) camera (VB-7010, Keyence, Osaka, Japan) attached to a fluorescence microscope (Multi-Viewer System VB-S20, Keyence, Osaka, Japan). The ISO sensitivity was set at 1600, and the exposure time was 30 s. The ECL intensities were obtained from the images using ImageJ (NIH). All images were acquired in the dark.
Evaluation of the Performance of the Type II Device
The responses of the COEs of the type II device were examined by recording the change in ECL intensity with respect to the change in DO concentration in pure water from an air-saturated state to a zero-oxygen concentration state. The latter was realized using a saturated Na2SO3 solution. The Na2SO3 solution was injected into two PMMA chambers on the oxygen-permeable membrane, and changes in the ECL intensity were measured. In addition, a drop of 10 mM K3[Fe(CN)6] solution was injected into two PMMA chambers on the oxygen-permeable membrane to determine if the oxygen-permeable membrane blocked electroactive interferents. If the membrane was not appropriately functioning, the ECL intensity would increase owing to the reduction of [Fe(CN)6]3– on the cathodic poles.
The calibration plot was obtained by the following procedure. First, pure water was sufficiently saturated with air in a 200-mL beaker using a magnetic stirrer. A commercial DO meter probe (Fuso, MIC-98719GT) was then immersed in the air-saturated water. The water DO concentration was decreased gradually by adding small amounts of solid Na2SO3 with gentle stirring. The DO concentration during these steps was continuously measured using the DO meter. Three 20-μL samples of the solution were obtained from the surrounding of the oxygen probe and immediately injected into three PMMA chambers until they were completely filled. The chamber was immediately closed using a 5-mm thick PMMA plate to minimize atmospheric oxygen dissolution into the solution. The ECL was recorded by applying a voltage between the driving electrodes. The ECL intensities obtained using ImageJ were corrected by subtracting the average of background values measured at three different points in areas other than the anodic poles. All oxygen electrode measurements were conducted at 25 °C.
Preparation of E. coli and Freeze-Dried E. coli
E. coli strain B (ATCC 11303) was purchased from Sigma-Aldrich and stored in 20% glycerin (1 × 10¹⁰ CFU/mL) at −80 °C. The frozen E. coli-containing solution was thawed before use in several experiments. Freeze-dried E. coli was prepared by the following procedure. A milliliter of E. coli suspension (1 × 10¹⁰ CFU/mL) was washed twice with phosphate-buffered saline (PBS) (5 mL) by centrifugation for 10 min at 1600g and 4 °C. An E. coli precipitate was resuspended in a 1 mL PBS solution containing 5% trehalose. The resulting suspension was rapidly frozen using liquid nitrogen and dried overnight using a freeze-dryer (FreeZone 4.5, Labconco, Kansas City, MO). The freeze-dried E. coli was then stored with a desiccant at 4 °C. Before use, the freeze-dried E. coli was resuspended in PBS to prepare a 1 × 10⁹ CFU/mL suspension. The suspension was further diluted with a nutrient-containing BHI medium to form 1 × 10⁶, 1 × 10⁷, and 1 × 10⁸ CFU/mL solutions.
Preparation of P. aeruginosa
P. aeruginosa (ATCC 27853, Sigma-Aldrich, St. Louis, MO) was stored in 20% glycerin (5 × 10¹¹ CFU/mL) at −80 °C. The frozen solution with P. aeruginosa was thawed before use and then resuspended in PBS to 1 × 10¹¹ CFU/mL. The suspension was further diluted with a BHI medium to form 1 × 10⁸, 1 × 10⁹, and 1 × 10¹⁰ CFU/mL solutions.
Imaging of the Distribution of DO Concentration Using the Type I Device
The device comprising a 6 × 8 cathode-and-anode array was used for imaging the DO concentration distribution. For this step, a mixture of 1% sodium alginate and E. coli suspension with a density of 1 × 10⁸ CFU/mL was prepared, and 20 μL of the mixture was added to a 0.5 M CaCl2 solution to form gel beads. The gels were incubated in a BHI medium for 60 min on a hot plate at 37 °C before use. For control experiments, the gel beads prepared with E. coli suspension were first sterilized in an autoclave before using them for the control measurements. The PMMA chamber on the cathode side of the device was filled with PBS, and the gel beads were placed on the oxygen-permeable membrane within the PMMA chamber, as shown in Figure 2B. Electrochemiluminescence (ECL) measurements were performed by applying 3.4 V between the driving electrodes at 25 °C in the dark.
Figure 2.
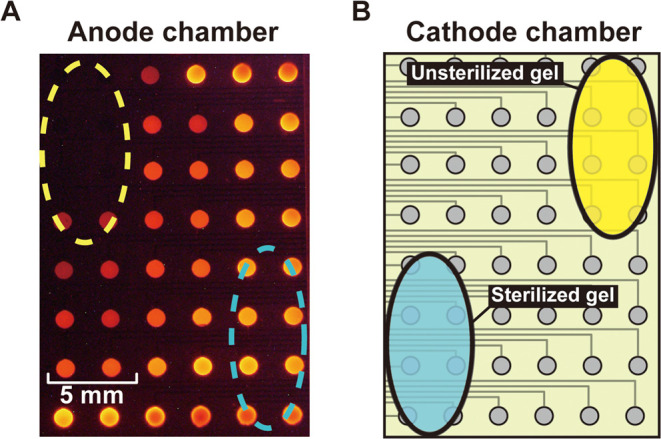
Change in ECL intensity on the 6 × 8 array of anodic poles of the type I device when gel beads containing 1 × 10⁸ CFU/mL E. coli were placed on the yellow and blue areas of the cathode side. The gel on the yellow area contained active E. coli, whereas that on the blue area contained sterilized E. coli. The blue and yellow dashed ovals in panel (A) indicate the corresponding areas on the cathode side (B). The applied voltage was 3.4 V.
Measurement of the Respiratory Activity of Bacteria
To measure the respiratory activity of E. coli and P. aeruginosa, freeze-dried E. coli was resuspended in PBS (pH 7.4) to prepare a 1 × 10⁹ CFU/mL E. coli suspension. The suspension was further diluted to 1 × 10⁶, 1 × 10⁷, and 1 × 10⁸ CFU/mL suspensions with the nutrient-containing BHI medium. Similarly, frozen P. aeruginosa was thawed at room temperature and diluted to 1 × 10¹¹ CFU/mL with PBS. The suspension was further diluted to 1 × 10⁸, 1 × 10⁹, and 1 × 10¹⁰ CFU/mL with the BHI medium. Before the measurements, a 100-mM glucose solution was added to the suspension to activate the E. coli’s respiratory activity. Approximately 20 μL of the solutions were injected into the PMMA chambers on the cathode side. Four chambers in a row were filled with a solution of the same cell density. The open ends of the chambers were closed with polyimide tape to prevent the influx of air into the sample solutions during the measurements.
The driving electrodes of the device were connected to the DC power source, and 2.6 V was applied every 20 min in the dark. The device was stored on a hot plate maintained at 37 °C between measurements. The solution for ECL in the anodic chamber was replaced with a fresh solution before the next experiment.
Evaluation of the Efficacy of Antibiotics
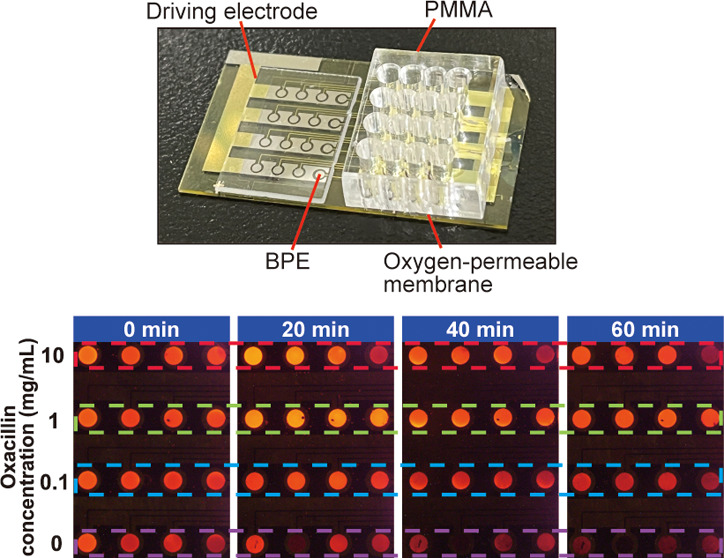
E. coli suspensions (1 × 10⁸ CFU/mL) containing the antibiotic piperacillin or oxacillin of different concentrations (10, 1, 0.1, and 0 mg/mL) were introduced into the PMMA chambers to evaluate the efficacy of the antibiotics against bacteria. In addition, P. aeruginosa suspensions (1 × 10¹⁰ CFU/mL) containing the antibiotic gentamicin or cefmetazole were added to the different concentrations (5, 0.5, 0.05, and 0 mg/mL) and introduced into the PMMA chamber. A row of four chambers on a chip were used for each antibiotic concentration. The experiment was conducted as mentioned in the previous section, and ECL intensities at 0 (I0) and 60 min (I60) were measured by ImageJ using recorded images. The relative ratio of the decrease in ECL intensity was calculated as (I0 – I60)/I0. The minimum effective concentration (MEC) is defined as the minimum concentration over which (I0 – I60)/I0 shows a decrease that is statistically significant. The driving voltage was set at 2.6 V and the bacteria were incubated at 37 °C between the measurements. The same procedure mentioned in the previous section was followed.
Results and Discussion
Imaging of the DO Concentration Distribution
The type I device was used for imaging the DO concentration distribution. Figure 2 shows the ECL observed when sterilized and unsterilized gel beads containing 1 × 10⁸ CFU/mL E. coli were placed on the cathode chamber initially filled with PBS. The corresponding anodes and cathodes were essentially mirror images of each other relative to the wall separating the solutions. The ECL intensity was substantially lower for the E. coli-containing gel beads (see Figure 2, yellow area). This observation indicates that the E. coli’s respiratory activity consumed a significant amount of DO within its vicinity. In contrast, there was only a slight ECL intensity change originating from the blue dashed oval corresponding to the cathode areas onto which sterile gel beads were located. Although we used 6 × 8 anode-and-cathode arrays in this experiment, the imaging resolution can be improved by simply increasing the number of cathodes and anodes. It is important to consider how to minimize the space occupied by the leads without increasing their resistance. This issue can be addressed by using a multilayer structure for the leads.27
Performance of the Type II Device
First, to verify if the oxygen-permeable membrane functioned as expected, a 10 mM K3[Fe(CN)6] solution and pure water were injected into chambers on the oxygen-permeable membrane of the cathode side, the driving voltage was applied, and an ECL image was captured (Figure 3A). If [Fe(CN)6]3– permeates through the membrane and reaches the cathodes of the BPEs, it is reduced there and the ECL intensity should increase. However, no changes in the ECL intensity were observed between the chambers filled with the K3[Fe(CN)6] solution and that with water (Figure 3A(i)). The ECL intensity decreased slightly in the area with pure water, thus indicating that the water layer suppressed oxygen diffusion. These results confirmed that the oxygen-permeable membrane blocked [Fe(CN)6]3– and thus worked as expected.
Figure 3.
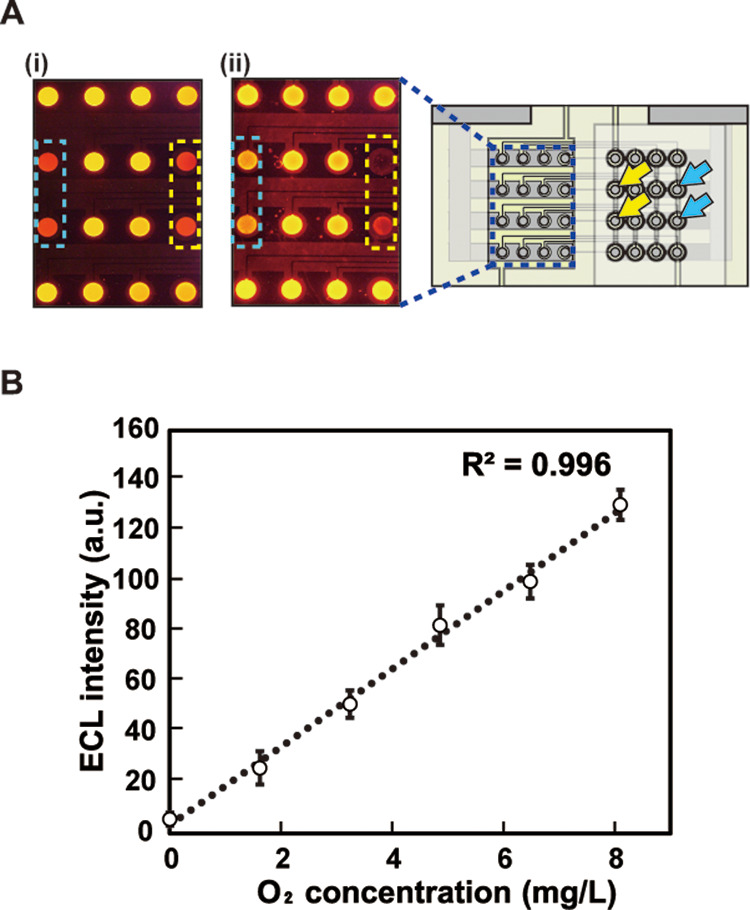
Response of the device: (A) ECL images captured from the anodes (left) and top view of the device (right). The areas surrounded by the blue and yellow dashed rectangles correspond to the cathodes on the right as indicated by the blue and yellow arrows. (i) 10 mM K3[Fe(CN)6] solution and pure water were injected into the chambers as indicated by the yellow and blue dashed lines and (ii) saturated Na2SO3 solution and water were injected into the chambers as indicated by the yellow and blue dashed lines; (B) dependence of ECL intensity on dissolved oxygen concentration. Here, the applied voltage was 2.4 V. The circles and error bars represent the means and standard deviations, respectively (n = 3).
Figure 3A(ii) shows the ECL images obtained when a saturated Na2SO3 solution and pure water were injected into the chambers on the oxygen-permeable membrane of the cathode side. A clear difference in ECL intensity was observed between the two samples. The ECL intensity decreased significantly in the area with the Na2SO3 solution, thus indicating that the DO around the corresponding cathodic poles decreased. Compared with these two areas, no changes in the ECL intensity were observed in the other areas. Figure 3C shows the dependence of ECL intensity on the DO concentration. A linear relationship was observed at DO concentrations of <8.1 mg/L, which corresponds to the saturation point of air.
To provide reliable results, the intensity of ECL from all anodes should ideally be equal under the same condition. To verify this, all PMMA chambers were filled with pure water saturated with air and the ECL was recorded. The relative standard deviation (RSD) of ECL intensities was 3.8% (Figure S2A). Because the RSD of ECL intensities measured under the same condition and in a similar manner using the type I device was 5.7% (Figure S2B), which is slightly larger than that of the type II device, the states of the solutions in the PMMA chambers of the type II device (such as trapping of air bubbles) are not considered to have significant influence. We assume that the surface states of the cathodes and anodes, which are sensitive to the progress of electrode reactions, affect the slight distribution of ECL intensities. Cleaning procedures such as the use of the piranha solution or electrochemical potential cycling were not applicable to the devices because the devices contained silver and the BPEs with the cathodes and anodes could not be connected to an external potentiostat with the current electrode layouts. This will be considered for devices developed in the future.
Measurement of the Respiratory Activity of Bacteria
The respiratory activities of E. coli and P. aeruginosa were measured using the fabricated device. Suspensions of E. coli with different cell densities were injected into the PMMA chambers (Figure 4A), and intensities of ECL from the anodes of the oxygen electrodes were recorded. Figure 4B shows ECL recorded at different times. A decrease in ECL intensity caused by the consumption of DO was observed as time elapsed, and ECL was darker with E. coli of higher densities. The increase in the respiratory activity of E. coli is considered to be caused by the gradual accumulation of intermediate reaction products and activation of the flow of material synthesis from the initial state at which the reaction products were depleted. Alternatively, the increase in the number of E. coli through cell division may be considered. However, it is unlikely within this time range. A similar experiment was conducted using P. aeruginosa suspensions of different densities (Figure 5). As in the case of E. coli, ECL intensity decreased as the density of P. aeruginosa increased (Figure 5B). These results demonstrate that the oxygen electrode can be applied to monitor the bacterial respiratory activity.
Figure 4.
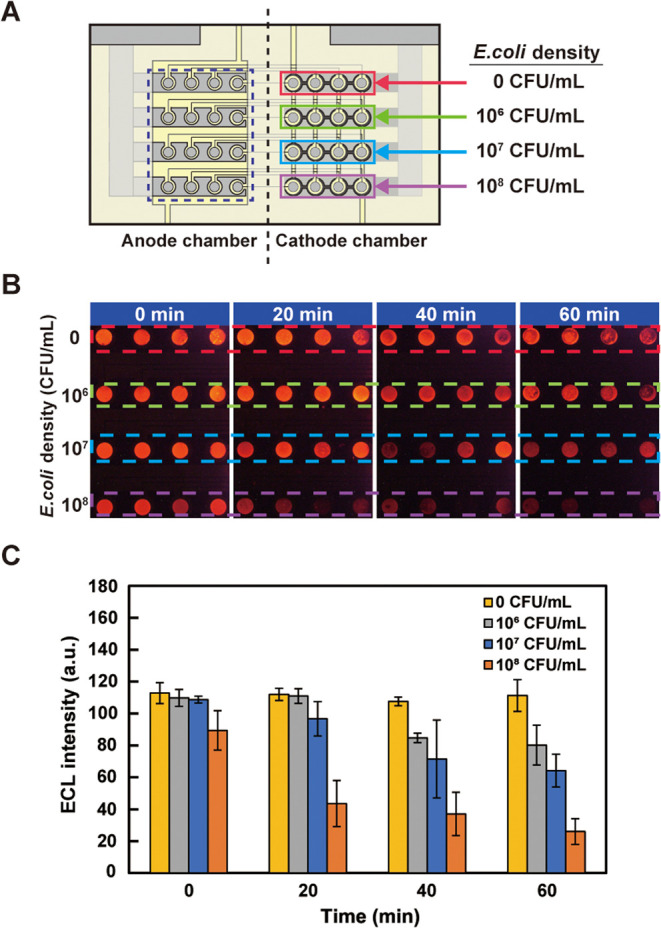
Measurement of the respiratory activity of bacterial cells using the device: (A) top view of the device showing the densities of E. coli in suspension solutions injected into the chambers on the cathode side; (B) ECL observed from the anode area (surrounded by the dashed rectangle in (A)). The parts surrounded by the dashed red, green, blue, and purple lines correspond to the cathode parts of the same colors in panel (A); (C) bar chart summary of the result shown in panel (B). The error bars represent the standard deviations (n = 4).
Figure 5.
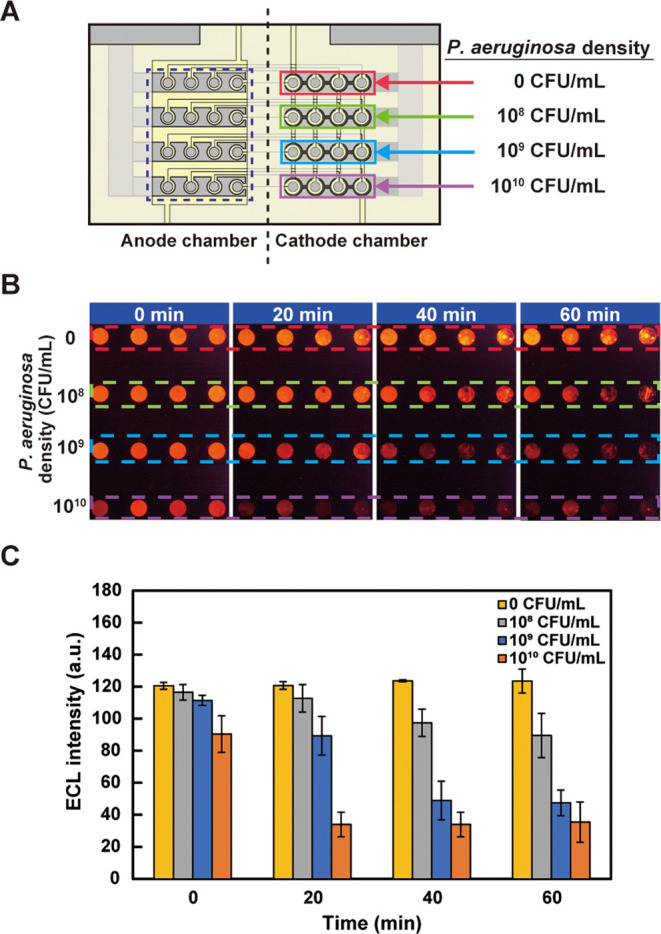
Measurement of the respiratory activity of bacterial cells using the device: (A) top view of the device showing the densities of P. aeruginosa in suspension solutions injected into the chambers on the cathode side; (B) ECL observed from the anode area (surrounded by the dashed rectangle in panel (A)). The parts surrounded by the dashed red, green, blue, and purple lines correspond to the cathode parts of the same colors in panel (A); (C) bar chart summary of the result shown in panel (B). The error bars represent the standard deviations (n = 4).
As regards the experiments shown in Figures 4B and 5B (and Figures 6B,C and 7B,C that appear later), chambers of the same rows were filled with suspension solutions of the same bacterial cell densities. However, the distribution of ECL intensities became slightly larger within the same row as time elapsed. A possible cause is the distribution of the bacterial cells within the PMMA chamber. During the experiments, substantial proportions of the bacterial cells were not suspended uniformly in the solution, as they must precipitate on the oxygen-permeable membrane at the bottom. Because the diameter of the PMMA chamber (2 mm) is larger than that of the cathode (1 mm), it is possible that a proportion of the bacteria in each chamber was above the cathode area and the other was not. Hence, the respiratory activity was detected more sensitively in the former case. This will also be considered when designing devices in the future.
Figure 6.
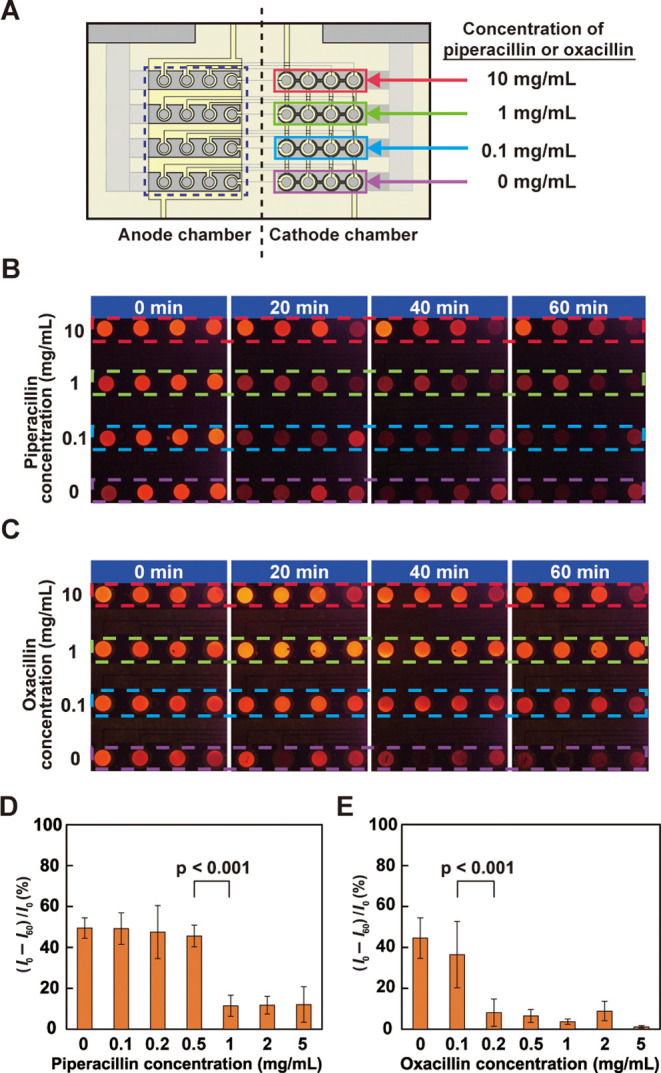
Measurement of the respiratory activity of E. coli in the presence of antibiotics: (A) top view of the device showing the concentration of piperacillin or oxacillin added to the suspension solutions containing 1 × 10⁸ CFU/mL E. coli in the chambers on the cathode side; (B) ECL observed from the anode area (surrounded by the dashed rectangle in (A)) when piperacillin was used; (C) ECL observed from the anode area when oxacillin was used. In panels (B, C), the parts surrounded by the dashed red, green, blue, and purple lines correspond to the parts of the same colors on the cathode side in (A); (D, E) dependence of the relative ratio of the decrease in the ECL intensity calculated as (I0 – I60)/I0 on (D) piperacillin and (E) oxacillin concentrations. The error bars represent the standard deviation (n = 4). The applied voltage for the experiments was 2.6 V.
Figure 7.
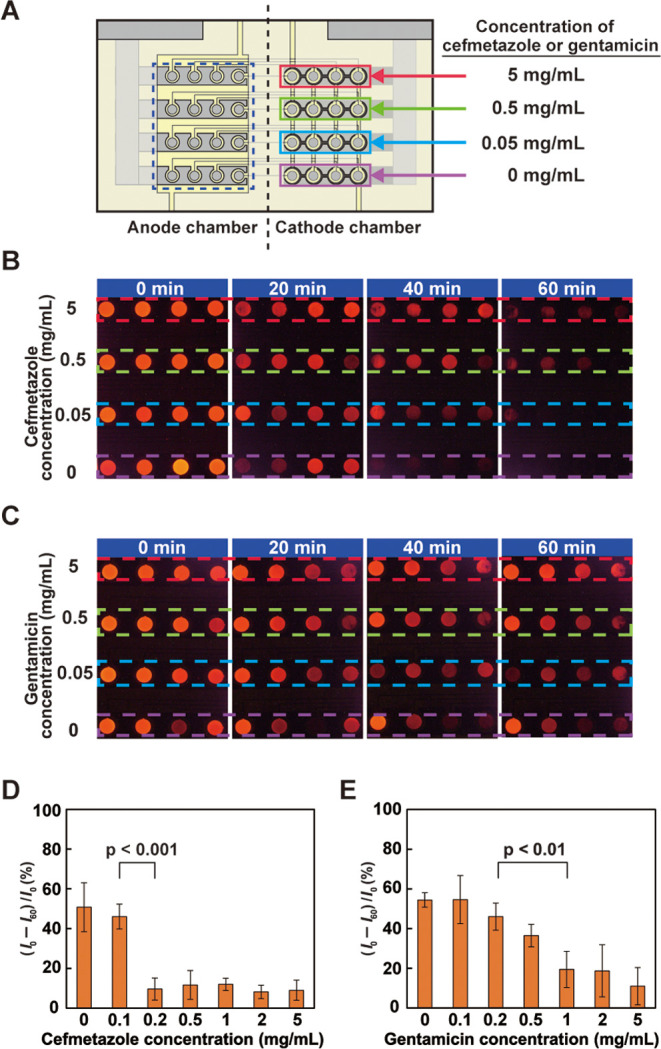
Measurement of the respiratory activity of P. aeruginosa in the presence of antibiotics: (A) top view of the device showing the concentration of gentamicin or cefmetazole added to the suspension solutions containing 1 × 10¹⁰ CFU/mL P. aeruginosa in the chambers on the cathode side; (B) ECL observed from the anode area (surrounded by the dashed rectangle in panel (A)) when cefmetazole was used; (C) ECL observed from the anode area when gentamicin was used. In panels (B, C), the parts surrounded by the dashed red, green, blue, and purple lines correspond to the parts of the same colors on the cathode side in A; (D, E) dependence of the relative ratio of the decrease in the ECL intensity calculated as (I0 – I60)/I0 on (D) cefmetazole and (E) gentamicin concentrations. The error bars represent the standard deviation (n = 4). The applied voltage for the experiments was 2.6 V.
Evaluation of the Efficacy of Antibiotics
If the respiratory activity of bacteria can be measured clearly, the efficacy of antibiotics can be evaluated from the change in the respiratory activity. To verify this hypothesis, we added four different concentrations of each antibiotic, namely, piperacillin and oxacillin, to E. coli suspensions with the same density. We injected the piperacillin solutions into the 16 PMMA chambers (Figure 6A) and measured the E. coli respiratory activity. Figure 6B shows that the ECL intensity increased with higher piperacillin concentrations, thus indicating that the bacterial respiratory activity was suppressed by piperacillin. After 20 min, the ECL intensity decreased distinctly for the 1 and 10 mg/mL piperacillin concentrations compared with the ECL intensity of the control (E. coli suspension without piperacillin) at the start of the measurement. A similar trend was observed when oxacillin was added to the samples (Figure 6C). In this case, however, the ECL intensities of the oxacillin-containing samples after 20 min were higher than those of the piperacillin-containing samples, thus suggesting that oxacillin was more effective against E. coli than piperacillin.
To examine the changes more quantitatively, the experiments were conducted by increasing the number of antibiotic concentrations to be examined and the relative ratio of the decrease in ECL intensity, (I0 – I60)/I0, was compared. The results are shown in Figure 6D,E as bar charts. In both cases, two concentration regions that correspond to higher and lower respiratory activity of E. coli could be distinguished clearly, and a significant change was observed between 0.5 and 1 and 0.1 and 0.2 mg/mL for piperacillin and oxacillin, respectively, suggesting that 1 and 0.2 mg/mL are their MECs as long as the concentrations we measured are concerned.
We conducted the same measurement using P. aeruginosa in the presence of cefmetazole or gentamicin. The results are shown in Figure 7. As with E. coli, the ECL intensity decreased with time but increased at high antibiotic concentrations (Figure 7B,C). The dependence of (I0 – I60)/I0 on the antibiotic concentration is also shown in Figure 7D,E. Cefmetazole exhibited a tendency similar to piperacillin and oxacillin against E. coli, and two concentration regions corresponding to high and low respiratory activities of P. aeruginosa could be distinguished clearly. The MEC was estimated at 0.2 mg/mL. However, for gentamicin, (I0 – I60)/I0 gradually decreased with an increase in its concentration. Nevertheless, the difference between 0.2 and 1 mg/mL was significant. Hence, the MEC was estimated at 1 mg/mL.
In this study, four chambers in a row were used because the ECL observed from all anodes was not uniform under the same condition. The nonuniformity of the ECL may be due to the surface state of the cathode and anode not being the same for all oxygen electrodes due to contamination. Differences in the total activity of the bacteria in the chamber may be another cause of the distribution of the ECL intensities. Furthermore, air bubbles trapped in the chambers and internal solutions negatively influence the output. Although the estimation of the efficacy and determination of the optimum concentration of antibiotics can be achieved with the device, further improvements will be necessary to solve these problems.
Conclusions
We fabricated COEs in the form of a closed bipolar system to facilitate the integration and simultaneous operation of multiple sensing sites for imaging and multiplexed DO concentration measurements. By making the section between the cathode and anode as thin as a lead, we increased the number of integrated cathodes and anodes in the array. Further, although we presented 6 × 8 and 4 × 4 oxygen electrode arrays, using a multilayered array structure could increase the number of integrated oxygen electrodes. Further, because the cathodes for the reduction of oxygen and the internal electrolyte solution are separated from the external sample solution by the oxygen-permeable membrane, any sample solution that may contain electroactive compounds and/or contaminants such as proteins can be placed directly on the sensitive area to measure the DO concentration. We used the BCOE arrays to successfully monitor the respiratory activity of bacteria based on their ECL intensity, which decreased as the respiration activity of the bacteria increased. Moreover, we successfully used the BCOE arrays to evaluate the efficacy of antibiotics against two kinds of bacteria.
Acknowledgments
The authors thank Ms. Miku Konno for her technical assistance. This study was supported by a Grant-in-Aid for Scientific Research (No. 21H01958) under the Japan Society for the Promotion of Science (JSPS).
Supporting Information Available
The Supporting Information is available free of charge at https://pubs.acs.org/doi/10.1021/acsomega.3c09802.
Device fabrication; layout of the electrodes of the type I and type II devices; and ECL observed from the anodes of the type II and type I devices (PDF)
Author Contributions
These authors contributed equally to this work. The manuscript was written through contributions of all authors.
The authors declare no competing financial interest.
Supplementary Material
References
- Suzuki H.; Sugama A.; Kojima N.; Takei F.; Ikegami K. A miniature Clark-type oxygen electrode using a polyelectrolyte and its application as a glucose sensor. Biosens. Bioelectron. 1991, 6, 395–400. 10.1016/0956-5663(91)87003-T. [DOI] [PubMed] [Google Scholar]
- Suzuki H.; Sugama A.; Kojima N. Micromachined Clark oxygen electrode. Sens. Actuators, B 1993, 10, 91–98. 10.1016/0925-4005(93)80031-6. [DOI] [Google Scholar]
- Suzuki H. Disposable Clark oxygen electrode using recycled materials and its application. Sens. Actuators, B 1994, 21, 17–22. 10.1016/0925-4005(93)01207-K. [DOI] [Google Scholar]
- Park J.; Pak Y. K.; Pak J. J. A microfabricated reservoir-type oxygen sensor for measuring the real-time cellular oxygen consumption rate at various conditions. Sens. Actuators, B 2010, 147, 263–269. 10.1016/j.snb.2010.03.069. [DOI] [Google Scholar]
- Wu C.-C.; Luk H.-N.; Lin Y.-T. T.; Yuana C.-Y. A Clark-type oxygen chip for in situ estimation of the respiratory activity of adhering cells. Talanta 2010, 81, 228–234. 10.1016/j.talanta.2009.11.062. [DOI] [PubMed] [Google Scholar]
- Luo J.; Dziubla T.; Eitel R. A low temperature co-fired ceramic based microfluidic Clark-type oxygen sensor for real-time oxygen sensing. Sens. Actuators, B 2017, 240, 392–397. 10.1016/j.snb.2016.08.180. [DOI] [Google Scholar]
- Stine J. M.; Beardslee L. A.; Sathyam R. M.; Bentley W. E.; Ghodssi R. Electrochemical dissolved oxygen sensor-integrated platform for wireless in situ bioprocess monitoring. Sens. Actuators, B 2020, 320, 128381 10.1016/j.snb.2020.128381. [DOI] [Google Scholar]
- Liebisch F.; Weltin A.; Marzioch J.; Urban G. A.; Kieninger J. Zero-consumption Clark-type microsensor for oxygen monitoring in cell culture and organ-on-chip systems. Sens. Actuators, B 2020, 322, 128652 10.1016/j.snb.2020.128652. [DOI] [Google Scholar]
- Hsueh A. J.; Park S.; Satoh T.; Shimizu T.; Koiwai K.; Nakashima M.; Morimoto Y.; Kinoshita M.; Suzuki H. Microdevice with an integrated Clark-type oxygen electrode for the measurement of the respiratory activity of cells. Anal. Chem. 2021, 93, 5577–5585. 10.1021/acs.analchem.1c00227. [DOI] [PubMed] [Google Scholar]
- Suzuki H.; Tamiya E.; Karube I. Fabrication of an oxygen electrode using semiconductor technology. Anal. Chem. 1988, 60, 1078–1080. 10.1021/ac00161a026. [DOI] [Google Scholar]
- Sullivan M. G.; Utomo H.; Fagan P. J.; Ward M. D. Automated electrochemical analysis with combinatorial electrode arrays. Anal. Chem. 1999, 71, 4369–4375. 10.1021/ac990331y. [DOI] [PubMed] [Google Scholar]
- Kojima K.; Hiratsuka A.; Suzuki H.; Yano K.; Ikebukuro K.; Karube I. Electrochemical protein chip with arrayed immunosensors with antibodies immobilized in a plasma-polymerized film. Anal. Chem. 2003, 75, 1116–1122. 10.1021/ac0257391. [DOI] [PubMed] [Google Scholar]
- Abdellaoui S.; Noiriel A.; Henkens R.; Bonaventura C.; Blum L. J.; Doumèche B. A 96-well electrochemical method for the screening of enzymatic activities. Anal. Chem. 2013, 85, 3690–3697. 10.1021/ac303777r. [DOI] [PubMed] [Google Scholar]
- Park J.; Nam H.; Ahn S. Y.; Pak Y. K.; Pak J. J. A reservoir-type oxygen sensor with 2 × 3 array for measuring cellular respiration levels. Sens. Actuators, B 2013, 176, 913–920. 10.1016/j.snb.2012.09.037. [DOI] [Google Scholar]
- Lin Z.; Takahashi Y.; Kitagawa Y.; Umemura T.; Shiku H.; Matsue T. An addressable microelectrode array for electrochemical detection. Anal. Chem. 2008, 80, 6830–6833. 10.1021/ac801389d. [DOI] [PubMed] [Google Scholar]
- Ino K.; Saito W.; Koide M.; Umemura T.; Shiku H.; Matsue T. Addressable electrode array device with IDA electrodes for high-throughput detection. Lab Chip 2011, 11, 385–388. 10.1039/C0LC00437E. [DOI] [PubMed] [Google Scholar]
- Lam B.; Das J.; Holmes R. D.; Live L.; Sage A.; Sargent E. H.; Kelley S. O. Solution-based circuits enable rapid and multiplexed pathogen detection. Nat. Commun. 2013, 4, 2001 10.1038/ncomms3001. [DOI] [PubMed] [Google Scholar]
- Kanno Y.; Ino K.; Shikua H.; Matsue T. A local redox cycling-based electrochemical chip device with nanocavities for multi-electrochemical evaluation of embryoid bodies. Lab Chip 2015, 15, 4404–4414. 10.1039/C5LC01016K. [DOI] [PubMed] [Google Scholar]
- Ino K.; Yamada Y.; Kanno Y.; Imai S.; Shiku H.; Matsue T. Molecular electrochemical switching element based on diffusive molecular competition for multipoint electrochemical detection of respiration activity of cell aggregates. Sens. Actuators, B 2016, 234, 201–208. 10.1016/j.snb.2016.04.160. [DOI] [Google Scholar]
- Zhang H.; Oellers T.; Feng W.; Abdulazim T.; Saw E. N.; Ludwig A.; Levkin P. A.; Plumeré N. High-density droplet microarray of individually addressable electrochemical cells. Anal. Chem. 2017, 89, 5832–5839. 10.1021/acs.analchem.7b00008. [DOI] [PubMed] [Google Scholar]
- Han J.-H.; Kim S.; Choi J.; Kang S.; Pak Y. K.; Pak J. J. Development of multi-well-based electrochemical dissolved oxygen sensor array. Sens. Actuators, B 2020, 306, 127465 10.1016/j.snb.2019.127465. [DOI] [Google Scholar]
- Mavré F.; Anand R. K.; Laws D. R.; Chow K.-F.; Chang B.-Y.; Crooks J. A.; Crooks R. M. Bipolar electrodes: A useful tool for concentration, separation, and detection of analytes in microelectrochemical systems. Anal. Chem. 2010, 82, 8766–8774. 10.1021/ac101262v. [DOI] [PubMed] [Google Scholar]
- Fosdick S. E.; Knust K. N.; Scida K.; Crooks R. M. Bipolar electrochemistry. Angew. Chem., Int. Ed. 2013, 52, 10438–10456. 10.1002/anie.201300947. [DOI] [PubMed] [Google Scholar]
- Zhang X.; Zhai Q.; Xing H.; Li J.; Wang E. Bipolar electrodes with 100% current efficiency for sensors. ACS Sens. 2017, 2, 320–326. 10.1021/acssensors.7b00031. [DOI] [PubMed] [Google Scholar]
- Rahn K. L.; Anand R. K. Recent advancements in bipolar electrochemical methods of analysis. Anal. Chem. 2021, 93, 103–123. 10.1021/acs.analchem.0c04524. [DOI] [PubMed] [Google Scholar]
- Ino K.; Yaegaki R.; Hiramoto K.; Nashimoto Y.; Shiku H. Closed bipolar electrode array for on-chip analysis of cellular respiration by cell aggregates. ACS Sens. 2020, 5, 740–745. 10.1021/acssensors.9b02061. [DOI] [PubMed] [Google Scholar]
- Hsueh A.-J.; Mutalib N. A. A.; Shirato Y.; Suzuki H. Bipolar electrode arrays for chemical imaging and multiplexed sensing. ACS Omega 2022, 7, 20298–20305. 10.1021/acsomega.2c02298. [DOI] [PMC free article] [PubMed] [Google Scholar]
- Suzuki H.; Taura T. Thin-film Ag/AgCl structure and operational modes to realize long-term storage. J. Electrochem. Soc. 2001, 148, E468–E474. 10.1149/1.1416504. [DOI] [Google Scholar]
Associated Data
This section collects any data citations, data availability statements, or supplementary materials included in this article.


