

Abstract
Human Breast Milk (HBM) is widely acknowledged as the best nutritional source for neonates. Data indicates that, in 2019, 83.2% of infants in the United States received breast milk at birth, slightly reducing to 78.6% at 1 month. Despite these encouraging early figures, exclusive breastfeeding rates sharply declined, dropping to 24.9% by 6 months. This decline is particularly pronounced when direct breastfeeding is challenging, such as in Neonatal Intensive Care Units (NICU) and for working mothers. Given this, it is vital to explore alternative breast milk preservation methods. Technologies like Holder Pasteurization (HoP), High-Temperature Short-Time Pasteurization (HTST), High-Pressure Processing (HPP), UV radiation (UV), and Electric Pulses (PEF) have been introduced to conserve HBM. This review aims to enhance the understanding of preservation techniques for HBM, supporting the practice of extended exclusive breastfeeding. It explicitly addresses microbial concerns, focusing on critical pathogens like Staphylococcus aureus, Enterococcus, Escherichia coli, Listeria monocytogenes, and Cytomegalovirus, and explores how various preservation methods can mitigate these risks. Additionally, the review highlights the importance of retaining the functional elements of HBM, particularly its immunological components such as antibodies and enzymes like lysozyme and Bile Salt Stimulated Lipase (BSSL). The goal is to provide a comprehensive overview of the current state of HBM treatment, critically assess existing practices, identify areas needing improvement, and advocate for extended exclusive breastfeeding due to its vital role in ensuring optimal nutrition and overall health in infants.
Keywords: maternal milk, expressed breast milk, neonatal nutrition, non-thermal treatments, milk conservation, bioactive compounds, extended breastfeeding
Introduction
While Human Breast Milk (HBM) is often endorsed as the gold standard for neonatal nutrition (1–4), the 2022 Breastfeeding Report Card from the Centers for Disease Control and Prevention (5) reported that the majority (83.2%) of infants born during 2019 in the US began receiving breast milk, and 78.6% were still receiving breast milk at 1 month; however, at 6 months, only 24.9% of infants were exclusively breastfed, while 55.8% occasionally drank breast milk (Figure 1). Also, data reported by UNICEF points out that, according to 2017 data, only 41%–64% of babies were still breastfed at 2 years old (6). These trends have diverse implications, ranging from an increased risk of obesity in the child to various physical and emotional challenges for the mother (7–9).
Figure 1.

Percentage of 2019-born children who received any or exclusive Human Breast Milk (HBM) for the first 12 months of their lives (5).
To address the decline in breastfeeding, it is crucial to comprehend the underlying reasons. While there are numerous factors at play, two prevalent situations arise where direct breastfeeding becomes challenging: (1) When a neonate born preterm requires being introduced to a Neonatal Intensive Care Unit (NICU) (10), (2) Working mothers (representing more than half of mothers, in the US), must go outside the home without their babies, to continue with their professional life (9).
In both scenarios, the core requirement remains consistent: since these babies cannot be breastfed, alternatives must be sought to provide them with HBM when their mothers are not present. Technologies like Holder Pasteurization (HoP), High-Temperature Short-Time (HTST) Pasteurization, High-Pressure Processing (HPP), Ultraviolet (UV) radiation, and Pulsed Electric Fields (PEF) emerge as viable milk preservation methods, each presenting its own set of benefits and limitations.
Considering these factors, this review delves into characterizing HBM as a living fluid, emphasizing its relevance for individual children and society at large. From this perspective, we review the effects of the preservation treatments on the milk’s microbiological, bioactive, and nutritional profiles. The aim is to identify viable alternatives that facilitate prolonged lactation, enabling newborns to be fed exclusively on high-quality HBM for the first 6 months and continue for 12 months, as recommended by major US medical organizations (11), ensuring that infants receive optimal nutrition even when not in immediate proximity to their mothers.
Breast milk
Generalities
Human Breast Milk is a complex fluid [sometimes called a biological system (12) and a living tissue], naturally produced by women (13). HBM comprises nutritional and bioactive components that constantly interact with each other (12). Such intricate composition ensures that infants receive optimal nourishment (14). Because of this, organizations like WHO advocate exclusive breastfeeding for at least the initial 6 months of newborns’ lives (15).
While the HBM concept may seem obvious, classifying it poses challenges. This is primarily because (1) its composition constantly adapts to meet the evolving needs of the newborn, and (2) the dynamics of its constituents are influenced by various factors related to the mother, the baby, and the environment, including variables like geographic location and the mother’s diet (12, 13). With these complexities in mind and with a degree of generalization, the primary phases of HBM can be classified as colostrum, transitional milk, and mature milk, with their primary characteristics illustrated in Figure 2.
Figure 2.

Stages of HBM in the function of periods (16, 17), created with BioRender.com.
This classification offers an introductory insight into the complexity of HBM, to understand its significance in neonatal nutrition and (13) the indispensable role that this fluid plays in newborn feeding.
Composition
Bioactive components in HBM
While inherent variability exists, bioactive compounds in HBM can be generally categorized into (1) growth and immunological factors and (2) cellular components, which notably include beneficial bacteria, along with immune, epithelial, and stem cells (13). A summary of these components is shown in Figure 3.
Figure 3.

Cells found in HBM (13).
The emphasis on immunological factors, specifically antibodies, is paramount within bioactive components. Immunoglobulins are prominent representatives of this category. They are present mainly in the form of secretory Immunoglobulin A (sIgA) (hypothesized as an essential protective agent in breast milk) and secretory Immunoglobulin G (sIgG). These components play a crucial role in safeguarding the infant from infections during the maturation of its immune system. Breastfeeding has been shown to reduce the incidence of respiratory tract infections by 63% (18, 19). Remarkably, the content of immunoglobulins decreases as the lactation progresses. This trend can be attributed to (1) the increased autonomy of the infant’s immune system, reducing the need for external support, and (2) a decline in the newborn’s ability to absorb whole proteins through the gut (18).
HBM comprises both immunological and non-immunological cells. Concerning the former, leucocytes represent less than 2% of all cell content in the mature milk of healthy mothers. Their role is to bestow immunocompetence upon the newborn, and some hypotheses suggest a role in protecting the mammary gland against infections (13).
Non-immunological cells in HBM can be classified as lactocytes (responsible for the secretion of milk), myoepithelial cells (coming from ducts and alveoli from the mammary gland), progenitor cells, and stem cells, present in a heterogeneous mixture (Figure 4). Notably, myoepithelial cells and their precursors constitute around 98% of the non-immune cell types in healthy HBM. Their predominance is owed to their fundamental role in building the smooth muscle fibers surrounding the alveoli. Their importance is further underscored by their specific function of facilitating milk flow into the milk ducts (13). While existing studies provide insights, it is pertinent to acknowledge the need for further research to elucidate the potential benefits of non-immune cells in infant health.
Figure 4.

Nutrients found in HBM (20).
Nutritional components of HBM
As mentioned before, the nutrient profile of HBM can differ based on several factors, notably the duration post-birth. Figure 4 illustrates the classification of nutrients found in HBM. Subsequently, we delve into each nutrient cluster’s role in neonatal development.
Proteins
Proteins are integral components of HBM, highlighted by (1) the variety of their functions, since they play a role in stimulating the absorption of other nutrients, modulating the growth and body composition of newborns, promoting gut development, and in antimicrobial and immunomodulatory activities, among other purposes, and (2) for its broad types; it is reported that HBM can contain more than 400 types of proteins (18, 20).
Lactocytes synthesize between 80% and 90% of proteins in HBM, with the remainder sourced from maternal circulation via transcytosis, subsequently entering the breast duct lumen (18).
As outlined in Figure 4, proteins are primarily classified into (1) casein proteins, existing as α-, β- and κ-casein in micelles, forming a colloidal suspension with κ-casein acting as a stabilizer; (2) whey proteins, soluble in milk, prominently including α-lactalbumin, lactoferrin, immunoglobulin S (IgS), serum albumin and lysozyme, and (3) mucins proteins, localized in the membrane of the fat globules in milk (18).
It is essential to mention that whey proteins such as lactoferrin and lysozyme are bioactive proteins that protect the infant against pathogens. First, lactoferrin (a highly glycosylated protein) can affect iron-dependent microorganisms because of its ability to decrease iron availability and disrupt their membranes (21, 22) and has antiviral effects against diverse viruses, including SARS-CoV-2 (23–25). As for Lysozyme, it also possesses an antimicrobial effect, but its range of action focuses on improving human-resident bifidobacteria by excluding the non-human types from the infant’s system (20, 26).
Non-protein nitrogen
This category, detailed in Figure 4, accounts for approximately 25% of all the nitrogen present in HBM (18). Although this fraction has been little studied, research underscores its contributions to metabolic mediation, enzymatic activity, and promoting gut and microbiota development (18).
Carbohydrates
Lactose, a disaccharide comprising glucose and galactose, dominates the carbohydrate content in HBM. HBM has the highest lactose concentration compared to other mammals, mainly attributed to the highest energy demand for human brain development (18). Furthermore, as a galactose source, lactose is pivotal for the maturation of the central nervous system (20).
Human Milk Oligosaccharides (HMOs) are another vital carbohydrate component in HBM. While not directly digested by newborns, they play an essential role in nourishing the gut microbiota (18).
Human Milk Oligosaccharides (HMOs)
HMOs are complex molecules composed of 3–22 monomeric units of saccharides per molecule. Their structural building blocks consist of five monomers: L-fucose, D-glucose, D-galactose, N-acetylglucosamine, and N-acetylneuraminic acid, which vary in orientation and sequence of bonding (18, 27).
Several unique properties distinguish HMOs from other carbohydrates. They are the third most abundant component in HBM, with concentrations reaching up to 12.9 g/L in mature milk (18). Functionally, HMOs are essential for developing the infant’s gut microbiota and encouraging the growth of beneficial gut bacteria (serving as growth substrates), such as Bifidobacterium infantis (28). This enhancement helps to mitigate the growth of pathogenic bacteria and establishes a protective barrier against neonatal diarrheal infections. This protective mechanism stems from HMOs’ ability to mimic intestinal cell carbohydrates, which some pathogens latch onto. HMOs intercept these pathogens by acting as decoys, preventing them from infecting epithelial cells (18, 29).
Lipids
These compounds represent the primary energy source in HBM, accounting for 40%–55% of its total energy, as shown in Table 1 (20). Notably, nearly 98% of the lipids in human milk are triacylglycerides (TAG). The remaining fractions include diacylglycerides, monoacylglycerides, free fatty acids, phospholipids, and cholesterol. These molecules can form emulsions, forming fat globules. Within this structure, phospholipids comprise the protective membrane encapsulating the TAG core, as shown in Figure 5 (18, 30).
Table 1.
Contribution to energy intake to 1 month of age newborns of compounds found in HBM, based on Mosca and Giannì (20).
| Compound | Energy intake (%) |
|---|---|
| Lipids | 44.5 ± 5.2 |
| Carbohydrates | 43.9 ± 5.8 |
| Proteins | 8.4 ± 1.0 |
Figure 5.
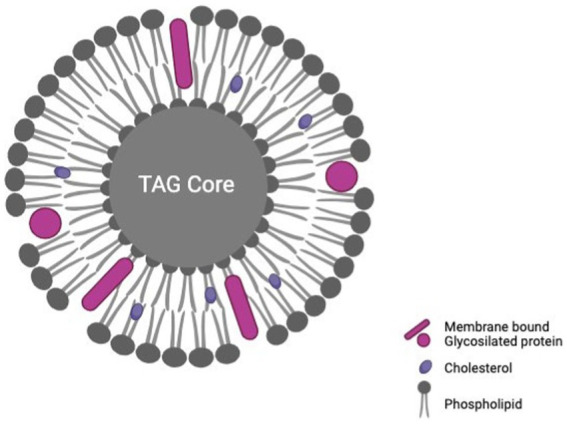
Conformation of a milk fat globule with a triacylglyceride (TAG) core, based on Brink and Lönnerdal (30), created with BioRender.com.
Beyond their primary energy-providing role, lipids in HBM also play a vital role in infant development. The concentration of long-chain polyunsaturated fatty acids (LC-PUFAs) in breast milk, such as DHA and arachidonic acid (ARA), positively correlates with infants’ cognitive development and visual acuity. Also, they serve as a source of essential nutrients, such as lipid-soluble vitamins, polyunsaturated fatty acids, and complex lipids. Furthermore, they play a crucial role in the myelination of the central nervous system, foster the development of the gastrointestinal tract, and offer protection against infections on the mucosal surface (18, 20, 31).
Another significant lipid fraction in HBM is glycolipids, which play a specific role in infant development. Recent studies indicate that gangliosides, a type of glycolipid, contribute to the maturation of the immune response and offer protection against allergies. They also have beneficial roles in antibacterial, anti-inflammatory, and prebiotic responses (32).
Significance of breastfeeding: implications for newborns, mothers, and public health
HBM has been frequently cited as: “the only food that meets all the nutritional requirements of infants and provides optimal adaptation, somatic growth, maturation, and development” (12, 33). The evidence highlights that the first one hundred days post-conception is the most critical period for laying the foundation of lifelong health (34). This underlines the profound impact of breastfeeding on the health trajectories of infants and mothers, immediately and in the long run, and extends its significance to broader public health contexts.
For infants, the benefits are clear. In the immediate term, research suggests a discernible decrease in mortality rates during the initial years of life of breastfed newborns (34). Additionally, HBM has been highly effective in guarding against infectious gastroenteritis, particularly in developing countries, while bolstering immune system maturation (33). Over the long term, HBM plays dual roles: (1) fostering the growth and stability of the microbiome, which in turn may mitigate risks associated with chronic diseases like obesity, diabetes, heart disease, and cancer (34), and (2) facilitating the maturation of the central nervous system, which correlates with enhanced cognitive performance (studies have indicated a potential 2%–3% increase in intelligence quotient and improved academic outcomes) (12, 35).
For mothers, breastfeeding offers protective benefits against certain cancers potentially due to its ovulation-suppressing effects (34, 36). Moreover, research indicates that compared with their non-lactating counterparts, breastfeeding mothers often require fewer medical consultations (23), a testament to the health benefits summarized in Table 2 (37).
Table 2.
Breastfeeding benefits for mothers, based on del Ciampo and del Ciampo (37).
| Short-term benefits | Long-term benefits |
|---|---|
| Reduced probabilities of: | Reduced probabilities of: |
| Bleeding | Cancer (endometrium, breast, and ovarian) |
| Infection | Endometriosis |
| Adiposity and weight | Chronic diseases, such as diabetes, high blood pressure, and cardiovascular diseases |
| Postpartum depression | Rheumatoid arthritis |
| Stress and anxiety | Alzheimer disease |
| Get pregnant immediately | – |
Breastfeeding offers significant health benefits as a form of preventive medicine, nurturing a healthier population less prone to chronic diseases responsible for 60% of deaths globally (38). Emphasizing its health impact could revolutionize public health, akin to the transformative change seen almost 60 years ago regarding smoking, after the US Surgeon General’s report on smoking worldwide. Supporting every mother’s ability to breastfeed, as urged in 2011, the Surgeon General’s Call to Action is crucial for global health improvement (34, 39).
Why preserve Human Breast Milk?
In response to the US Surgeon General’s call, the treatment of HBM emerges as a pivotal alternative for mothers desiring to breastfeed but facing constraints. This article will delve into two primary scenarios underscoring this need.
First is the case of newborns, mainly preterm infants, temporarily deprived of direct maternal contact in the NICU. In such cases, Donated Breast Milk (DBM) would be the preferred option to meet the newborn’s nutritional needs (40). Given the vulnerable and underdeveloped immune systems of preterm infants, they are inherently at higher risk of infections (41). Therefore, to ensure its microbiological safety, DBM is typically processed in a Human Milk Bank (HMB), a specialized facility designed for this purpose. The Holder Pasteurization Process, endorsed by the Human Milk Banking Association of North America (HMBANA), defines the standard protocol (42). This method, while ensuring microbial safety, can compromise vital compounds like enzymes, immunoglobulins, and growth factors. Consequently, thermal and non-thermal techniques are being explored as alternatives for ensuring microbial safety and nutrient preservation in HBM.
The second scenario regards the challenge of nursing for working mothers. Data from 2011 (9, 43) indicates that a significant percentage (64%) of American women with children below 6 years and 56% with infants under 1 year were employed outside their homes. This pattern has persisted globally well into the last decade (9). Undoubtedly, this trend influences breastfeeding duration. Studies highlight a noteworthy difference in the rates of lactation continuation between working mothers and their stay-at-home counterparts, with the former group showing at least a 9% decline by the six-month mark (9, 44). This disparity stems from several factors, including workplace conditions and lack of technology that supports milk extraction and preservation, leading many working mothers to preemptively view workplace breastfeeding as discouraging. Often, balancing workplace demands with maternal responsibilities becomes overwhelming, breastfeeding is the first thing they usually abandon, despite its benefits for both mother and newborn (9).
Given this context, devising solutions to aid mothers to continue breastfeeding comfortably and sustainably, without negatively affecting their employment, becomes highly relevant. Among the innovative avenues explored are emerging food preservation technologies like HPP, UV radiation, and PEF. Not only do these techniques ensure the microbiological safety of HBM until consumption, but they also ensure it retains essential nutrients and bioactive compounds pivotal for newborn development. The promise of these alternatives is further buoyed by findings suggesting extended lactation durations when workplaces provide suitable facilities for breast milk extraction and preservation technology (9).
In conclusion, exploring viable HBM preservation methods is fundamental for enhancing lactation duration for preterm and term newborns. Such advancements empower those mothers unable to breastfeed directly to persist with lactation, thereby bolstering the health of both mother and child and paving the way for a better-nourished and healthier society. That is why, in the subsequent sections, we provide an overview of various technologies employed for HBM treatment. We will also discuss their impact on nutritional and functional properties and their relevance from a microbiological preservation perspective.
Thermal vs. non-thermal processes: a comparison of effects in breast milk
Even though several technologies could be applied for HBM treatment, exploring which ones can make milk safe from the microbiological perspective is very important. It is necessary to completely inactivate microorganisms [that is, when viruses are inactivated, and bacterial reduction achieve 5-log reductions and levels below 10 CFU/mL (45, 46)] without compromising the content and activity of bioactive and nutritional compounds crucial for pre-term and term babies’ health. Considering this, a comparative analysis using Tables 3–6 is shown.
Table 3.
Effect of thermal processes applied for pathogen population reduction on breast milk.
| Applied treatment | Process conditions | Microorganism | Log10 reductions | Initial load | UnitsA-E | Reference |
|---|---|---|---|---|---|---|
| HoP | 62.5°C, 30 min | Bacillus cereus (CECT 131) | 2.62 | 107 | CFU/mL | (47) |
| 63 ± 0.5°C, 30 min | Coagulase-negative staphylococci* | Below detection limit | 9.8×10⁴ | CFU/mL | (48) | |
| 63°C, 30 min. After heating: 4°C | Cytomegalovirus (CMV) | >0.9 | 3.16×10³ | PFU/mL | (49) | |
| 62.5°C, 30 min | Cytomegalovirus (CMV) (AD169) | Below detection limit | 32 | IEA | (50) | |
| 62.5°C, 30 min | Enveloped hepatitis E virus (eHEV) | 1.1 | 6.31×10⁴ | FFU/mL | (51) | |
| 62.5°C, 30 min | Enterococcus faecalis (ATCC 29212) | >5.1 | 1.16×10⁵ | CFU/mL | (50) | |
| 62.5°C, 30 min. After heating: quickly cooled to 20°C | Enterococcus faecalis (PCM 896) | 3.92 | 8.91×10⁴ | CFU/mL | (52) | |
| 62.5°C, 30 min. After heating: quickly cooled to 20°C | Enterococcus faecium (ATCC 6057) | 4.28 | 7.94×10⁴ | CFU/mL | (52) | |
| 63 ± 0.5°C, 30 min | Enterococcus species* | Below detection limit | 103 | CFU/mL | (48) | |
| 62.5°C, 30 min. After heating: cooled in ice slurry | Escherichia coli (ATCC 25922) | ≥7 | 108 | CFU/mL | (53) | |
| 62.5°C, 30 min. After heating: quickly cooled to 20°C | Escherichia coli (K-12) | Below detection limit | 1.05×10⁵ | CFU/mL | (52) | |
| 62.5°C, 30 min | HCoV-229E | 1.5 | 106 | FFU/mL | (51) | |
| 63°C, 30 min. After heating: 4°C | Hepatitis A virus (HAV) | 3.1 | 5.01×10⁵ | PFU/mL | (49) | |
| 62.5°C, 30 min | Klebsiella pneumoniae (ATCC 700603) | >4.8 | 5.70×10⁴ | CFU/mL | (50) | |
| 62.5°C, 30 min | Klebsiella pneumoniae (Kpn 01605) | >4.6 | 3.60×10⁴ | CFU/mL | (50) | |
| 62.5°C, 30 min. After heating: cooled in ice slurry | Listeria monocytogenes (ATCC 19115) | ≥7 | 108 | CFU/mL | (53) | |
| 62.5°C, 30 min | Non-enveloped hepatitis E virus (neHEV) | 1.2 | 5.01×10⁵ | FFU/mL | (51) | |
| 62.5°C, 30 min | Pseudomonas aeruginosa (ATCC 27853) | 5 | 105 | CFU/mL | (50) | |
| 62.5°C, 30 min. After heating: cooled in ice slurry | SARS-CoV-2 | 6 | 107 | TCID50 | (54) | |
| 62.5°C, 30 min | Serratia marcescens (Smarc 00697) | >4.9 | 1.04×10⁵ | CFU/mL | (50) | |
| 62.5°C, 30 min. After heating: cooled in ice slurry | Staphylococcus agalactiae (ATCC 12927) | ≥7 | 108 | CFU/mL | (53) | |
| 62.5°C, 30 min. After heating: cooled in ice slurry | Staphylococcus aureus (ATCC 25923) | ≥7 | 108 | CFU/mL | (53) | |
| 62.5°C, 30 min | Staphylococcus aureus (ATCC 6538) | >4.9 | 7.90×10⁴ | CFU/mL | (50) | |
| 62.5°C, 30 min. After heating: cooled in ice slurry | Staphylococcus aureus (ATCC 6538) | ≥7 | 108 | CFU/mL | (53) | |
| 62.5°C, 30 min. After heating: quickly cooled to 20°C | Staphylococcus aureus (PCM 2054) | Below detection limit | 1.20×10⁵ | CFU/mL | (52) | |
| 62.5°C, 30 min | Staphylococcus aureus sub. Aureus (CECT 976) | 3.13 | 107 | (47) | ||
| HTST | 72°C, 16 s | Bovine Viral Diarrhea Virus (BVDV) | >5.84 | 6.31×10⁷ | TCID50 | (55) |
| 72°C, 15 s | Chronobacter sakazakii (ATCC 51329) | Below detection limit | 1.60×10⁶ | CFU/mL | (56) | |
| 62°C, 5 s | Coagulase-negative staphylococci* | 4.42 | 9.80×10⁴ | CFU/mL | (48) | |
| 62°C, 5 s | Cytomegalovirus (CMV) (AD169) | Below detection limit | 32 | IEA | (50) | |
| 62°C, 15 s | Cytomegalovirus (CMV) (AD169) | Below detection limit | 32 | IEA | (50) | |
| 72°C, 5 s | Cytomegalovirus (CMV) (AD169) | Below detection limit | 32 | IEA | (50) | |
| 72°C, 15 s | Cytomegalovirus (CMV) (AD169) | Below detection limit | 32 | IEA | (50) | |
| 87°C, 2 s | Cytomegalovirus (CMV) (AD169) | Below detection limit | 32 | IEA | (50) | |
| 87°C, 5 s | Cytomegalovirus (CMV) (AD169) | Below detection limit | 32 | IEA | (50) | |
| 62°C, 5 s | Enterococcus faecalis (ATCC 29212) | 1.1 | 1.16×10⁵ | CFU/mL | (50) | |
| 62°C, 15 s | Enterococcus faecalis (ATCC 29212) | 1.1 | 1.16×10⁵ | CFU/mL | (50) | |
| 72°C, 5 s | Enterococcus faecalis (ATCC 29212) | 3.8 | 1.16×10⁵ | CFU/mL | (50) | |
| 72°C, 15 s | Enterococcus faecalis (ATCC 29212) | 3.8 | 1.16×10⁵ | CFU/mL | (50) | |
| 87°C, 2 s | Enterococcus faecalis (ATCC 29212) | >5.1 | 1.16×10⁵ | CFU/mL | (50) | |
| 87°C, 5 s | Enterococcus faecalis (ATCC 29212) | >5.1 | 1.16×10⁵ | CFU/mL | (50) | |
| 62°C, 5 s | Enterococcus species* | 0.92 | 103 | CFU/mL | (48) | |
| 71°C, 18.9 s, 5.9 mL/min | Escherichia coli (ATCC 25922) | >5.15 | 1.40×10⁶ | CFU/mL | (57) | |
| 71°C, 9 s, 12.3 mL/min | Escherichia coli (ATCC 25922) | >5.15 | 1.40×10⁶ | CFU/mL | (57) | |
| 71°C, 5.75 s, 18.9 mL/min | Escherichia coli (ATCC 25922) | >5.15 | 1.40×10⁶ | CFU/mL | (57) | |
| 72°C, 16 s | Escherichia coli (CIVO.B.0505) | >32 | 2.10×10⁸ | CFU/mL | (55) | |
| 72°C, 16 s | Hepatitis A Virus (HAV) | 2 | 2.45×10⁷ | TCID50 | (55) | |
| 72°C, 16 s | Human Immunodeficiency Virus (HIV) | >7.27 | 2.24×10⁸ | TCID50 | (55) | |
| 62°C, 15 s | Klebsiella pneumoniae (ATCC 700603) | 4.5 | 5.70×10⁴ | CFU/mL | (50) | |
| 72°C, 5 s | Klebsiella pneumoniae (ATCC 700603) | >4.8 | 5.70×10⁴ | CFU/mL | (50) | |
| 72°C, 15 s | Klebsiella pneumoniae (ATCC 700603) | >4.8 | 5.70×10⁴ | CFU/mL | (50) | |
| 87°C, 2 s | Klebsiella pneumoniae (ATCC 700603) | >4.8 | 5.70×10⁴ | CFU/mL | (50) | |
| 62°C, 15 s | Klebsiella pneumoniae (Kpn 01605) | 1.1 | 3.60×10⁴ | CFU/mL | (50) | |
| 72°C, 5 s | Klebsiella pneumoniae (Kpn 01605) | >4.6 | 3.60×10⁴ | CFU/mL | (50) | |
| 72°C, 15 s | Klebsiella pneumoniae (Kpn 01605) | >4.6 | 3.60×10⁴ | CFU/mL | (50) | |
| 72°C, 16 s | Porcine Parvovirus (PPV) | 0.5 | 3.80×10⁸ | TCID50 | (55) | |
| 62°C, 5 s | Pseudomonas aeruginosa (ATCC 27853) | 1.1 | 105 | CFU/mL | (50) | |
| 62°C, 15 s | Pseudomonas aeruginosa (ATCC 27853) | 3.7 | 105 | CFU/mL | (50) | |
| 72°C, 5 s | Pseudomonas aeruginosa (ATCC 27853) | 5 | 105 | CFU/mL | (50) | |
| 87°C, 5 s | Pseudomonas aeruginosa (ATCC 27853) | 5 | 105 | CFU/mL | (50) | |
| 72°C, 16 s | Pseudorabies Virus (PRV) | >7.68 | 4.37×10⁸ | TCID50 | (55) | |
| 62°C, 5 s | Serratia marcescens (Smarc 00697) | 3.1 | 1.04×10⁵ | CFU/mL | (50) | |
| 62°C, 15 s | Serratia marcescens (Smarc 00697) | >4.9 | 1.04×10⁵ | CFU/mL | (50) | |
| 72°C, 5 s | Serratia marcescens (Smarc 00697) | >4.9 | 1.04×10⁵ | CFU/mL | (50) | |
| 87°C, 5 s | Serratia marcescens (Smarc 00697) | >4.9 | 1.04×10⁵ | CFU/mL | (50) | |
| 71°C, 18.9 s, 5.9 mL/min | Staphylococcus aureus (ATCC 25923) | >6.07 | 1.20×10⁷ | CFU/mL | (57) | |
| 71°C, 9 s, 12.3 mL/min | Staphylococcus aureus (ATCC 25923) | >6.07 | 1.20×10⁷ | CFU/mL | (57) | |
| 71°C, 5.75 s, 18.9 mL/min | Staphylococcus aureus (ATCC 25923) | >6.07 | 1.20×10⁷ | CFU/mL | (57) | |
| 72°C, 15 s | Staphylococcus aureus (ATCC 33862) | 4.48 | 3.00×10⁶ | CFU/mL | (56) | |
| 62°C, 5 s | Staphylococcus aureus (ATCC 6538) | 2.4 | 7.90×10⁴ | CFU/mL | (50) | |
| 72°C, 5 s | Staphylococcus aureus (ATCC 6538) | 3.3 | 7.90×10⁴ | CFU/mL | (50) | |
| 62°C, 15 s | Staphylococcus aureus (ATCC 6538) | 3.6 | 7.90×10⁴ | CFU/mL | (50) | |
| 72°C, 15 s | Staphylococcus aureus (ATCC 6538) | 3.9 | 7.90×10⁴ | CFU/mL | (50) | |
| 87°C, 2 s | Staphylococcus aureus (ATCC 6538) | >4.9 | 7.90×10⁴ | CFU/mL | (50) | |
| 87°C, 5 s | Staphylococcus aureus (ATCC 6538) | >4.9 | 7.90×10⁴ | CFU/mL | (50) | |
| 72°C, 16 s | Staphylococcus aureus (NCCB70054/CIVO.B. 1,245) | 15 | 2.50×10⁷ | CFU/mL | (55) | |
| 72°C, 16 s | Streptococcus agalactiae (CIVO.B.0062) | >26 | 3.80×10⁶ | CFU/mL | (55) |
Microorganisms marked with * were evaluated as native on HBM; the others were inoculated. HoP, Holder Pasteurization; HTST, High-Temperature Short-Time Pasteurization. ACFU, Colony Forming Unit; BPFU, Plaque Forming Unit; CIEA, Immediate Early Antigen; DFFU, Focus Forming Unit; ETCID50, 50% of the Tissue Culture Infectivity Dose.
Table 6.
Effect of non-thermal processes applied for breast milk preservation on bioactive and nutritional components.
| Applied treatment | Process conditions | Bioactive or nutritional components | Initial content | Percentage of retention | Reference |
|---|---|---|---|---|---|
| HPP | 600 MPa, 10 min, 19–21°C | Adiponectin | – | 2.01 | (58) |
| 200 MPa, 10 min; interval, 10 min; 600 MPa, 10 min, 19–21°C | Adiponectin | – | 4.09 | (58) | |
| 100 MPa, 10 min; interval 10 min; 600 MPa, 10 min, 19–21°C | Adiponectin | – | 10.73 | (58) | |
| 200 MPa, 10 min; interval 10 min; 400 MPa, 10 min, 19–21°C | Adiponectin | – | 38.55 | (58) | |
| 500 MPa, 8 min, 4°C | Ascorbic acid | 14 ± 11.2 mg/L | 23.57 | (59) | |
| 550 MPa, 5 min | Bile Salt Stimulated Lipase (BSSL) (activity) | 9.4 U/mL | 61.60 | (60) | |
| 500 MPa, 8 min, 4°C | Bile Salt Stimulated Lipase (BSSL) (activity) | – | 100 | (59) | |
| 400 MPa, 5 min, 25°C | Bile Salt Stimulated Lipase (BSSL) (activity) | – | 110 ± 6.53 | (61) | |
| 500 MPa, 8 min, 4°C | Carbohydrate | 69 ± 3 g/L | 97.10 | (59) | |
| 350 MPa, 8 min, 16.5°C | Carbohydrate | 8.1 (8.0, 8.2) g/dL | 100 | (49) | |
| 350 MPa, 10 min, 16.5°C | Carbohydrate | 8.1 (8.0, 8.2) g/dL | 100 | (49) | |
| 500 MPa, 8 min, 18.8°C | Carbohydrate | 8.1 (8.0, 8.2) g/dL | 100 | (49) | |
| 500 MPa, 10 min, 18.8°C | Carbohydrate | 8.1 (8.0, 8.2) g/dL | 100 | (49) | |
| 600 MPa, 8 min, 21.5°C | Carbohydrate | 8.1 (8.0, 8.2) g/dL | 100 | (49) | |
| 600 MPa, 10 min, 21.5°C | Carbohydrate | 8.1 (8.0, 8.2) g/dL | 100 | (49) | |
| 350 MPa, 8 min, 16.5°C | Crude protein | 1.3 (0.9, 1.5) g/dL | 100 | (49) | |
| 350 MPa, 10 min, 16.5°C | Crude protein | 1.3 (0.9, 1.5) g/dL | 100 | (49) | |
| 500 MPa, 8 min, 18.8°C | Crude protein | 1.3 (0.9, 1.5) g/dL | 100 | (49) | |
| 500 MPa, 10 min, 18.8°C | Crude protein | 1.3 (0.9, 1.5) g/dL | 100 | (49) | |
| 600 MPa, 8 min, 21.5°C | Crude protein | 1.3 (0.9, 1.5) g/dL | 100 | (49) | |
| 600 MPa, 10 min, 21.5°C | Crude protein | 1.3 (0.9, 1.5) g/dL | 100 | (49) | |
| 425 MPa, 4 cycles, 6 min each, 4°C | Cytokine IL-8 (concentration) | 119.0 (106.1–123.1) pg./mL | 70.00 | (62) | |
| 425 MPa, 4 cycles, 6 min each, 37°C | Cytokine IL-8 (concentration) | 119.0 (106.1–123.1) pg./mL | 88.32 | (62) | |
| 425 MPa, 4 cycles, 6 min each, 4°C | Cytokine IP-10 (concentration) | 30.9 (30.3–35.4) pg./mL | 60.84 | (62) | |
| 425 MPa, 4 cycles, 6 min each, 37°C | Cytokine IP-10 (concentration) | 30.9 (30.3–35.4) pg./mL | 88.67 | (62) | |
| 425 MPa, 4 cycles, 6 min each, 37°C | Cytokine MCP-1 (concentration) | 524.2 (410.9–688.0) pg./mL | 69.42 | (62) | |
| 425 MPa, 4 cycles, 6 min each, 4°C | Cytokine MCP-1 (concentration) | 524.2 (410.9–688.0) pg./mL | 87.77 | (62) | |
| 425 MPa, 4 cycles, 6 min each, 37°C | Cytokine MIG (concentration) | 25.7 (19.4–29.3) pg./mL | 61.87 | (62) | |
| 425 MPa, 4 cycles, 6 min each, 4°C | Cytokine MIG (concentration) | 25.7 (19.4–29.3) pg./mL | 71.60 | (62) | |
| 425 MPa, 4 cycles, 6 min each, 4°C | Cytokine TGF-β2 (concentration) | 844.7 (671.9–956.8) pg./mL | 71.63 | (62) | |
| 425 MPa, 4 cycles, 6 min each, 37°C | Cytokine TGF-β2 (concentration) | 844.7 (671.9–956.8) pg./mL | 90.81 | (62) | |
| 500 MPa, 8 min, 4°C | Energy | 616 ± 72 kcal/L | 95.94 | (59) | |
| 350 MPa, 8 min, 16.5°C | Energy | 67 (63, 74) Kcal/dL | 97.01 | (49) | |
| 350 MPa, 10 min, 16.5°C | Energy | 67 (63, 74) Kcal/dL | 97.01 | (49) | |
| 600 MPa, 10 min, 21.5°C | Energy | 67 (63, 74) Kcal/dL | 97.01 | (49) | |
| 500 MPa, 8 min, 18.8°C | Energy | 67 (63, 74) Kcal/dL | 98.51 | (49) | |
| 500 MPa, 10 min, 18.8°C | Energy | 67 (63, 74) Kcal/dL | 98.51 | (49) | |
| 600 MPa, 8 min, 21.5°C | Energy | 67 (63, 74) Kcal/dL | 98.51 | (49) | |
| 350 MPa, 8 min, 16.5°C | Fat | 3.3 (2.8, 3.8) g/dL | 87.88 | (49) | |
| 350 MPa, 10 min, 16.5°C | Fat | 3.3 (2.8, 3.8) g/dL | 87.88 | (49) | |
| 500 MPa, 8 min, 18.8°C | Fat | 3.3 (2.8, 3.8) g/dL | 90.91 | (49) | |
| 500 MPa, 10 min, 18.8°C | Fat | 3.3 (2.8, 3.8) g/dL | 90.91 | (49) | |
| 600 MPa, 8 min, 21.5°C | Fat | 3.3 (2.8, 3.8) g/dL | 90.91 | (49) | |
| 600 MPa, 10 min, 21.5°C | Fat | 3.3 (2.8, 3.8) g/dL | 90.91 | (49) | |
| 500 MPa, 8 min, 4°C | Fat | 31 ± 8 g/L | 93.55 | (59) | |
| 500 MPa, 8 min, 4°C | Folate (concentration) | 191 ± 83 nmol/L | 92.67 | (59) | |
| 600 MPa, 10 min, 19–21°C | Hepatocyte growth factor (HGF) | – | 36.15 | (58) | |
| 100 MPa, 10 min; interval 10 min; 600 MPa, 10 min, 19–21°C | Hepatocyte growth factor (HGF) | – | 38.81 | (58) | |
| 200 MPa, 10 min; interval, 10 min; 600 MPa, 10 min, 19–21°C | Hepatocyte growth factor (HGF) | – | 43.02 | (58) | |
| 200 MPa, 10 min; interval 10 min; 400 MPa, 10 min, 19–21°C | Hepatocyte growth factor (HGF) | – | 97.15 | (58) | |
| 400 MPa, 120 min | Immunoglobulin A (IgA) (activity) | 0.900 ± 0.035 mg/mL | 75.40 | (63) | |
| 400 MPa, 90 min | Immunoglobulin A (IgA) (activity) | 0.900 ± 0.035 mg/mL | 80.60 | (63) | |
| 400 MPa, 30 min | Immunoglobulin A (IgA) (activity) | 0.900 ± 0.035 mg/mL | 85.60 | (63) | |
| 400 MPa, 60 min | Immunoglobulin A (IgA) (activity) | 0.900 ± 0.035 mg/mL | 87.10 | (63) | |
| 600 MPa, 5 min, 12°C | Immunoglobulin A (IgA) (concentration) | 367.6 ± 38.18 μg/mL | 69.31 | (67) | |
| 500 MPa, 5 min, 12°C | Immunoglobulin A (IgA) (concentration) | 367.6 ± 38.18 μg/mL | 87.93 | (67) | |
| 400 MPa, 5 min, 12°C | Immunoglobulin A (IgA) (concentration) | 367.6 ± 38.18 μg/mL | ~100 | (67) | |
| 400 MPa, 5 min, 25°C | Immunoglobulin A (IgA) (concentration) | – | 97.8 ± 8.74 | (61) | |
| 600 MPa, 10 min, 19–21°C | Immunoglobulin G (IgG) (concentration) | – | 30.32 | (58) | |
| 100 MPa, 10 min; interval 10 min; 600 MPa, 10 min, 19–21°C | Immunoglobulin G (IgG) (concentration) | – | 30.84 | (58) | |
| 200 MPa, 10 min; interval, 10 min; 600 MPa, 10 min, 19–21°C | Immunoglobulin G (IgG) (concentration) | – | 31.54 | (58) | |
| 200 MPa, 10 min; interval 10 min; 400 MPa, 10 min, 19–21°C | Immunoglobulin G (IgG) (concentration) | – | 82.24 | (58) | |
| 100 MPa, 10 min; interval 10 min; 600 MPa, 10 min, 19–21°C | Insulin | – | 81.98 | (58) | |
| 600 MPa, 10 min, 19–21°C | Insulin | – | 88.20 | (58) | |
| 200 MPa, 10 min; interval, 10 min; 600 MPa, 10 min, 19–21°C | Insulin | – | 90.31 | (58) | |
| 200 MPa, 10 min; interval 10 min; 400 MPa, 10 min, 19–21°C | Insulin | – | 94.76 | (58) | |
| 600 MPa, 10 min, 19–21°C | Lactoferrin (concentration) | – | 55.78 | (58) | |
| 100 MPa, 10 min; interval 10 min; 600 MPa, 10 min, 19–21°C | Lactoferrin (concentration) | – | 57.63 | (58) | |
| 200 MPa, 10 min; interval, 10 min; 600 MPa, 10 min, 19–21°C | Lactoferrin (concentration) | – | 64.75 | (58) | |
| 425 MPa, 4 cycles, 6 min each, 4°C | Lactoferrin (concentration) | 2.4 mg/mL | 66.67 | (62) | |
| 200 MPa, 10 min; interval 10 min; 400 MPa, 10 min, 19–21°C | Lactoferrin (concentration) | – | 78.77 | (58) | |
| 425 MPa, 4 cycles, 6 min each, 37°C | Lactoferrin (concentration) | 2.4 mg/mL | 83.33 | (62) | |
| 400 MPa, 5 min, 25°C | Lactoferrin (concentration) | – | 86.8 ± 10.3 | (61) | |
| 400 MPa, 5 min, 25°C | Lactoperoxidase (LPO) (activity) | – | 91.4 ± 6.02 | (61) | |
| 425 MPa, 4 cycles, 6 min each, 37°C | Lipase (concentration) | – | 65 | (62) | |
| 400 MPa, 5 min, 25°C | Lipoprotein lipase (LPL) (activity) | – | 103 ± 4.76 | (61) | |
| 425 MPa, 4 cycles, 6 min each, 4°C | Lysozyme (activity) | – | 94 | (62) | |
| 400 MPa, 120 min | Lysozyme (activity) | 2254.7 ± 207.9 units/mg solid | 95.80 | (63) | |
| 400 MPa, 60 min | Lysozyme (activity) | 2254.7 ± 207.9 units/mg solid | 96.30 | (63) | |
| 400 MPa, 90 min | Lysozyme (activity) | 2254.7 ± 207.9 units/mg solid | 96.30 | (63) | |
| 425 MPa, 4 cycles, 6 min each, 37°C | Lysozyme (activity) | – | 98 | (62) | |
| 400 MPa, 30 min | Lysozyme (activity) | 2254.7 ± 207.9 units/mg solid | 106.90 | (63) | |
| 400 MPa, 5 min, 25°C | Lysozyme (activity) | – | 119 ± 8.86 | (61) | |
| 500 MPa, 8 min, 4°C | Total vitamin C | 15 ± 12 mg/L | 24.67 | (59) | |
| 350 MPa, 8 min, 16.5°C | True protein | 1.0 (0.7, 1.2) g/dL | 100 | (49) | |
| 350 MPa, 10 min, 16.5°C | True protein | 1.0 (0.7, 1.2) g/dL | 100 | (49) | |
| 500 MPa, 8 min, 18.8°C | True protein | 1.0 (0.7, 1.2) g/dL | 100 | (49) | |
| 500 MPa, 10 min, 18.8°C | True protein | 1.0 (0.7, 1.2) g/dL | 100 | (49) | |
| 600 MPa, 8 min, 21.5°C | True protein | 1.0 (0.7, 1.2) g/dL | 100 | (49) | |
| 600 MPa, 10 min, 21.5°C | True protein | 1.0 (0.7, 1.2) g/dL | 100 | (49) | |
| UV radiation | 254 nm, 40 min, 740 J/L | Vitamin C | 34.5 ± 3.67 mg/L | 64.60 | (52) |
| 253.7 nm, 1.1 W, 2084 J/L | Alkaline Phosphatase (ALP) (activity) | 0.200 ± 0.050 U/mL | 99.50 | (72) | |
| 253.7 nm, 1.1 W, 3474 J/L | Alkaline Phosphatase (ALP) (activity) | 0.200 ± 0.050 U/mL | 99.50 | (72) | |
| 253.7 nm, 1.1 W, 4863 J/L | Alkaline Phosphatase (ALP) (activity) | 0.200 ± 0.050 U/mL | 102.00 | (72) | |
| 250 nm, 25 min | Ascorbic acid | 14 ± 11.2 mg/L | 20.71 | (59) | |
| 254 nm, 1.1 W, 33,000 J/L | Bile Salt Stimulated Lipase (BSSL) (activity) | 9.4 U/mL | 20 | (60) | |
| 254 nm, 1.1 W, 16,500 J/L | Bile Salt Stimulated Lipase (BSSL) (activity) | 9.4 U/mL | 35.50 | (60) | |
| 254 nm, 1.1 W, 5,500 J/L | Bile Salt Stimulated Lipase (BSSL) (activity) | 9.4 U/mL | 69.15 | (60) | |
| 254 nm, 1.1 W, 1,100 J/L | Bile Salt Stimulated Lipase (BSSL) (activity) | 9.4 U/mL | 88.30 | (60) | |
| 253.7 nm, 1.1 W, 2084 J/L | Bile Salt Stimulated Lipase (BSSL) (activity) | 116.5 ± 36.6 U/mL | 96.74 | (72) | |
| 253.7 nm, 1.1 W, 3474 J/L | Bile Salt Stimulated Lipase (BSSL) (activity) | 116.5 ± 36.6 U/mL | 97.51 | (72) | |
| 253.7 nm, 1.1 W, 4863 J/L | Bile Salt Stimulated Lipase (BSSL) (activity) | 116.5 ± 36.6 U/mL | 98.97 | (72) | |
| 250 nm, 25 min | Carbohydrate | 69 ± 3 g/L | 100 | (59) | |
| 254 nm, 30 min, 544 J/L | Catalase (activity) | 18.4 ± 1.17 nmol/ min mL | 85.30 | (52) | |
| 254 nm, 5 min, 85 J/L | Catalase (activity) | 18.4 ± 1.17 nmol/ min mL | 96.80 | (52) | |
| 250 nm, 25 min | Crude protein | 10 ± 2 g/L | 110.00 | (59) | |
| 250 nm, 25 min | Energy | 616 ± 72 kcal/L | 99.03 | (59) | |
| 250 nm, 25 min | Fat | 31 ± 8 g/L | 100 | (59) | |
| 250 nm, 25 min | Folate (concentration) | 191 ± 83 nmol/L | 74.87 | (59) | |
| 253.7 nm, 1.1 W, 4683 J/L | Lactoferrin (concentration) | – | 87 ± 11 | (68) | |
| 253.7 nm, 1.1 W, 3474 J/L | Lactoferrin (concentration) | – | 93 ± 10 | (68) | |
| 253.7 nm, 1.1 W, 2084 J/L | Lactoferrin (concentration) | – | 95 ± 6 | (68) | |
| 254 nm, 5 min, 85 J/L | Lipid peroxidase | 10.8 ± 1.25 nM/mL | 99.10 | (52) | |
| 254 nm, 40 min, 740 J/L | Lysozyme (concentration) | 152.9 ± 14.89 μg/ mL | 59.10 | (52) | |
| 254 nm, 30 min, 544 J/L | Lysozyme (concentration) | 152.9 ± 14.89 μ/mL | 61.00 | (52) | |
| 254 nm, 20 min, 355 J/L | Lysozyme (concentration) | 152.9 ± 14.89 μg/mL | 70.20 | (52) | |
| 254 nm, 10 min, 173 J/L | Lysozyme (concentration) | 152.9 ± 14.89 μg/mL | 91.60 | (52) | |
| 254 nm, 5 min, 85 J/L | Lysozyme (concentration) | 152.9 ± 14.89 μg/mL | 105.80 | (52) | |
| 253.7 nm, 1.1 W, 4683 J/L | Lysozyme (concentration) | – | 75 ± 9 | (68) | |
| 253.7 nm, 1.1 W, 3474 J/L | Lysozyme (concentration) | – | 84 ± 10 | (68) | |
| 253.7 nm, 1.1 W, 2084 J/L | Lysozyme (concentration) | – | 91 ± 7 | (68) | |
| 253.7 nm, 1.1 W, 4683 J/L | Secretory IgA (sIgA) (concentration) | – | 89 ± 4 | (68) | |
| 253.7 nm, 1.1 W, 3474 J/L | Secretory IgA (sIgA) (concentration) | – | 94 ± 4 | (68) | |
| 253.7 nm, 1.1 W, 2084 J/L | Secretory IgA (sIgA) (concentration) | – | 95 ± 5 | (68) | |
| 254 nm, 5 min, 85 J/L | Thiobarbituric acid reactive substances (TBARS) | 37.1 ± 4.60 μg MDA/ 100 mL | 102.70 | (52) | |
| 254 nm, 10 min, 173 J/L | Thiobarbituric acid reactive substances (TBARS) | 37.1 ± 4.60 μg MDA/ 100 mL | 109.20 | (52) | |
| 254 nm, 20 min, 355 J/L | Thiobarbituric acid reactive substances (TBARS) | 37.1 ± 4.60 μg MDA/ 100 mL | 112.40 | (52) | |
| 254 nm, 30 min, 544 J/L | Thiobarbituric acid reactive substances (TBARS) | 37.1 ± 4.60 μg MDA/ 100 mL | 125.30 | (52) | |
| 254 nm, 40 min, 740 J/L | Thiobarbituric acid reactive substances (TBARS) | 37.1 ± 4.60 μg MDA/ 100 mL | 135.30 | (52) | |
| 254 nm, 40 min, 740 J/L | Total antioxidant capacity (TAC) | 23.1 ± 2.81 mg TE/ 100 mL | 100.90 | (52) | |
| 254 nm, 30 min, 544 J/L | Total antioxidant capacity (TAC) | 23.1 ± 2.81 mg TE/ 100 mL | 102.20 | (52) | |
| 254 nm, 5 min, 85 J/L | Total antioxidant capacity (TAC) | 23.1 ± 2.81 mg TE/ 100 mL | 103.90 | (52) | |
| 254 nm, 10 min, 173 J/L | Total antioxidant capacity (TAC) | 23.1 ± 2.81 mg TE/ 100 mL | 106.10 | (52) | |
| 254 nm, 20 min, 355 J/L | Total antioxidant capacity (TAC) | 23.1 ± 2.81 mg TE/ 100 mL | 106.50 | (52) | |
| 250 nm, 25 min | Total vitamin C | 15 ± 12 mg/L | 28.00 | (59) | |
| 254 nm, 30 min, 544 J/L | Vitamin C | 34.5 ± 3.67 mg/L | 73.60 | (52) | |
| 254 nm, 20 min, 355 J/L | Vitamin C | 34.5 ± 3.67 mg/L | 77.10 | (52) | |
| 254 nm, 10 min, 173 J/L | Vitamin C | 34.5 ± 3.67 mg/L | 85.20 | (52) | |
| 254 nm, 5 min, 85 J/L | Vitamin C | 34.5 ± 3.67 mg/L | 94.80 | (52) | |
| PEF | 15 kV, 6,000 pulses, 50 Hz (PEF-50) | Immunoglobulin A (IgA) (concentration) | – | 68 | (65) |
| 15 kV, 6,000 pulses, 20 Hz (PEF-20) | Immunoglobulin A (IgA) (concentration) | – | 108 | (65) | |
| 15 kV, 6,000 pulses, 50 Hz (PEF-50) | Lactoferrin (concentration) | – | 52 | (65) | |
| 15 kV, 6,000 pulses, 20 Hz (PEF-20) | Lactoferrin (concentration) | – | 74 | (65) | |
| 15 kV, 6,000 pulses, 20 Hz (PEF-20) | Lactoperoxidase (LPO) (activity) | – | >60 | (65) | |
| 15 kV, 6,000 pulses, 50 Hz (PEF-50) | Lactoperoxidase (LPO) (activity) | – | >60 | (65) | |
| 15 kV, 6,000 pulses, 20 Hz (PEF-20) | Lysozyme (activity) | – | 76 | (65) | |
| 15 kV, 6,000 pulses, 50 Hz (PEF-50) | Lysozyme (activity) | – | 80 | (65) | |
| 15 kV, 6,000 pulses, 20 Hz (PEF-20) | Xanthine oxidase (activity) | – | 100 | (65) | |
| 15 kV, 6,000 pulses, 50 Hz (PEF-50) | Xanthine oxidase (activity) | – | 100 | (65) |
HPP, High-Pressure Processing; PEF, Pulsed Electric Fields.
From a microbiological perspective, the most frequently reported microorganisms were Staphylococcus aureus (ATCC 6538), Staphylococcus aureus (ATCC 25923), Hepatitis A virus (HAV), Cytomegalovirus [in the form of Cytomegalovirus (CMV) and Cytomegalovirus (CMV) (AD169)], Enterococcus [in the form of Enterococcus faecalis (ATCC 29212), Enterococcus faecalis (PCM 896), Enterococcus faecium (ATCC 6057), Enterococcus faecium (ATCC 8459) and Enterococcus spp.], as well as Escherichia coli [in the form of E. coli (ATCC 25922), E. coli (CIVO.B.0505) and E. coli (K-12)]. It is hypothesized that the study of these microorganisms is relevant because they are species commonly found in HBM as contaminants from the mother’s epidermis or frequent parasites of the milk.
On the other hand, the nutritional and bioactive compounds in HBM more frequently reported were: lactoferrin concentration, lysozyme concentration, lysozyme activity, immunoglobulin A (IgA), immunoglobulin G (IgG), crude proteins content, carbohydrate content, and the bile salt stimulated lipase (BSSL) activity, which aids in the digestion of lipids by newborn babies (60). Almost all these components have effects in developing crucial characteristics and protecting infants against infection. Also, being predominantly proteins, they are sensitive to heat.
Thermal processes for breast milk preservation
Holder Pasteurization (HoP)
Holder Pasteurization (HoP) operates on the principle of heating at a moderate temperature over a sustained period (73). When applied to HBM, the milk is gently raised to about 62.5°C and maintained at that temperature for 30 min. The main aim of HoP is to eradicate harmful microorganisms while minimizing any detrimental impact on the vital nutritional and bioactive elements in breast milk (73); however, its prolonged duration could reduce heat-sensitive components, potentially altering milk’s nutritional composition.
Additionally, while HoP is effective against several pathogens, it might not match the inactivation level achieved by higher-temperature methods. The milk’s initial microbial load is critical in determining HoP effectiveness, emphasizing the need for rigorous quality control measures (74).
Its foundational role in food, biotechnology, and infant care requires a comprehensive understanding of its benefits and challenges. Such insights inform the optimization of HoP and highlight its continued importance in infant nutrition and health (75).
High-Temperature Short-Time Pasteurization (HTST)
The High-Temperature Short-Time (HTST) method represents a transformative milestone in dairy processing. Introduced in the early 20th century to address the constraints of traditional pasteurization, HTST employs higher temperatures for faster processing. It employs metal plates and hot water to elevate milk temperature quickly, followed by rapid cooling. This method has a crucial role in contemporary food preservation (76).
Central to HTST’s effectiveness is its use of elevated temperatures compared to HoP. Exposing HBM to approximately 72°C for about 15 s swiftly eradicates pathogens without significantly altering its sensory and nutritional attributes.
The technique’s speed and ability to maintain the integrity of HBM are its distinct benefits, positioning it as ideal for large-scale production (77). The short heat exposure better preserves sensitive nutrients and bioactive compounds within HBM, retaining significantly higher levels of immunoglobulins and lactoferrin than traditional pasteurization (78, 79).
However, potential drawbacks include the possibility of protein denaturation, potentially affecting their nutritional quality. While effective against many pathogens, HTST may only comprehensively address some types. The swiftness of HTST might also pose concerns regarding its adaptability to varying microbial challenges (78).
Effect of thermal processes on breast milk microbiological load
According to Table 3 (47–50, 52, 53), HoP can decrease the load of Staphylococcus aureus (ATCC 6538) in at least 4.9 logarithmic (4.9-log10) cycles, achieving reductions even more significant than 7-log10. For Staphylococcus aureus (ATCC 25923), HoP could reduce the microorganism charge by more than 7-log10. For Enterococcus in the form of Enterococcus faecalis (ATCC 29212), Enterococcus faecalis (PCM 896), Enterococcus faecium (ATCC 6057), and Enterococcus spp., this technique has shown a logarithmic reduction from 3.92-log10 up to total elimination, being Enterococcus faecalis (PCM 896) the most thermoresistant. After HoP, Escherichia coli has shown reductions higher than 7-log10. In terms of viral inactivation, HoP has shown to be capable of decreasing from >0.9-log10 to completely inactivate Cytomegalovirus, while it has achieved a 3.9-log10 decrease in Hepatitis A virus (HAV). Among the few studies evaluating HBM processing methods on spore-forming microorganisms, one significant is reference (47), which compares the effect of HPP and HoP on Bacillus cereus. The study found that while HoP achieved a 2.62 log CFU/mL reduction in B. cereus, HPP was more effective, yielding a 6.93 log CFU/mL reduction. This highlights HPP superior capability in mitigating spore-forming bacteria compared to HoP, which, altogether with HTST (thermal-based treatments) struggle to effectively neutralize bacterial spores. These spores can survive thermal pasteurization and potentially grow at refrigeration temperatures, posing significant food safety concerns, especially in low-acid foods like milk in the context of HBM (47).
HTST has shown a reduction between 2.4 to more than 4.9-log10 for Staphylococcus aureus (ATCC 6538) and an inactivation higher than 5.15-log10 for Staphylococcus aureus (ATCC 25923) at the conditions shown in Table 3. For Enterococcus faecalis (ATCC 29212), HTST can achieve an inactivation between 1.1 and higher than 5.1-log10, depending on the conditions described in Table 3. After HTST, Escherichia coli (ATCC 25922) and Escherichia coli (CIVO.B.0505) decreased by 6.07 and 32-log10, respectively. HTST can also inactivate CMV and reduce it by more than 2-log10 at conditions specified in Table 3 (50, 55–57).
It can be concluded that Holder Pasteurization and HTST (48, 50, 53, 55, 57) were able to achieve the previously mentioned required conditions for microbiological safety in HMB for Enterococcus faecalis (ATCC 29212), Enterococcus spp., Escherichia coli (ATCC 25922), Staphylococcus aureus (ATCC 25923), Staphylococcus aureus (ATCC 6538), and Cytomegalovirus.
Effect of thermal processes on breast milk functional components
As shown in Table 4, HoP could only retain between 10% and 20% of lactoferrin’s content, offering high retention (40%–60%) in some cases. On the other hand, lysozyme concentration and activity showed retentions of between 35% and 85%, while Giribaldi et al. achieved complete retention (56). Other authors (Table 4) have reported a 66% mean retention of IgA content, and a similar retention, 61%, of IgG content. Crude protein and carbohydrate content were not affected after this treatment, while only 0%–1.5% of BSSL activity was retained after the HoP application (48, 49, 56, 58–63, 65–69).
Table 4.
Effect of thermal processes applied for breast milk preservation on bioactive and nutritional components.
| Applied treatment | Process conditions | Bioactive or nutritional components | Initial content | Percentage of retention | Reference |
|---|---|---|---|---|---|
| HoP | 62.5°C, 30 min | Adiponectin | – | 67.21 | (58) |
| 62.5°C, 30 min. After heating: placed in water at 4°C for 1 h | Ascorbic acid | 14 ± 11.2 mg/L | 38.57 | (59) | |
| 62.5°C, 30 min | Bile Salt Stimulated Lipase (BSSL) (activity) | 145 ± 22 μmol/mL/min | 0.06 | (56) | |
| 63°C, 30 min. After heating: ice bath to quickly cool the milk to 4°C | Bile Salt Stimulated Lipase (BSSL) (activity) | 9.4 U/mL | 0.30 | (60) | |
| 62.5°C, 30 min | Bile Salt Stimulated Lipase (BSSL) (activity) | – | 1.42 ± 0.68 | (61) | |
| 63 ± 0.5°C, 30 min. After heating: cooled with water at 20°C | Bile Salt Stimulated Lipase (BSSL) (concentration) | 1804.5 ± 581.7 U/L | 0.40 | (48) | |
| 62.5°C, 30 min. After heating: placed in water at 4°C for 1 h | Bile Salt Stimulated Lipase (BSSL) (concentration) | – | <1 | (59) | |
| 62.5°C, 30 min. After heating: placed in water at 4°C for 1 h | Carbohydrate | 69 ± 3 g/L | 100 | (59) | |
| 63°C, 30 min. After heating: 4°C | Carbohydrate | 8.1 (8.0, 8.2) g/dL | 101.23 | (49) | |
| 62.5°C, 30 min | Catalase (activity) | 17.0 ± 1.56 nmol/ min mL | ~43 | (52) | |
| 64°C, 30 min. After heating: 4°C | Crude protein | 1.3 (0.9, 1.5) g/dL | 100 | (49) | |
| 62.5°C, 30 min. After heating: placed in water at 4°C for 1 h | Crude protein | 10 ± 2 g/L | 110 | (59) | |
| 62.5°C, 30 min. After heating: submerged for 60 min in an ice-cold bath | Cytokine IL-8 (concentration) | 119.0 (106.1–123.19) pg./mL | 166.05 | (62) | |
| 62.5°C, 30 min. After heating: submerged for 60 min in an ice-cold bath | Cytokine IP-10 (concentration) | 30.9 (30.3–35.4) pg./mL | 115.21 | (62) | |
| 62.5°C, 30 min. After heating: submerged for 60 min in an ice-cold bath | Cytokine MCP-1 (concentration) | 524.2 (410.9–688.0) pg./mL | 82.88 | (62) | |
| 62.5°C, 30 min. After heating: submerged for 60 min in an ice-cold bath | Cytokine MIG (concentration) | 25.7 (19.4–29.3) pg./mL | 114 | (62) | |
| 62.5°C, 30 min. After heating: submerged for 60 min in an ice-cold bath | Cytokine TGF- β2 (concentration) | 844.7 (671.9–956.8) pg./mL | 83.26 | (62) | |
| 62.5°C, 30 min. After heating: placed in water at 4°C for 1 h | Energy | 616 ± 72kcal/L | 99.51 | (59) | |
| 65°C, 30 min. After heating: 4°C | Energy | 67 (63, 64) Kcal/dL | 100 | (49) | |
| 66°C, 30 min. After heating: 4°C | Fat | 3.3 (2.8, 3.8) g/dL | 93.93 | (49) | |
| 62.5°C, 30 min. After heating: placed in water at 4°C for 1 h | Fat | 31 ± 8 g/L | 100 | (59) | |
| 62.5°C, 30 min. After heating: placed in water at 4°C for 1 h | Folate (concentration) | 191 ± 83 nmol/L | 72.77 | (59) | |
| 62.5°C, 30 min | Hepatocyte growth factor (HGF) | – | 11.28 | (58) | |
| 62.5°C, 30 min. After heating: cooled in ice slurry | Immunoglobulin A (IgA) (activity) | 0.900 mg/mL | 51.20 | (63) | |
| 62.5°C, 30 min After heating: cooled immediately in an ice water bath | Immunoglobulin A (IgA) (concentration) | – | 49 | (65) | |
| 62.7–64.8°C, 42 min | Immunoglobulin A (IgA) (concentration) | – | 53.70 | (66) | |
| 62.6–62.9°C, 31 min | Immunoglobulin A (IgA) (concentration) | – | 71.30 | (66) | |
| 62.5°C, 30 min. After heating: rapidly cooled in an ice bath | Immunoglobulin A (IgA) (concentration) | 338.45 ± 27.03 μg/mL | 72.05 | (67) | |
| 63 ± 0.5°C, 30 min. After heating: cooled with water at 20°C | Immunoglobulin A (IgA) (concentration) | 51.7 ± 28.3 mg/dL | 83 | (48) | |
| 62.5°C, 30 min | Immunoglobulin A (IgA) (concentration) | – | 48.5 ± 6.13 | (61) | |
| 62.5°C, 30 min | Immunoglobulin G (IgG) (concentration) | – | 50.96 | (58) | |
| 62.5°C, 30 min. After heating: submerged for 60 min in an ice-cold bath | Immunoglobulin G (IgG) (concentration) | 21.2 μg/mL | 67 | (62) | |
| 62.5°C, 30 min | Insulin | – | 67.60 | (58) | |
| 62.5°C, 30 min. After heating: submerged for 60 min in an ice-cold bath | Lactoferrin (concentration) | 2.4 mg/mL | 15 | (62) | |
| 62.7–64.8°C, 42 min | Lactoferrin (concentration) | – | 16.00 | (66) | |
| 62.5°C, 30 min. After heating: cooled immediately in an ice water bath | Lactoferrin (concentration) | – | 20 | (65) | |
| 63 ± 0.5°C, 30 min. After heating: cooled with water at 20°C | Lactoferrin (concentration) | 10.7 ± 15.1 mg/mL | 20 | (48) | |
| 62.6–62.9°C, 31 min | Lactoferrin (concentration) | – | 21.60 | (66) | |
| 62.5°C, 30 min | Lactoferrin (concentration) | – | 39.69 | (58) | |
| 67°C, 30 min. After heating: 4°C | Lactoferrin (concentration) | – | 65 | (49) | |
| 62.5°C, 30 min | Lactoferrin (concentration) | – | 20.0 ± 4.34 | (61) | |
| 62.5°C, 30 min. After heating: immediately cool down in an ice bath until the temperature reached 4°C. | Lactoferrin (concentration) | 3.00 ± 0.83 g/L | 9 ± 4 | (68) | |
| 62.5°C, 30 min. After heating: cooled immediately in an ice water bath | Lactoperoxidase (LPO) (activity) | – | 6 | (65) | |
| 62.5°C, 30 min | Lactoperoxidase (LPO) (activity) | – | <20 | (61) | |
| 62.5°C, 30 min | Leptin | – | 22.14 | (58) | |
| 62.5°C, 30 min. After heating: submerged for 60 min in an ice-cold bath | Lipase (concentration) | – | 47 | (62) | |
| 62.5°C, 30 min | Lipid peroxidase | 26.7 ± 1.74 nM/mL | 76 | (52) | |
| 62.5°C, 30 min | Lipoprotein lipase (LPL) (activity) | – | 14.2 ± 2.69 | (61) | |
| 62.5°C, 30 min. After heating: cooled immediately in an ice water bath | Lysozyme (activity) | – | 35 | (65) | |
| 62.5°C, 30 min | Lysozyme (activity) | 7,969 ± 1,394 U/mL | 54 | (69) | |
| 62.5°C, 30 min. After heating: cooled in ice slurry |
Lysozyme (activity) | – | 60.50 | (63) | |
| 62.5°C, 30 min. After heating: submerged for 60 min in an ice-cold bath |
Lysozyme (activity) | – | 63 | (62) | |
| 62.5°C, 30 min | Lysozyme (activity) | 50.2 ± 0.2 U/μL | 104.18 | (56) | |
| 62.5°C, 30 min | Lysozyme (activity) | – | 35.2 ± 2.95 | (61) | |
| 63 ± 0.5°C, 30 min. After heating: cooled with water at 20°C |
Lysozyme (concentration) | 59.5 ± 37.9 μg/mL | 65 | (48) | |
| 62.7–64.8°C, 42 min | Lysozyme (concentration) | – | 74.40 | (66) | |
| 62.6–62.9°C, 31 min | Lysozyme (concentration) | – | 84.20 | (66) | |
| 62.5°C, 30 min | Lysozyme (concentration) | 140.8 ± 9.46 μg/mL | ~53 | (52) | |
| 62.5°C, 30 min. After heating: immediately cool down in an ice bath until the temperature reaches 4°C. |
Lysozyme (concentration) | 0.024 ± 0.015 g/L | 41 ± 14 | (68) | |
| 62.5°C, 30 min | Secretory IgA (sIgA) (activity) | 1.04 ± 0.09 mg active sIgA/mL | 87 | (69) | |
| 62.5°C, 30 min | Secretory IgA (sIgA) (concentration) | – | 46.3 ± 13.2 | (56) | |
| 62.5°C, 30 min. After heating: immediately cool down in an ice bath until the temperature reaches 4°C. |
Secretory IgA (sIgA) (concentration) | 3.45 ± 0.70 g/L | 49 ± 3 | (68) | |
| 62.5°C, 30 min | Thiobarbituric acid reactive substances (TBARS) | 35.8 ± 7.78 μg MDA/ 100 mL | ~108.6 | (52) | |
| 62.5°C, 30 min | Total antioxidant capacity (TAC) | 40.5 ± 5.44 mg TE/100 mL | 95.80 | (52) | |
| 62.5°C, 30 min. After heating: placed in water at 4°C for 1 h |
Total vitamin C | 15 ± 12 mg/L | 36 | (59) | |
| 68°C, 30 min. After heating: 4°C |
True Protein | 1.0 (0.7, 1.2) g/dL | 100 | (49) | |
| 62.5°C, 30 min | Vitamin C | 53.1 ± 5.29 mg/L | ~60 | (52) | |
| 62.5°C, 30 min | Xanthine oxidase (XO) (activity) | – | <20 | (61) | |
| HTST | 72°C, 15 s | Bile Salt Stimulated Lipase (BSSL) (activity) | 145 ± 22 μmol/mL/min | 0.17 | (56) |
| 62°C, 5 s. After heating: rapidly cooled with water at 14°C |
Bile Salt Stimulated Lipase (BSSL) (concentration) | 1804.5 ± 581.7 U/L | 0.80 | (48) | |
| 71°C, 9 s, 12.3 mL/min | Immunoglobulin A (IgA) (concentration) | – | 74 | (57) | |
| 71°C, 5.8 s, 18.9 mL/min | Immunoglobulin A (IgA) (concentration) | – | 82.80 | (57) | |
| 62°C, 5 s. After heating: rapidly cooled with water at 14°C |
Immunoglobulin A (IgA) (concentration) | 51.6 ± 28.3 mg/dL | 95 | (48) | |
| 72.8°C, 9 s | Immunoglobulin G (IgG) (concentration) | – | 57.30 | (57) | |
| 71°C, 9 s, 12.3 mL/min | Immunoglobulin G (IgG) (concentration) | – | 75 | (57) | |
| 71°C, 5.8 s, 18.9 mL/min | Immunoglobulin G (IgG) (concentration) | – | 79.10 | (57) | |
| 72.8°C, 9 s | Immunoglobulin M (IgM) (concentration) | – | 52.20 | (57) | |
| 71°C, 9 s, 12.3 mL/min | Immunoglobulin M (IgM) (concentration) | – | 68 | (57) | |
| 71°C, 5.8 s, 18.9 mL/min | Immunoglobulin M (IgM) (concentration) | – | 72.06 | (57) | |
| 62°C, 5 s. After heating: rapidly cooled with water at 14°C |
Lactoferrin (concentration) | 10.7 ± 15.1 mg/mL | 32 | (48) | |
| 72°C, 15 s | Lysozyme (activity) | 50.2 ± 0.2 U/μL | 97.21 | (56) | |
| 62°C, 5 s. After heating: rapidly cooled with water at 14°C |
Lysozyme (concentration) | 59.5 ± 37.9 μg/mL | 72 | (48) | |
| 72°C, 15 s | Secretory IgA (sIgA) (concentration) | – | 78.9 ± 2.4 | (56) |
HoP, Holder Pasteurization; HTST, High-Temperature Short-Time Pasteurization.
Similarly, HTST could retain 32% of lactoferrin’s content, as shown in Table 4. Lysozyme concentration and activity were retained by 72% and 97%, respectively, while IgA and IgG content reported a mean of 84% and 70% of retention, respectively. The study did not report the crude protein and carbohydrate content. Like the results observed in HoP, almost none of the BSSL activity was retained, which confirms the thermosensitivity of this molecule (48, 56, 57). In contrast, another study indicated that gangliosides remain unaffected after HTST treatment. This suggests that gangliosides do not exhibit thermal lability (32).
In general, thermal technologies that use heat flow to increase temperature as a mechanism for microorganism inactivation show a very low ability to retain bioactive components, specifically proteins, such as lactoferrin, lysozyme, and BSSL.
Even though the data show that some improvements in methodology can increase the retention of relevant compounds in HBM, the conclusion is solid: the higher the temperature associated with more extensive time lapses, the lower the retention of bioactive components in HBM.
Non-thermal processes for breast milk treatment
High-Pressure Processing (HPP)
High-Pressure Processing (also known as ultrahigh-pressure processing and high hydrostatic pressure processing) is a novel technology that assures food safety and retains quality. As an alternative to traditional thermal food preservation methods, HPP can produce pasteurized products without the extensive loss of quality often associated with heating. The process uses high hydrostatic pressures, typically 100 to 1,000 MPa, and can be combined with heat for brief durations (80, 81). HPP can extend a product’s shelf life and guarantee its safety upon consumption by inactivating enzymes, pathogens, and spoilage organisms at room temperature (80, 81).
Unlike thermal methods, foods treated with HPP often have superior acceptance rates and enhanced sensory quality. This is attributed mainly to HPP’s gentle nature (it primarily affects only weak chemical bonds, thereby preserving vital components related to color, flavor, and nutrition). Additionally, many proteins, vitamins, and bioactive compounds crucial for infants (providing vital properties, such as protection against pathogens, strengthening the microbiota, and fostering proper intestinal development) are barostable, thus unaffected by this process (63, 64, 80, 82).
This method consists, in general, of three steps: (1) the time required to reach the desired pressure (come-up time -CUT-), (2) the period while desired pressure is maintained, called holding time, and (3) the stage when pressure is withdrawn, called depressurization. This technique operates under the following guiding physical principles: (1) Le Chatelier’s principle, which states that if pressure undergoes any change, the process will turn its direction to minimize the effects in the equilibrium state, affecting volume; in practical terms, increasing pressure intensifies any processes associated with volume reduction, (2) the isostatic principle that postulates that pressure acts equally in all directions when it is uniformly applied, meaning that pressure and its effect is immediately and homogenously distributed independently of the size and shape of the sample, (3) the principle of microscopic ordering, which says that the degree of molecular organization of a given substance rises with increasing pressure at constant temperature; as a result, pressure and temperature could have antagonistic effects in food treatment (83), and (4) the Arrhenius relationship, which, similar to thermal processing, states that some reaction speeds during HPP are also influenced by thermal effects. The overall pressure-thermal effects may be additive, antagonistic, or synergistic. It becomes relevant to recognize that hydrostatic pressure modifies interatomic distances, impacting interactions contingent on bond lengths (80, 81).
UV radiation
UV radiation offers a non-thermal alternative for pasteurization, particularly suitable for HBM. This method uses wavelengths between 100 and 400 nm, divided into three categories based on their physicochemical attributes and biological impacts: UV-A (315 nm to 400 nm), UV-B (280 nm to 315 nm), and UV-C (200 nm to 280 nm) (84). The principle behind this cost-effective process is the germicidal effectiveness of ultraviolet light, which when applied appropriately can penetrate the fluid. The key factors influencing its efficiency are power, wavelength and treatment duration. Although UV-C has limited ability to penetrate dense and opaque liquids, adjusting the flow rate can enhance the process in terms of deactivating microorganisms. Furthermore, creating turbulent flow can result in reduced microbial load (85). Its application aids in extending the shelf life of perishable foods, with UV-C predominantly utilized in food and medical industries due to its pronounced disinfecting properties (72).
Thus, while UV-C radiation has established its relevance in food and medicine, its application to HBM necessitates a thorough evaluation. Striking the right balance between disinfection and nutrient preservation is pivotal for optimizing both the safety and nutritional value intended for infant nutrition (86).
Pulsed Electric Fields (PEF)
PEF technology presents a novel non-thermal technique for pasteurization with specific implications for HBM. By applying short, high-intensity electric pulses to the targeted sample, PEF alters the permeability of microorganisms’ cell membranes, effectively leading to their inactivation (87).
One of its notable strengths is in preserving the milk’s sensory properties of color and flavor, as well as its nutritional composition (88), which is attributed mainly to its reduced reliance on heat compared to traditional pasteurization techniques.
However, a pertinent consideration with PEF is the potential and inadvertent temperature increases within the milk due to potential ohmic heating effects. While PEF is fundamentally a non-thermal process, incidental ohmic heating effects could trigger lipid oxidation, undermining milk quality and nutritional value (87). Furthermore, PEF has been observed to affect the structure of proteins and amino acids, particularly those linked by weaker bonds, such as disulfide bonds, hydrogen bonds, and hydrophobic interactions (89). More specifically, PEF tends to promote the formation of disulfide bonds, the primary covalent linkages appearing in protein aggregates as an outcome of this treatment. PEF can influence protein structures through hydrophobic interactions and thiol or disulfide reactions, altering protein thermal stability and susceptibility to enzymatic degradation (90).
Effect of non-thermal processes on breast milk microbiological load
HPP has shown the ability to decrease by 5-log to 8.1-log the species of Staphylococcus aureus (ATCC 25923), Staphylococcus aureus (ATCC 6538), and Staphylococcus aureus sub. aureus. Escherichia coli (ATCC 25922) showed reductions by 6-log according to data reported in Table 5 (47, 53, 70, 71). HPP can also decrease virus amounts, with Cytomegalovirus and Hepatitis A dropping by 0.9-log and 4-log, respectively (49).
Table 5.
Effect of non-thermal processes applied for pathogen reduction on breast milk.
| Applied treatment | Process conditions | Microorganism or pathogen | Log10 reductions | Initial load | UnitsA-D | Reference |
|---|---|---|---|---|---|---|
| HPP | 593.96 MPa, 233 s, 24.8°C | Bacillus cereus (vegetative) | 6.93 | 107 | CFU/mL | (47) |
| 350 MPa, 5 min, 4 cycles, 38°C | Bacillus cereus spores (ATCC 14579) | 4.9 | 7.94×10⁴ | CFU/mL | (70) | |
| 350 MPa, 8 min, 16.5°C | Cytomegalovirus (CMV) | >0.9 | 3.16×10³ | PFU/mL | (49) | |
| 350 MPa, 10 min, 16.5°C | Cytomegalovirus (CMV) | >0.9 | 3.16×10³ | PFU/mL | (49) | |
| 500 MPa, 8 min, 18.8°C | Cytomegalovirus (CMV) | >0.9 | 3.16×10³ | PFU/mL | (49) | |
| 500 MPa, 10 min, 18.8°C | Cytomegalovirus (CMV) | >0.9 | 3.16×10³ | PFU/mL | (49) | |
| 600 MPa, 8 min, 21.5°C | Cytomegalovirus (CMV) | >0.9 | 3.16×10³ | PFU/mL | (49) | |
| 600 MPa, 10 min, 21.5°C | Cytomegalovirus (CMV) | >0.9 | 3.16×10³ | PFU/mL | (49) | |
| 600 MPa, 5 min, 20°C | Enveloped hepatitis E virus (eHEV) | 1.6 | 3.16×10⁴ | FFU/mL | (51) | |
| 350 MPa, 5 min, 4 cycles, 38°C | Enveloped hepatitis E virus (eHEV) | 0 | 3.16×10⁴ | FFU/mL | (51) | |
| 400 MPa, 5 min, 12°C | Enterobacteriaceae* | 0.48 | 3.00×101 | CFU/mL | (67) | |
| 500 MPa, 5 min, 12°C | Enterobacteriaceae* | 0.48 | 3.00×101 | CFU/mL | (67) | |
| 600 MPa, 5 min, 12°C | Enterobacteriaceae* | 0.48 | 3.00×101 | CFU/mL | (67) | |
| 400 MPa, 30 min, 21 to 31°C | Escherichia coli (ATCC 25922) | 6 | 108 | CFU/mL | (53) | |
| 350 MPa, 5 min, 4 cycles, 38°C | HCoV-229E | 1.4 | 106 | TCID50/mL | (51) | |
| 600 MPa, 5 min, 20°C | HCoV-229E | 1 | 106 | TCID50/mL | (51) | |
| 350 MPa, 8 min, 16.5°C | Hepatitis A virus (HAV) | >4 | 5.01×10⁵ | (49) | ||
| 350 MPa, 10 min, 16.5°C | Hepatitis A virus (HAV) | >4 | 5.01×10⁵ | (49) | ||
| 500 MPa, 8 min, 18.8°C | Hepatitis A virus (HAV) | >4 | 5.01×10⁵ | (49) | ||
| 500 MPa, 10 min, 18.8°C | Hepatitis A virus (HAV) | >4 | 5.01×10⁵ | (49) | ||
| 600 MPa, 8 min, 21.5°C | Hepatitis A virus (HAV) | >4 | 5.01×10⁵ | (49) | ||
| 600 MPa, 10 min, 21.5°C | Hepatitis A virus (HAV) | >4 | 5.01×10⁵ | (49) | ||
| 400 MPa, 2 min, 21 to 31°C | Listeria monocytogenes (ATCC 19115) | 8 | 108 | CFU/mL | (53) | |
| 600 MPa, 5 min, 20°C | Non-enveloped hepatitis E virus (neHEV) | 2.7 | 2.51×10⁶ | FFU/mL | (51) | |
| 350 MPa, 5 min, 4 cycles, 38°C | Non-enveloped hepatitis E virus (neHEV) | 0.3 | 2.51×10⁶ | FFU/mL | (51) | |
| 400 MPa, 30 min, 21 to 31°C | Staphylococcus aureus (ATCC 25923) | 8 | 108 | CFU/mL | (53) | |
| 350 MPa, 5 min, 4 cycles, 38°C | Staphylococcus aureus (ATCC 6538) | 5.7 | 5.01×10⁵ | CFU/mL | (70) | |
| 400 MPa, 30 min, 21 to 31°C | Staphylococcus aureus (ATCC 6538) | 6 | 108 | CFU/mL | (53) | |
| 500 MPa, 10 min, 50°C | Staphylococcus aureus (ATCC 6538) | 6.6 | 108 | CFU/mL | (71) | |
| 500 MPa, 15 min, 50°C | Staphylococcus aureus (ATCC 6538) | 8 | 108 | CFU/mL | (71) | |
| 500 MPa, 15 min, 4°C | Staphylococcus aureus (ATCC 6538) | ~5 | 108 | CFU/mL | (71) | |
| 500 MPa, 15 min, 20°C | Staphylococcus aureus (ATCC 6538) | ~5 | 108 | CFU/mL | (71) | |
| 593.96 MPa, 233 s, 24.8°C | Staphylococcus aureus sub. Aureus | 5.81 | 107 | CFU/mL | (47) | |
| 400 MPa, 4 min, 21 to 31°C | Streptococcus agalactiae (ATCC 12927) | 8 | 108 | CFU/mL | (53) | |
| 400 MPa, 5 min, 12°C | Total bacteria population* | 3.46 | 2.90×10⁴ | CFU/mL | (67) | |
| 500 MPa, 5 min, 12°C | Total bacteria population* | 3.46 | 2.90×10⁴ | CFU/mL | (67) | |
| 600 MPa, 5 min, 12°C | Total bacteria population* | 3.46 | 2.90×10⁴ | CFU/mL | (67) | |
| 500 MPa, 10 min, 20°C | Total microbial count* | 4.88 | 7.50×10⁴ | (71) | ||
| UV radiation | 1.1 W, 253.7 nm, 8.3 min, 105 g/L of total solid | Bacillus cereus (ATCC 10702) | 5 | 105 | CFU/mL | (68) |
| 1.1 W, 253.7 nm, 14.8 min, 125 g/L of total solid | Bacillus cereus (ATCC 10702) | 5 | 105 | CFU/mL | (68) | |
| 1.1 W, 253.7 nm, 26.5 min, 145 g/L of total solid | Bacillus cereus (ATCC 10702) | 5 | 105 | CFU/mL | (68) | |
| 254 nm, 400 rpm, 2,750 J/L | Bacillus subtilis spores (NRRL B-354, 356) | 2.75 | 108 | CFU/mL | (60) | |
| 254 nm, 400 rpm, 550 J/L | Bacillus subtilis spores (NRRL B-354, 356) | <1.0 | 108 | CFU/mL | (60) | |
| 254 nm, 400 rpm, 8,250 J/L | Bacillus subtilis spores (NRRL B-354, 356) | >5 | 108 | CFU/mL | (60) | |
| 254 nm, 400 rpm, 33,000 J/L | Bacillus subtilis spores (NRRL B-354, 356) | Below detection limit | 108 | CFU/mL | (60) | |
| 254 nm, 400 rpm, 550 J/L | Cronobacter sakazakii (ATCC BAA-894) | <1.0 | 108 | CFU/mL | (60) | |
| 254 nm, 400 rpm, 8,250 J/L | Cronobacter sakazakii (ATCC BAA-894) | >5 | 108 | CFU/mL | (60) | |
| 254 nm, 400 rpm, 2,750 J/L | Cronobacter sakazakii (ATCC BAA-894) | 3.64 to 4.82 | 108 | CFU/mL | (60) | |
| 254 nm, 400 rpm, 33,000 J/L | Cronobacter sakazakii (ATCC BAA-894) | Below detection limit | 108 | CFU/mL | (60) | |
| 1.1 W, 253.7 nm, 8.3 min, 105 g/L of total solid | Enterobacter cloacae (ATCC 27508) | 5 | 105 | CFU/mL | (68) | |
| 1.1 W, 253.7 nm, 14.8 min, 125 g/L of total solid | Enterobacter cloacae (ATCC 27508) | 5 | 105 | CFU/mL | (68) | |
| 1.1 W, 253.7 nm, 26.5 min, 145 g/L of total solid | Enterobacter cloacae (ATCC 27508) | 5 | 105 | CFU/mL | (68) | |
| 254 nm, 40 min, 740 J/L | Enterococcus faecalis (PCM 896) | 2.9 | 105 | CFU/mL | (52) | |
| 254 nm, 40 min, 740 J/L | Enterococcus faecium (ATCC 6057) | 3.95 | 105 | CFU/mL | (52) | |
| 254 nm, 400 rpm, 550 J/L | Enterococcus faecium (ATCC 8459) | <1.0 | 108 | CFU/mL | (60) | |
| 254 nm, 400 rpm, 8,250 J/L | Enterococcus faecium (ATCC 8459) | >5 | 108 | CFU/mL | (60) | |
| 254 nm, 400 rpm, 2,750 J/L | Enterococcus faecium (ATCC 8459) | 3.64 to 4.82 | 108 | CFU/mL | (60) | |
| 254 nm, 400 rpm, 33,000 J/L | Enterococcus faecium (ATCC 8459) | Below detection limit | 108 | CFU/mL | (60) | |
| 254 nm, 400 J/L | Escherichia coli (K-12) | Below detection limit | 105 | CFU/mL | (52) | |
| 254 nm, 700 J/L | Escherichia coli (K-12) | Below detection limit | 105 | CFU/mL | (52) | |
| 1.1 W, 253.7 nm, 8.3 min, 105 g/L of total solid | Escherichia coli K 12 (ATCC1498) | 5 | 105 | CFU/mL | (68) | |
| 1.1 W, 253.7 nm, 14.8 min, 125 g/L of total solid | Escherichia coli K 12 (ATCC1498) | 5 | 105 | CFU/mL | (68) | |
| 1.1 W, 253.7 nm, 26.5 min, 145 g/L of total solid | Escherichia coli K 12 (ATCC1498) | 5 | 105 | CFU/mL | (68) | |
| 254 nm, 400 rpm, 550 J/L | Listeria monocytogenes (ScottA, OSY-428, Ohio, California, ATCC 19115) | <1.0 | 108 | CFU/mL | (60) | |
| 254 nm, 400 rpm, 8,250 J/L | Listeria monocytogenes (ScottA, OSY-428, Ohio, California, ATCC 19115) | >5 | 108 | CFU/mL | (60) | |
| 254 nm, 400 rpm, 2,750 J/L | Listeria monocytogenes (ScottA, OSY-428, Ohio, California, ATCC 19115) | 3.64 to 4.82 | 108 | CFU/mL | (60) | |
| 254 nm, 400 rpm, 33,000 J/L | Listeria monocytogenes (ScottA, OSY-428, Ohio, California, ATCC 19115) | Below detection limit | 108 | CFU/mL | (60) | |
| 254 nm, 400 rpm, 2,750 J/L | Paenibacillus macerans spores (NRRL B-14029) | 2.75 | 108 | CFU/mL | (60) | |
| 254 nm, 400 rpm, 550 J/L | Paenibacillus macerans spores (NRRL B-14029) | <1.0 | 108 | CFU/mL | (60) | |
| 254 nm, 400 rpm, 8,250 J/L | Paenibacillus macerans spores (NRRL B-14029) | >5 | 108 | CFU/mL | (60) | |
| 254 nm, 400 rpm, 33,000 J/L | Paenibacillus macerans spores (NRRL B-14029) | Below detection limit | 108 | CFU/mL | (60) | |
| 254 nm, 400 rpm, 2,750 J/L | Paenibacillus polymyxa spores (NRRL B-510) | 2.75 | 108 | CFU/mL | (60) | |
| 254 nm, 400 rpm, 550 J/L | Paenibacillus polymyxa spores (NRRL B-510) | <1.0 | 108 | CFU/mL | (60) | |
| 254 nm, 400 rpm, 8,250 J/L | Paenibacillus polymyxa spores (NRRL B-510) | >5 | 108 | CFU/mL | (60) | |
| 254 nm, 400 rpm, 33,000 J/L | Paenibacillus polymyxa spores (NRRL B-510) | Below detection limit | 108 | CFU/mL | (60) | |
| 254 nm, 400 rpm, 550 J/L | Staphylococcus aureus (138-CPS and 146-CPS) | <1.0 | 108 | CFU/mL | (60) | |
| 254 nm, 400 rpm, 8,250 J/L | Staphylococcus aureus (138-CPS and 146-CPS) | >5 | 108 | CFU/mL | (60) | |
| 254 nm, 400 rpm, 2,750 J/L | Staphylococcus aureus (138-CPS and 146-CPS) | 3.64 to 4.82 | 108 | CFU/mL | (60) | |
| 254 nm, 400 rpm, 33,000 J/L | Staphylococcus aureus (138-CPS and 146-CPS) | Below detection limit | 108 | CFU/mL | (60) | |
| 1.1 W, 253.7 nm, 8.3 min, 105 g/L of total solid | Staphylococcus aureus (ATCC 6538) | 5 | 105 | CFU/mL | (68) | |
| 1.1 W, 253.7 nm, 14.8 min, 125 g/L of total solid | Staphylococcus aureus (ATCC 6538) | 5 | 105 | CFU/mL | (68) | |
| 1.1 W, 253.7 nm, 26.5 min, 145 g/L of total solid | Staphylococcus aureus (ATCC 6538) | 5 | 105 | CFU/mL | (68) | |
| 254 nm, 400 J/L | Staphylococcus aureus (PCM 2054) | Below detection limit | 105 | CFU/mL | (52) | |
| 254 nm, 700 J/L | Staphylococcus aureus (PCM 2054) | Below detection limit | 105 | CFU/mL | (52) | |
| 1.1 W, 253.7 nm, 8.3 min, 105 g/L of total solid | Staphylococcus epidermidis (ATCC 12228) | 5 | 105 | CFU/mL | (68) | |
| 1.1 W, 253.7 nm, 14.8 min, 125 g/L of total solid | Staphylococcus epidermidis (ATCC 12228) | 5 | 105 | CFU/mL | (68) | |
| 1.1 W, 253.7 nm, 26.5 min, 145 g/L of total solid | Staphylococcus epidermidis (ATCC 12228) | 5 | 105 | CFU/mL | (68) | |
| PEF | 7 kV, 1,500 pulses, 10 Hz, 30 J | Endogenous bacteria* | 0.42 | 3.16×10⁷ | CFU/mL | (65) |
| 7 kV, 1,500 pulses, 10 Hz, 37.5 J | Endogenous bacteria* | 0.46 | 3.16×10⁷ | CFU/mL | (65) | |
| 7 kV, 3,750 pulses, 20 Hz, 93.75 J | Endogenous bacteria* | 0.5 | 3.16×10⁷ | CFU/mL | (65) | |
| 7 kV, 1,500 pulses, 50 Hz, 37.5 J | Endogenous bacteria* | 0.5 | 3.16×10⁷ | CFU/mL | (65) | |
| 7 kV, 6,000 pulses, 20 Hz, 150 J | Endogenous bacteria* | 0.57 | 3.16×10⁷ | CFU/mL | (65) | |
| 7 kV, 6,000 pulses, 50 Hz, 180 J | Endogenous bacteria* | 0.58 | 3.16×10⁷ | CFU/mL | (65) | |
| 15 kV, 1,500 pulses, 50 Hz, 210 J | Endogenous bacteria* | 0.59 | 3.16×10⁷ | CFU/mL | (65) | |
| 7 kV, 1,500 pulses, 20 Hz, 30 J | Endogenous bacteria* | 0.59 | 3.16×10⁷ | CFU/mL | (65) | |
| 11 kV, 6,000 pulses, 10 Hz, 360 J | Endogenous bacteria* | 0.61 | 3.16×10⁷ | CFU/mL | (65) | |
| 11 kV, 3,750 pulses, 50 Hz, 225 J | Endogenous bacteria* | 0.67 | 3.16×10⁷ | CFU/mL | (65) | |
| 11 kV, 1,500 pulses, 20 Hz, 85.5 J | Endogenous bacteria* | 0.7 | 3.16×10⁷ | CFU/mL | (65) | |
| 7 kV, 6,000 pulses, 10 Hz, 120 J | Endogenous bacteria* | 0.7 | 3.16×10⁷ | CFU/mL | (65) | |
| 15 kV, 1,500 Pulses, 10 Hz, 165 J | Endogenous bacteria* | 0.8 | 3.16×10⁷ | CFU/mL | (65) | |
| 11 kV, 6,000 pulses, 20 Hz, 360 J | Endogenous bacteria* | 0.82 | 3.16×10⁷ | CFU/mL | (65) | |
| 15 kV, 1,500 pulses, 20 Hz, 165 J | Endogenous bacteria* | 1.37 | 3.16×10⁷ | CFU/mL | (65) | |
| 15 kV, 3,750 pulses, 10 Hz, 450 J | Endogenous bacteria* | 2.27 | 3.16×10⁷ | CFU/mL | (65) | |
| 15 kV, 6,000 pulses, 10 Hz, 660 J | Endogenous bacteria* | 2.3 | 3.16×10⁷ | CFU/mL | (65) | |
| 15 kV, 3,750 pulses, 20 Hz, 450 J | Endogenous bacteria* | 3.19 | 3.16×10⁷ | CFU/mL | (65) | |
| 15 kV, 6,000 pulses, 20 Hz, 780 J | Endogenous bacteria* | 3.94 | 3.16×10⁷ | CFU/mL | (65) | |
| 15 kV, 6,000 pulses, 50 Hz, 720 J | Endogenous bacteria* | 4.67 | 3.16×10⁷ | CFU/mL | (65) |
Microorganisms marked with * were evaluated as native on HBM, the others were inoculated. HPP, High-Pressure Processing; PEF, Pulsed Electric Fields. ACFU, Colony Forming Unit; BPFU, Plaque Forming Unit; CFFU, Focus Forming Unit; DTCID50, 50% of the Tissue Culture Infectivity Dose.
The effect of UV-radiation has been studied on bacteria like Staphylococcus (in the forms of Staphylococcus aureus (138-CPS and 146-CPS), Staphylococcus aureus (ATCC 6538), Staphylococcus aureus (PCM 2054), Staphylococcus epidermis (ATCC 12228)), achieving reductions between 5-log to complete inactivation under the conditions shown on Table 5 (52, 60, 68, 72). Enterococcus faecium (ATCC 6057) has been studied for this technology, showing a decrease of 3.95-log. Also, UV radiation has shown the ability to decrease levels of Escherichia coli (K-12) to below-detection. No data about virus inactivation was found for UV-radiation technology (52, 72).
Even though research regarding PEF as a treatment for microorganism inactivation in HBM is scarce, according to data reported in Table 5 (65), this technology can reduce endogenous bacteria in HBM from 0.42-log to 4.67-log at the specified conditions in the previously mentioned table.
It can be concluded that HPP (49, 53, 70, 71) was able to achieve the previously mentioned required conditions for microbiological safety of HBM for Hepatitis A virus, Listeria monocytogenes (ATCC 19115), Staphylococcus aureus (ATCC 25923), and Staphylococcus aureus (ATCC 6538). Similarly, UV radiation (52, 60, 72), according to the reviewed data, could achieve these conditions for Escherichia coli K 12 (ATCC1498), Listeria monocytogenes (ScottA, OSY-428, Ohio, California, ATCC 19115), Staphylococcus aureus (138-CPS and 146-CPS), Staphylococcus aureus (ATCC 6538), Staphylococcus aureus (PCM 2054), Staphylococcus epidermis (ATCC 12228).
Even though PEF showed the potential to reduce endogenous bacterial load on HBM, not enough reported data were found to conclude definitively about the effect of this technology on microorganism inactivation.
Regarding the effect of non-thermal treatments on spore-forming bacteria, there are several works included in Table 5, mainly evaluating the effect of HPP, and UV radiation on B. cereus, Paenibacillus macerans and Panibacillus polymixa spores. In (47) and (70), authors describe HPP as more effective than HoP on B. cereus. Particularly (47) reported 593.96 MPa for 233 s as the best process conditions. The effect of UV-C treatment is described in (60), achieving a 5-log10 reduction in B. subtilis, Paenibacillus macerans, and Paenibacillus polymyxa spores, preserving BSSL activity (Table 6). UV-C’s effectiveness against B. cereus spores, maintaining BSSL and fatty acid profiles is described by Christen et al. (68).
Effect of non-thermal processes on breast milk functional components
Regarding non-thermal technologies, HPP has shown an average of 98% retention of lysozyme activity, achieving complete retention (100%) at 400 MPa, 5 min, 25°C, and 400 MPa, 30 min. The lactoferrin retention varied from 55% to 87%, achieving higher retention at 400 MPa, 5 min, 25°C. IgA content was retained between 70% and 98%, showing a higher retention at 400 MPa, 5 min, 25°C. On the other hand, an average pressure of 600 MPa showed a decrease of IgG by 70%, but preserving ~80% of IgG content at 200 MPa, 10 min; interval 10 min; 400 MPa, 10 min, 19–21°C. The carbohydrate and crude protein did not change after any reported treatment condition. Bile Salt Stimulated Lipase (BSSL) activity showed a 100% retention at 500 MPa, 8 min, 4°C and 400 MPa, 5 min, 25°C conditions, but showing a reduction of almost 40% at 550 MPa, 5 min, according to data shown in Table 6 (49, 58–63, 67).
On the other hand, applying UV radiation to HBM requires careful consideration due to its potential impact on the nutritional composition of the milk. Prolonged UV exposure has diminished vital components like vitamin C, lysozyme, and other essential bioactive compounds and nutrients essential for infant well-being (52). For example, Table 6 shows that BSSL activity had retention levels from 20% to almost 100%, with higher conservation levels at lower radiation doses (253.7 nm, 1.1 W, 4863 J/L, for example) (60, 72).
For PEF, the highest retention levels of IgA and lactoferrin content reported were achieved at 15 kV, 6,000 pulses, and 20 Hz. It is relevant to mention that an area of opportunity to investigate this technology applied to the treatment of HBM was detected (65).
To summarize, the most studied non-thermal technology for Breast Milk treatment, according to reviewed data, is HPP, which has shown promising conservation levels (reaching even 100%) of bioactive and nutritional components in HBM. On the other hand, an opportunity area for research was detected based on the need for more data regarding UV radiation and PEF technologies for HBM treatment.
Conclusion
Human Breast Milk (HBM) is universally acknowledged as the optimal source of nutrition for neonates due to its rich nutritional content and potential therapeutic properties. However, despite universal endorsement, breastfeeding rates in the US show a decline during an infant’s initial 6 months. This trend highlights the urgent need for reliable methods to provide HBM to infants consistently. Emerging research focuses on preserving techniques that maintain the nutritional richness of HBM without compromising its bioactive components. We described in detail the cutting-edge applications of thermal and non-thermal processes for HBM preservation, emphasizing their impact on reducing pathogenic microorganisms while retaining essential nutrients, enzymes, and immunity properties. Data pointed out that, as expected, thermal technologies such as HoP and HTST can efficiently inactivate common bacteria and microorganisms in HBM but compromise the content and activity of bioactive and nutritional compounds, leading to an opportunity for non-thermal technologies, such as HPP and UV radiation which, according to analyzed data, showed the capacity to achieve conditions for microbiological safety established for HMB while preserving relevant components for newborns. Still, certain areas need further research. The effects of preservation treatments on the carbohydrate composition, especially HMOs and lipids, a vital newborn energy source, are still underexplored. Additionally, the combined use of non-thermal and thermal preservation techniques presents a promising area of study, particularly in terms of their effects on the nutritional and bioactive components of HBM. Understanding how these combined methods can optimize the preservation of HBM while maintaining its essential components is vital, Furthermore, there are significant challenges in determining the post-preservation shelf life of HBM and the effects of preservation on protein denaturation and digestibility. These aspects are critical for newborn gut development and overall health. Ultimately, advancements in HBM preservation serve a twofold purpose: they prioritize infant health and well-being while empowering mothers throughout their lactation journey, regardless of external challenges, for a healthier society where every newborn has access to proper nutrition.
Author contributions
AN-D: Data curation, Formal analysis, Investigation, Visualization, Writing – original draft. VM-C: Data curation, Investigation, Visualization, Writing – original draft. JW-C: Supervision, Writing – review & editing. SM-Q: Data curation, Investigation, Visualization. CC-H: Conceptualization, Supervision, Writing – review & editing.
Acknowledgments
The authors acknowledge the support from Tecnologico de Monterrey and CONAHCyT for the master’s degree scholarship (CVU No: 1275552) of AN-D.
Funding Statement
The author(s) declare financial support was received for the research, authorship, and/or publication of this article. This work was supported by the Challenge-Based Research Funding Program 2022 from Tecnologico de Monterrey, Institute for Obesity Research.
Conflict of interest
The authors declare that the research was conducted in the absence of any commercial or financial relationships that could be construed as a potential conflict of interest.
The handling editor CO declared a past co-authorship with the author CC-H.
The author(s) declared that they were an editorial board member of Frontiers, at the time of submission. This had no impact on the peer review process and the final decision.
Publisher’s note
All claims expressed in this article are solely those of the authors and do not necessarily represent those of their affiliated organizations, or those of the publisher, the editors and the reviewers. Any product that may be evaluated in this article, or claim that may be made by its manufacturer, is not guaranteed or endorsed by the publisher.
References
- 1.Zhang S, Li T, Xie J, Zhang D, Pi C, Zhou L, et al. Gold standard for nutrition: a review of human milk oligosaccharide and its effects on infant gut microbiota. Microb Cell Factories. (2021) 20:108. doi: 10.1186/s12934-021-01599-y, PMID: [DOI] [PMC free article] [PubMed] [Google Scholar]
- 2.Adamkin DH. Use of human milk and fortification in the NICU. J Perinatol. (2023) 43:551–9. doi: 10.1038/s41372-022-01532-0, PMID: [DOI] [PubMed] [Google Scholar]
- 3.Nuzzi G, Di Cicco ME, Peroni DG. Breastfeeding and allergic diseases: what’s new? Children. (2021) 8:330. doi: 10.3390/children8050330, PMID: [DOI] [PMC free article] [PubMed] [Google Scholar]
- 4.Selma-Royo M, Calvo Lerma J, Cortés-Macías E, Collado MC. Human milk microbiome: from actual knowledge to future perspective. Semin Perinatol. (2021) 45:151450. doi: 10.1016/j.semperi.2021.151450, PMID: [DOI] [PubMed] [Google Scholar]
- 5.CDC . Breastfeeding report card | breastfeeding | CDC. (2023). Available at: https://www.cdc.gov/breastfeeding/data/reportcard.htm
- 6.United Nations Children’s Fund (UNICEF) . Breastfeeding, a mother's gift, for every child. New York City: UNICEF; (2018) Available at: https://www.unicef.org/media/48046/file/UNICEF_Breastfeeding_A_Mothers_Gift_for_Every_Child.pdf. [Google Scholar]
- 7.Yan J, Liu L, Zhu Y, Huang G, Wang PP. The association between breastfeeding and childhood obesity: a meta-analysis. BMC Public Health. (2014) 14:1267. doi: 10.1186/1471-2458-14-1267 [DOI] [PMC free article] [PubMed] [Google Scholar]
- 8.Horta BL, Loret De Mola C, Victora CG. Long-term consequences of breastfeeding on cholesterol, obesity, systolic blood pressure and type 2 diabetes: a systematic review and meta-analysis. Acta Paediatr. (2015) 104:30–7. doi: 10.1111/apa.13133, PMID: [DOI] [PubMed] [Google Scholar]
- 9.Bai Y, Wunderlich SM. Lactation accommodation in the workplace and duration of exclusive breastfeeding. J Midwifery Womens Health. (2013) 58:690–6. doi: 10.1111/jmwh.12072, PMID: [DOI] [PubMed] [Google Scholar]
- 10.World Health Organization . Preterm birth. (2023). Available at: https://www.who.int/news-room/fact-sheets/detail/preterm-birth
- 11.Stuebe AM, Schwarz EB, Grewen K, Rich-Edwards JW, Michels KB, Foster EM, et al. Duration of lactation and incidence of maternal hypertension: a longitudinal cohort study. Am J Epidemiol. (2011) 174:1147–58. doi: 10.1093/aje/kwr227 [DOI] [PMC free article] [PubMed] [Google Scholar]
- 12.Pacza T, Martins ML, Rockaya M, Müller K, Chatterjee A, Barabási AL, et al. MilkyBase, a database of human milk composition as a function of maternal-, infant- and measurement conditions. Sci Data. (2022) 9:557. doi: 10.1038/s41597-022-01663-1, PMID: [DOI] [PMC free article] [PubMed] [Google Scholar]
- 13.Witkowska-Zimny M, Kaminska-El-Hassan E. Cells of human breast milk. Cell Mol Biol Lett. (2017) 22:1–11. doi: 10.1186/s11658-017-0042-4 [DOI] [PMC free article] [PubMed] [Google Scholar]
- 14.Kaingade P, Somasundaram I, Nikam A, Behera P, Kulkarni S, Patel J. Breast milk cell components and its beneficial effects on neonates: need for breast milk cell banking. J Pediatr Neonat Individ Med. (2017) 6:e060115. doi: 10.7363/060115 [DOI] [Google Scholar]
- 15.Boquien CY. Human milk: an ideal food for nutrition of preterm newborn. Front Pediatr. (2018) 6:295. doi: 10.3389/fped.2018.00295, PMID: [DOI] [PMC free article] [PubMed] [Google Scholar]
- 16.NeoLacta Lifesciences . Different stages of breastmilk composition. (2023). Available at: https://neolacta.com/blogs/different-stages-of-breastmilk-composition-updated/
- 17.American Pregnancy Association . Breastfeeding: overview. (2023). Available at: https://americanpregnancy.org/healthy-pregnancy/breastfeeding/breastfeeding-overview/
- 18.Andreas NJ, Kampmann B, Mehring Le-Doare K. Human breast milk: a review on its composition and bioactivity. Early Hum Dev. (2015) 91:629–35. doi: 10.1016/j.earlhumdev.2015.08.013 [DOI] [PubMed] [Google Scholar]
- 19.Brahm P, Valdés V. The benefits of breastfeeding and associated risks of replacement with baby formulas. Rev Chil Pediatr. (2017) 88:07–14. doi: 10.4067/S0370-41062017000100001 [DOI] [PubMed] [Google Scholar]
- 20.Mosca F, Giannì ML. Human milk: composition and health benefits. Pediatr Med Chir. (2017) 39:155. doi: 10.4081/pmc.2017.155, PMID: [DOI] [PubMed] [Google Scholar]
- 21.Peila C, Moro GE, Bertino E, Cavallarin L, Giribaldi M, Giuliani F, et al. The effect of holder pasteurization on nutrients and biologically-active components in donor human milk: a review. Nutrients. (2016) 8:477. doi: 10.3390/nu8080477, PMID: [DOI] [PMC free article] [PubMed] [Google Scholar]
- 22.Czosnykowska-Łukacka M, Orczyk-Pawiłowicz M, Broers B, Królak-Olejnik B. Lactoferrin in human milk of prolonged lactation. Nutrients. (2019) 11:2350. doi: 10.3390/nu11102350, PMID: [DOI] [PMC free article] [PubMed] [Google Scholar]
- 23.Kaplan M, Sahutoglu AS, Sarıtas S, Duman H, Arslan A, Pekdemir B, et al. Role of milk glycome in prevention, treatment, and recovery of COVID-19. Front Nutr. (2022) 9:1033779. doi: 10.3389/fnut.2022.1033779, PMID: [DOI] [PMC free article] [PubMed] [Google Scholar]
- 24.Bolat E, Eker F, Kaplan M, Duman H, Arslan A, Saritas S, et al. Lactoferrin for COVID-19 prevention, treatment, and recovery. Front Nutr. (2022) 9:992733. doi: 10.3389/fnut.2022.992733, PMID: [DOI] [PMC free article] [PubMed] [Google Scholar]
- 25.Karav S. Selective deglycosylation of lactoferrin to understand glycans’ contribution to antimicrobial activity of lactoferrin. Cell Mol Biol. (2018) 64:52–7. doi: 10.14715/cmb/2018.64.9.8, PMID: [DOI] [PubMed] [Google Scholar]
- 26.Minami J, Odamaki T, Hashikura N, Abe F, Xiao JZ. Lysozyme in breast milk is a selection factor for bifidobacterial colonisation in the infant intestine. Benef Microbes. (2016) 7:53–60. doi: 10.3920/BM2015.0041, PMID: [DOI] [PubMed] [Google Scholar]
- 27.Zivkovic AM, German JB, Lebrilla CB, Mills DA. Human milk glycobiome and its impact on the infant gastrointestinal microbiota. Proc Natl Acad Sci U S A. (2011) 108:4653–8. doi: 10.1073/pnas.1000083107, PMID: [DOI] [PMC free article] [PubMed] [Google Scholar]
- 28.Karav S, Le Parc A, Nobrega L, de Moura Bell JM, Frese SA, Kirmiz N, et al. Oligosaccharides released from milk glycoproteins are selective growth substrates for infant-associated bifidobacteria. Appl Environ Microbiol. (2016) 82:3622–30. doi: 10.1128/AEM.00547-16, PMID: [DOI] [PMC free article] [PubMed] [Google Scholar]
- 29.Enam F, Mansell TJ. Linkage-specific detection and metabolism of human milk oligosaccharides in Escherichia coli. Cell Chem Biol. (2018) 25:1292–1303.e4. doi: 10.1016/j.chembiol.2018.06.002, PMID: [DOI] [PubMed] [Google Scholar]
- 30.Brink LR, Lönnerdal B. Milk fat globule membrane: the role of its various components in infant health and development. J Nutr Biochem. (2020) 85:108465. doi: 10.1016/j.jnutbio.2020.108465 [DOI] [PubMed] [Google Scholar]
- 31.Koletzko B. Human milk lipids. Ann Nutr Metab. (2017) 69:27–40. doi: 10.1159/000452819 [DOI] [PubMed] [Google Scholar]
- 32.Salcedo J, Karav S, Le Parc A, Cohen JL, de Moura Bell JMLN, Sun A, et al. Application of industrial treatments to donor human milk: influence of pasteurization treatments, storage temperature, and time on human milk gangliosides. NPJ Sci Food. (2018) 2:5. doi: 10.1038/s41538-018-0013-9 [DOI] [PMC free article] [PubMed] [Google Scholar]
- 33.Walker A. Breast milk as the gold standard for protective nutrients. J Pediatr. (2010) 156:S3–7. doi: 10.1016/j.jpeds.2009.11.021, PMID: [DOI] [PubMed] [Google Scholar]
- 34.Binns C, Lee M, Low WY. The long-term public health benefits of breastfeeding. Asia Pac J Public Health. (2016) 28:7–14. doi: 10.1177/1010539515624964 [DOI] [PubMed] [Google Scholar]
- 35.Prentice AM. Breastfeeding in the modern world. Ann Nutr Metab. (2022) 78:29–38. doi: 10.1159/000524354 [DOI] [PubMed] [Google Scholar]
- 36.Su D, Pasalich M, Lee AH, Binns CW. Ovarian cancer risk is reduced by prolonged lactation: a case-control study in southern China. Am J Clin Nutr. (2013) 97:354–9. doi: 10.3945/ajcn.112.044719 [DOI] [PubMed] [Google Scholar]
- 37.del Ciampo LA, del Ciampo IRL. Breastfeeding and the benefits of lactation for women’s health. Rev Bras Ginecol Obstet. (2018) 40:354–9. doi: 10.1055/s-0038-1657766 [DOI] [PMC free article] [PubMed] [Google Scholar]
- 38.Hajat C, Stein E. The global burden of multiple chronic conditions: a narrative review. Prev Med Rep. (2018) 12:284–93. doi: 10.1016/j.pmedr.2018.10.008, PMID: [DOI] [PMC free article] [PubMed] [Google Scholar]
- 39.CDC . The surgeon general’s call to action to support breastfeeding | breastfeeding | CDC. (2023). Available at: https://www.cdc.gov/breastfeeding/resources/calltoaction.htm
- 40.Escuder-Vieco D, Espinosa-Martos I, Rodríguez JM, Corzo N, Montilla A, Siegfried P, et al. High-temperature short-time pasteurization system for donor milk in a human milk bank setting. Front Microbiol. (2018) 9:926. doi: 10.3389/fmicb.2018.00926, PMID: [DOI] [PMC free article] [PubMed] [Google Scholar]
- 41.Collins A, Weitkamp JH, Wynn JL. Why are preterm newborns at increased risk of infection? Arch Dis Child Fetal Neonatal Ed. (2018) 103:F391–4. doi: 10.1136/archdischild-2017-313595, PMID: [DOI] [PMC free article] [PubMed] [Google Scholar]
- 42.Human Milk Banking Association of North America . HMBANA standards for donor human milk banking: an overview HMBANA guidelines committee HMBANA standards for donor human milk banking: an overview. (2023). Available at: www.hmbana.orginfo@hmbana.org
- 43.Thomas CL, Murphy LD, Mills MJ, Zhang J, Fisher GG, Clancy RL. Employee lactation: a review and recommendations for research, practice, and policy. Hum Resour Manag Rev. (2022) 32:100848. doi: 10.1016/j.hrmr.2021.100848 [DOI] [Google Scholar]
- 44.Tsai SY. Impact of a breastfeeding-friendly workplace on an employed mother’s intention to continue breastfeeding after returning to work. Breastfeed Med. (2013) 8:210–6. doi: 10.1089/bfm.2012.0119, PMID: [DOI] [PMC free article] [PubMed] [Google Scholar]
- 45.Manzardo OA, Toll LJ, Müller K, Nickel E, Jonas D, Baumgartner J, et al. A novel heat treatment protocol for human milk. Front Pediatr. (2022) 10:990871. doi: 10.3389/fped.2022.990871, PMID: [DOI] [PMC free article] [PubMed] [Google Scholar]
- 46.Calvo J, García Lara NR, Gormaz M, Peña M, Martínez Lorenzo MJ, Ortiz Murillo P, et al. Recommendations for the creation and operation of maternal milk banks in Spain. An Pediatr. (2018) 89:65.e1–6. doi: 10.1016/j.anpede.2018.01.007, PMID: [DOI] [PubMed] [Google Scholar]
- 47.Rocha-Pimienta J, Martillanes S, Ramírez R, Garcia-Parra J, Delgado-Adamez J. Bacillus cereus spores and Staphylococcus aureus sub. Aureus vegetative cells inactivation in human milk by high-pressure processing. Food Control. (2020) 113:107212. doi: 10.1016/j.foodcont.2020.107212 [DOI] [Google Scholar]
- 48.Klotz D, Joellenbeck M, Winkler K, Kunze M, Huzly D, Hentschel R. High-temperature short-time pasteurisation of human breastmilk is efficient in retaining protein and reducing the bacterial count. Acta Paediatr Int J Paediatr. (2017) 106:763–7. doi: 10.1111/apa.13768, PMID: [DOI] [PubMed] [Google Scholar]
- 49.Pitino MA, Unger S, Gill A, McGeer AJ, Doyen A, Pouliot Y, et al. High pressure processing inactivates human cytomegalovirus and hepatitis a virus while preserving macronutrients and native lactoferrin in human milk. IFSET. (2022) 75:102891. doi: 10.1016/j.ifset.2021.102891 [DOI] [Google Scholar]
- 50.Klotz D, Schreiner M, Falcone V, Jonas D, Kunze M, Weber A, et al. High-temperature short-time treatment of human milk for bacterial count reduction. Front Pediatr. (2018) 6:359. doi: 10.3389/fped.2018.00359 [DOI] [PMC free article] [PubMed] [Google Scholar]
- 51.Bouquet P, Alexandre V, De Lamballerie M, Ley D, Lesage J, Goffard A, et al. Effect of high hydrostatic pressure processing and holder pasteurization of human milk on inactivation of human coronavirus 229e and hepatitis e virus. Viruses. (2023) 15:1571. doi: 10.3390/v15071571, PMID: [DOI] [PMC free article] [PubMed] [Google Scholar]
- 52.Martysiak-Żurowska D, Puta M, Kotarska J, Cybula K, Malinowska-Pańczyk E, Kołodziejska I. The effect of UV-C irradiation on lipids and selected biologically active compounds in human milk. Int Dairy J. (2017) 66:42–8. doi: 10.1016/j.idairyj.2016.10.009 [DOI] [Google Scholar]
- 53.Viazis S, Farkas BE, Jaykus LA. Inactivation of bacterial pathogens in human milk by high-pressure processing. J Food Prot. (2008) 71:109–18. doi: 10.4315/0362-028X-71.1.109, PMID: [DOI] [PubMed] [Google Scholar]
- 54.Lackey KA, Pace RM, Williams JE, Bode L, Donovan SM, Järvinen KM, et al. SARS-CoV-2 and human milk: what is the evidence? Matern Child Nutr. (2020) 16:e13032. doi: 10.1111/mcn.13032 [DOI] [PMC free article] [PubMed] [Google Scholar]
- 55.Terpstra FG, Rechtman DJ, Lee ML, Van Hoeij K, Berg H, Van Engelenberg FAC, et al. Antimicrobial and antiviral effect of high-temperature short-time (HTST) pasteurization applied to human milk. Breastfeed Med. (2007) 2:27–33. doi: 10.1089/bfm.2006.0015, PMID: [DOI] [PubMed] [Google Scholar]
- 56.Giribaldi M, Coscia A, Peila C, Antoniazzi S, Lamberti C, Ortoffi M, et al. Pasteurization of human milk by a benchtop high-temperature short-time device. IFSET. (2016) 36:228–33. doi: 10.1016/j.ifset.2016.07.004 [DOI] [Google Scholar]
- 57.Dhar J, Fichtali J, Skura BJ, Nakai S, Davidson AGF. Pasteurization efficiency of a HTST system for human milk. J Food Sci. (1996) 61:569–73. doi: 10.1111/j.1365-2621.1996.tb13160.x [DOI] [Google Scholar]
- 58.Wesolowska A, Sinkiewicz-Darol E, Barbarska O, Strom K, Rutkowska M, Karzel K, et al. New achievements in high-pressure processing to preserve human milk bioactivity. Front Pediatr. (2018) 6:323. doi: 10.3389/fped.2018.00323, PMID: [DOI] [PMC free article] [PubMed] [Google Scholar]
- 59.Pitino MA, Unger S, Doyen A, Pouliot Y, Aufreiter S, Stone D, et al. High hydrostatic pressure processing better preserves the nutrient and bioactive compound composition of human donor milk. J Nutr. (2019) 149:497–504. doi: 10.1093/jn/nxy302, PMID: [DOI] [PMC free article] [PubMed] [Google Scholar]
- 60.Koh J, Victor AF, Howell ML, Yeo JG, Qu Y, Selover B, et al. Bile salt-stimulated lipase activity in donor breast milk influenced by pasteurization techniques. Front Nutr. (2020) 7:552362. doi: 10.3389/fnut.2020.552362, PMID: [DOI] [PMC free article] [PubMed] [Google Scholar]
- 61.Zhang J, Lee NA, Duley JA, Cowley DM, Shaw PN, Bansal N. Comparing the effects of hydrostatic high-pressure processing vs holder pasteurisation on the microbial, biochemical and digestion properties of donor human milk. Food Chem. (2022) 373:131545. doi: 10.1016/j.foodchem.2021.131545, PMID: [DOI] [PubMed] [Google Scholar]
- 62.Dussault N, Cayer MP, Landry P, De Grandmont MJ, Cloutier M, Thibault L, et al. Comparison of the effect of holder pasteurization and high-pressure processing on human milk bacterial load and bioactive factors preservation. J Pediatr Gastroenterol Nutr. (2021) 72:756–62. doi: 10.1097/MPG.0000000000003065, PMID: [DOI] [PMC free article] [PubMed] [Google Scholar]
- 63.Viazis S, Farkas BE, Allen JC. Effects of high-pressure processing on immunoglobulin a and lysozyme activity in human milk. J Hum Lact. (2007) 23:253–61. doi: 10.1177/0890334407303945 [DOI] [Google Scholar]
- 64.Rogier EW, Frantz AL, Bruno MEC, Wedlund L, Cohen DA, Stromberg AJ, et al. Secretory antibodies in breast milk promote long-term intestinal homeostasis by regulating the gut microbiota and host gene expression. Proc Natl Acad Sci U S A. (2014) 111:3074–9. doi: 10.1073/pnas.1315792111, PMID: [DOI] [PMC free article] [PubMed] [Google Scholar]
- 65.Zhang J, Ghasemi N, Zare F, Duley JA, Cowley DM, Shaw PN, et al. Nanosecond pulsed electric field treatment of human milk: effects on microbiological inactivation, whey proteome and bioactive protein. Food Chem. (2023) 406:135073. doi: 10.1016/j.foodchem.2022.135073, PMID: [DOI] [PubMed] [Google Scholar]
- 66.Buffin R, Hays S, Drai J, Sarda MN, Picaud JC. Better control of holder pasteurization results in higher retention of human milk lactoferrin, IgA, and lysozyme. Front Pediatr. (2018) 6:381. doi: 10.3389/fped.2018.00381 [DOI] [PMC free article] [PubMed] [Google Scholar]
- 67.Permanyer M, Castellote C, Ramírez-Santana C, Audí C, Pérez-Cano FJ, Castell M, et al. Maintenance of breast milk immunoglobulin a after high-pressure processing. J Dairy Sci. (2010) 93:877–83. doi: 10.3168/jds.2009-2643, PMID: [DOI] [PubMed] [Google Scholar]
- 68.Christen L, Lai CT, Hartmann B, Hartmann PE, Geddes DT. Ultraviolet-C irradiation: a novel pasteurization method for donor human milk. PLoS One. (2013) 8:e68120. doi: 10.1371/journal.pone.0068120, PMID: [DOI] [PMC free article] [PubMed] [Google Scholar]
- 69.Lima HK, Wagner-Gillespie M, Perrin MT, Fogleman AD. Bacteria and bioactivity in holder pasteurized and shelf-stable human milk products. Curr Dev Nutr. (2017) 1:e001438. doi: 10.3945/cdn.117.001438, PMID: [DOI] [PMC free article] [PubMed] [Google Scholar]
- 70.Demazeau G, Plumecocq A, Lehours P, Martin P, Couëdelo L, Billeaud C. A new high hydrostatic pressure process to assure the microbial safety of human milk while preserving the biological activity of its main components. Front Public Health. (2018) 6:306. doi: 10.3389/fpubh.2018.00306, PMID: [DOI] [PMC free article] [PubMed] [Google Scholar]
- 71.Windyga B, Rutkowska M, Sokołowska B, Skąpska S, Wesołowska A, Wilińska M, et al. Inactivation of Staphylococcus aureus and native microflora in human milk by high pressure processing. High Press Res. (2015) 35:181–8. doi: 10.1080/08957959.2015.1007972 [DOI] [Google Scholar]
- 72.Christen L, Lai CT, Hartmann B, Hartmann PE, Geddes DT. The effect of UV-C pasteurization on bacteriostatic properties and immunological proteins of donor human milk. PLoS One. (2013) 8:e85867. doi: 10.1371/journal.pone.0085867 [DOI] [PMC free article] [PubMed] [Google Scholar]
- 73.Capriati T, Goffredo BM, Argentieri M, De Vivo L, Bernaschi P, Cairoli S, et al. A modified holder pasteurization method for donor human milk: preliminary data. Nutrients. (2019) 11:1139. doi: 10.3390/nu11051139, PMID: [DOI] [PMC free article] [PubMed] [Google Scholar]
- 74.Caballero Martín S, Sánchez Gomez de Orgaz MC, Sánchez Luna M. Estudio de calidad de la pasteurización Holder de leche materna donada en una unidad de nutrición personalizada neonatal. An Pediatr. (2022) 96:294–9. doi: 10.1016/j.anpedi.2021.01.019 [DOI] [Google Scholar]
- 75.Gómez de Segura A, Moles L, Montilla A, Corzo N, Leónides Fernández, Rodríguez Juan M. Efecto de la pasteurización Holder sobre parámetros microbiológicos, inmunológicos y bioquímicos en muestras de leche humana donada. Digital CSIC (2010).
- 76.Meunier-Goddik L, Sandra S. Liquid milk products: pasteurized milk. In: WF John, editor. Encyclopedia of dairy sciences. 2nd edn. Academic Press: (2011). 274–80. [Google Scholar]
- 77.Kontopodi E, Boeren S, Stahl B, van Goudoever JB, van Elburg RM, Hettinga K. High-temperature short-time preserves human milk’s bioactive proteins and their function better than pasteurization techniques with long processing times. Front Pediatr. (2022) 9:9. doi: 10.3389/fped.2021.798609 [DOI] [PMC free article] [PubMed] [Google Scholar]
- 78.Ih M, Mather IH, Keenan TW. Milk fat globule membrane In: Encyclopedia of dairy science: Elsevier; (2011). 680–90. [Google Scholar]
- 79.Escuder-Vieco D, Espinosa-Martos I, Rodríguez JM, Fernández L, Pallás-Alonso CR. Effect of htst and holder pasteurization on the concentration of immunoglobulins, growth factors, and hormones in donor human milk. Front Immunol. (2018) 9:2222. doi: 10.3389/fimmu.2018.02222 [DOI] [PMC free article] [PubMed] [Google Scholar]
- 80.Serna-Hernandez SO, Escobedo-Avellaneda Z, García-García R, Rostro-Alanis De J, Welti-Chanes J. High hydrostatic pressure induced changes in the physicochemical and functional properties of milk and dairy products: a review. Foods. (2021) 10:1867. doi: 10.3390/foods10081867, PMID: [DOI] [PMC free article] [PubMed] [Google Scholar]
- 81.Balasubramaniam VMB, Martínez-Monteagudo SI, Gupta R. Principles and application of high pressure-based technologies in the food industry. Ann Rev Food Sci and Technol. (2015) 6:435–62. doi: 10.1146/annurev-food-022814-015539, PMID: [DOI] [PubMed] [Google Scholar]
- 82.Valencia-Flores DC, Hernández-Herrero M, Guamis B, Ferragut V. Comparing the effects of ultra-high-pressure homogenization and conventional thermal treatments on the microbiological, physical, and chemical quality of almond beverages. J Food Sci. (2013) 78:E199–205. doi: 10.1111/1750-3841.12029, PMID: [DOI] [PubMed] [Google Scholar]
- 83.Balny C, Masson P. Effects of high pressure on proteins. Food Rev Int. (1993) 9:611–28. doi: 10.1080/87559129309540980 [DOI] [Google Scholar]
- 84.Bintsis T, Litopoulou-Tzanetaki E, Robinson RK. Review existing and potential applications of ultraviolet light in the food industry-a critical review. J Sci Food and Agric. (2000) 80:637–45. doi: 10.1002/(SICI)1097-0010(20000501)80:6<637::AID-JSFA603>3.0.CO;2-1, PMID: [DOI] [PubMed] [Google Scholar]
- 85.Morales de la Peña M, Welti-Chanes J, Martín-Belloso O. Novel technologies to improve food safety and quality. Curr Opin Food Sci. (2018) 30:1–7. doi: 10.1016/j.cofs.2018.10.009 [DOI] [Google Scholar]
- 86.Kontopodi E, Stahl B, van Goudoever JB, Boeren S, Timmermans RAH, den Besten HMW, et al. Effects of high-pressure processing, UV-C irradiation and thermoultrasonication on donor human milk safety and quality. Front Pediatr. (2022) 10:828448. doi: 10.3389/fped.2022.828448, PMID: [DOI] [PMC free article] [PubMed] [Google Scholar]
- 87.Mohamad A, Shah NNAK, Sulaiman A, Mohd Adzahan N, Aadil RM. Impact of the pulsed electric field on physicochemical properties, fatty acid profiling, and metal migration of goat milk. J Food Process Preserv. (2020) 44:e14940. doi: 10.1111/jfpp.14940 [DOI] [Google Scholar]
- 88.Ahmad T, Butt MZ, Aadil RM, Inam-ur-Raheem M, Abdullah, Bekhit AED, et al. Impact of nonthermal processing on different milk enzymes. Int J Dairy Technol. (2019) 72:481–95. doi: 10.1111/1471-0307.12622 [DOI] [Google Scholar]
- 89.Zhao W, Yang R. Pulsed electric field induced aggregation of food proteins: ovalbumin and bovine serum albumin. Food Bioprocess Technol. (2012) 5:1706–14. doi: 10.1007/s11947-010-0464-8 [DOI] [Google Scholar]
- 90.Buckow R, Chandry PS, Ng SY, McAuley CM, Swanson BG. Opportunities and challenges in pulsed electric field processing of dairy products. Int Dairy J. (2014) 34:199–212. doi: 10.1016/j.idairyj.2013.09.002 [DOI] [Google Scholar]