

Abstract
Background:
Higher levels of physical activity are associated with improvements in cardiovascular health, and consensus guidelines recommend that individuals with or at risk for atherosclerotic cardiovascular disease (ASCVD) participate in regular physical activity. However, most adults do not achieve recommended levels of physical activity. Concepts from behavioral economics have been used to design scalable interventions that increase physical activity over short time periods, but the longer-term efficacy of these strategies is uncertain.
Study Design and Objectives:
BE ACTIVE (NCT03911141) is a pragmatic, virtual, randomized controlled trial designed to evaluate the effectiveness of three strategies informed by behavioral economic concepts to increase daily physical activity in patients with established ASCVD or 10-year ASCVD risk > 7.5% who are seen in primary care and cardiology clinics affiliated with the University of Pennsylvania Health System. Patients are contacted by email or text message, and complete enrollment and informed consent on the Penn Way to Health online platform. Patients are then provided with a wearable fitness tracker, establish a baseline daily step count, set a goal to increase daily step count by 33–50%, and are randomized 1:2:2:2 to control, gamification, financial incentives, or both gamification and financial incentives. Interventions continue for 12 months, with follow-up for an additional 6 months to evaluate the durability of behavior change. The trial has met its enrollment goal of 1050 participants, with a primary endpoint of change from baseline in daily steps over the 12-month intervention period. Key secondary endpoints include change from baseline in daily steps over the 6-month post-intervention follow-up period and change in moderate to vigorous physical activity over the intervention and follow-up periods. If the interventions prove effective their effects on life expectancy will be compared with their costs in cost-effectiveness analysis.
Conclusions:
BE ACTIVE is a virtual, pragmatic randomized clinical trial powered to demonstrate whether gamification, financial incentives, or both are superior to attention control in increasing physical activity. Its results will have important implications for strategies to promote physical activity in patients with or at risk for ASCVD, as well as for the design and implementation of pragmatic virtual clinical trials within health systems.
Clinical trial registration:
Subject terms: exercise, cardiovascular diseases, behavioral economics, gamification, health behavior
INTRODUCTION
Higher levels of regular physical activity are associated with improved control of cardiovascular risk factors and reduced risk of atherosclerotic cardiovascular disease (ASCVD).(1–5) For this reason, the Physical Activity Guidelines for Americans recommends that each week adults obtain at least 150 minutes of moderate intensity physical activity or 75 minutes of vigorous physical activity.(6) However, more than half of adults in the United States do not achieve this amount of physical activity, and this proportion has not changed significantly over the past decade.(7)
As with many health-related behaviors, increasing individuals’ physical activity has been challenging for a number of reasons. Behavioral economics is a scientific field of inquiry that uses principles from economics and psychology to understand and influence how individuals make decisions. In classical experiments, behavioral economists showed that people commonly make certain decision errors, leading to the concept of “bounded rationality.”(8) For example, individuals are more motivated by immediate rather than delayed gratification, by losses rather than gains, and by the desire to avoid feelings of regret.(9,10) These insights can be leveraged to design interventions that effectively promote healthy behaviors. For example, rewards can be framed as losses when a goal is not achieved as opposed to gains following achievement of a goal and individuals can be informed of what they would have received had they accomplished their goals.
In prior studies, gamification and financial incentives based on behavioral economic concepts have each increased physical activity more than controls in patients with or at risk for ASCVD. However, interventions were delivered over 12 or 24 weeks, with post-intervention follow up periods of no longer than 12 weeks.(11,12) The degree to which these interventions durably increase physical activity over longer intervention and follow-up periods is unknown, as is the relative efficacy of gamification versus financial incentives.
We therefore designed the Behavioral Economic Approaches to Increase Physical Activity Among Patients with Elevated Risk for Cardiovascular Disease (BE ACTIVE) randomized controlled trial to test the effectiveness of gamification, financial incentives, or both, compared with control, to increase physical activity over a 12-month intervention period and 6-month follow-up period in 1050 patients with or at risk for atherosclerotic vascular disease (Figure 1).
Figure 1:
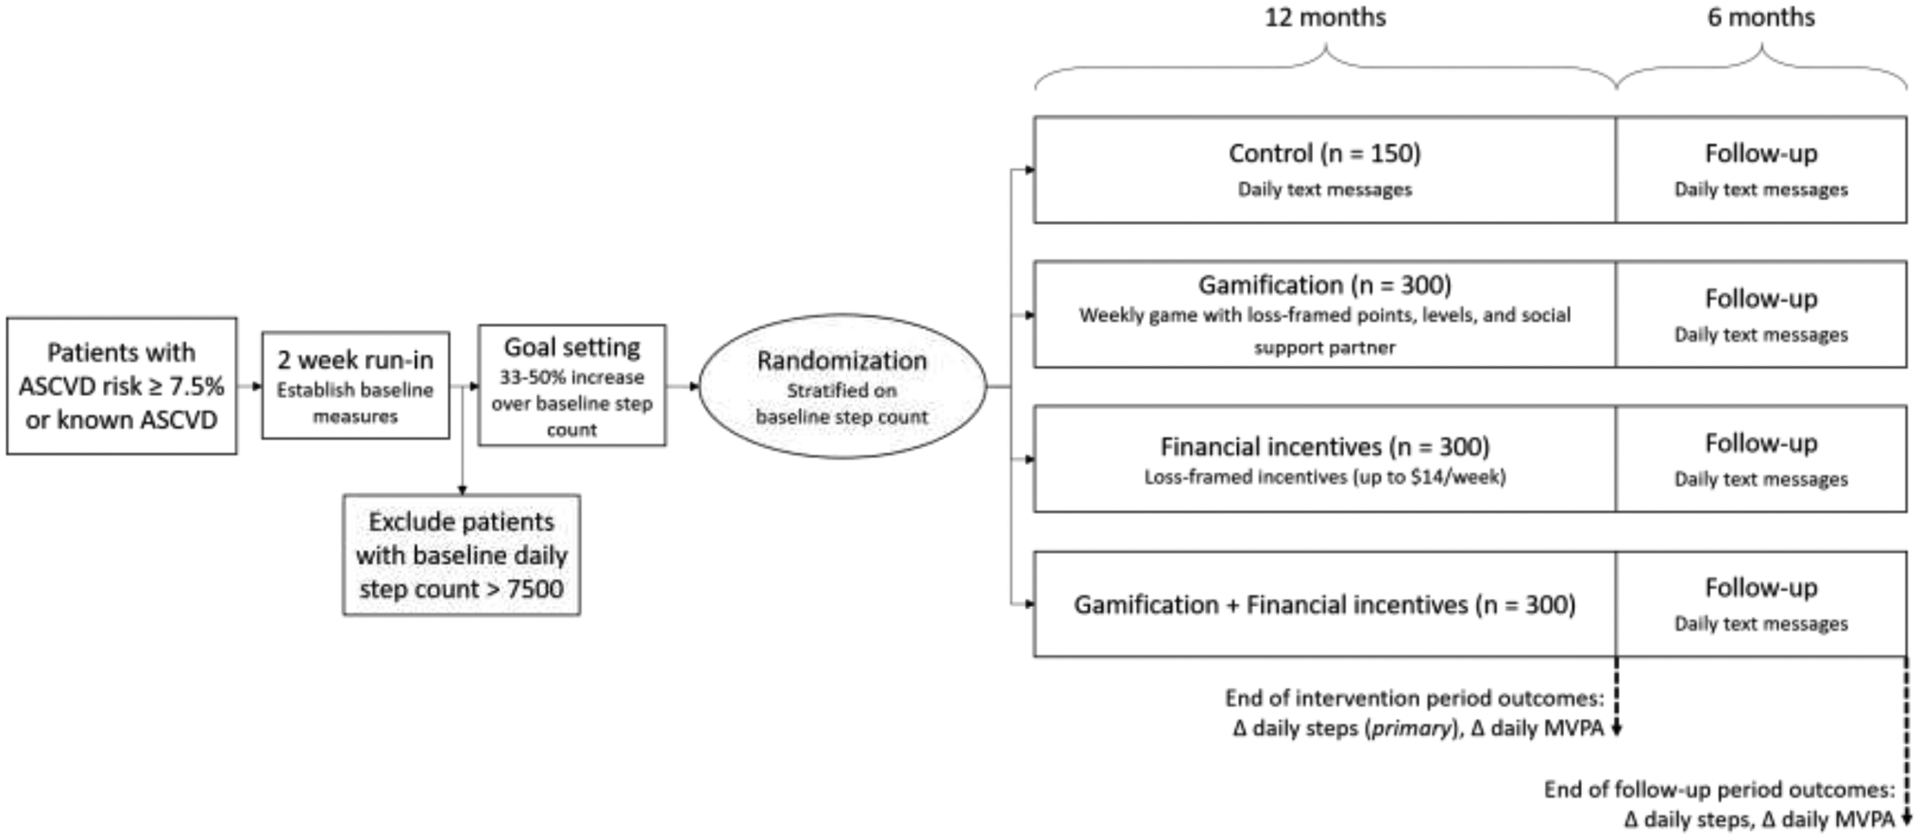
Summary of the design of the BE ACTIVE trial
Patients with or at risk for atherosclerotic vascular disease (ASCVD) are eligible for enrollment into BE ACTIVE. Patients complete informed consent and baseline questionnaires on the Penn Way to Health platform and are mailed a Fitbit wearable fitness tracker. They wear the fitness tracker for 2 weeks to establish a baseline step count, and patients with baseline step count > 7500 are excluded. The remaining patients set a goal to increase step count by 33–50% above baseline and are then randomized to one of four arms: attention control, gamification, financial incentives, or gamification + financial incentives.
METHODS
BE ACTIVE is funded by a grant from the National Heart Lung and Blood Institute to the University of Pennsylvania, and is registered at clinicaltrials.gov (NCT03911141). The study protocol was approved by the University of Pennsylvania Institutional Review Board.
Study Population
Patients with known ASCVD or a 10-year ASCVD risk (by the pooled cohort equation) of 7.5% or higher are eligible for enrollment in BE ACTIVE. Participants are recruited from the more than 60 primary care and cardiology practices affiliated with the University of Pennsylvania Health System, located in southeastern Pennsylvania and New Jersey. To increase generalizability, inclusion criteria are broad with few exclusion criteria: Participants are eligible if they are ≥ 18 years old, have a 10-year risk of ASCVD ≥ 7.5% or known ASCVD, and are able to provide informed consent. They are excluded if they are already participating in another physical activity study, if an 18-month physical activity program is infeasible (unable to ambulate, limited life expectancy) or unsafe (currently pregnant or told by a physician not to exercise), if they do not have a device (smartphone, tablet, or computer) capable of transmitting data from the wearable activity tracker, if they do not have an email address or phone number available in the electronic health record, or if they take > 7500 steps/day at baseline.
Potentially eligible patients are identified using data from the electronic health record (EHR) and the health system’s clinical data warehouse. ASCVD risk is determined using the pooled cohort equations,(13) calculated automatically using data from the EHR.
Study Procedures
After potentially eligible patients are identified via the EHR, they are directly contacted by email or text message. This email or text message introduces the study and provides a link to the study’s webpage on Penn Way to Health,(14) a research and care delivery platform that automates the delivery of behavior change interventions. On the study webpage, participants create an account, confirm their eligibility, complete the informed consent process, and answer questions regarding demographics, medical history, health status, and health-related quality of life. Enrollment is passive, and patients complete the enrollment process on their own, outside of clinical encounters, with study staff available to answer any questions by phone.
Once eligible patients complete the baseline questionnaire, they are mailed a wrist-worn activity tracker (Fitbit Inspire 2) and instructions for how to connect the device to the Way to Health platform. Participants are told to wear the device for two weeks to get comfortable using it, but are not explicitly told that baseline physical activity data is collected during this time period. During the second week of this two-week run-in phase, baseline activity measures (daily step counts, minutes of moderate physical activity) are estimated, as done previously.(11,15) The first week of data is ignored to diminish the potential upward bias of the estimate from higher activity during initial device use. To prevent potential mismeasurement, days with step values < 1000 are ignored, as previous studies have shown that these are unlikely to represent capture of actual activity during the entire day.(16,17) For participants with < 4 days with step count ≥ 1000 during the second week of the run-in period, the baseline period is extended until at least 4 valid days of data are collected. Baseline daily step count is calculated as the mean daily step count from the second week of the run-in period; days where the participant had a step count < 1000 are excluded from both the numerator (steps) and the denominator (days). Participants who do not complete the run-in phase or had baseline step counts > 7500 steps/day are not randomized into the trial and are asked to return their Fitbit device.
Once baseline measures are established, participants are contacted via text message or email, given their baseline step count, and asked to set a goal step increase of 33%, 40%, or 50%, or a custom goal at least 1500 steps greater than baseline. This approach was selected to give participants the option of setting their own goal, which we have shown is the most effective approach for goal-setting,(12) while nudging them to choose between different goals that were ambitious but achievable. They are then randomized 1:2:2:2 to one of four arms – attention control, gamification, financial incentives, or gamification + financial incentives – stratified by baseline step count (< 4000 steps, 4000–7000 steps, > 7000 steps) using an electronic number generator through the Way to Health platform. Treatment assignment is necessarily open-label, but patients are not explicitly informed about the existence or details of other treatment arms.
During the study period, patients are asked to complete questionnaires at 6, 12, and 18 months’ follow-up. Participants receive $30 for enrolling in the study, $30 for completing the 6-month assessment, $40 for completing the 12-month assessment, and $50 for completing the 18-month assessment. Patients are also allowed to keep the Fitbit at the conclusion of the study.
Study Treatments
In the attention control arm, patients receive a text message each day telling them whether they achieved their step goal on the prior day.
In the gamification arm, participants are entered into a game that leverages insights from behavioral economics to address predictable barriers to behavior change (Table 1). The components are the following: 1) Pre-commitment: Each participant signs a contract agreeing to try their best to achieve their daily step goal, an approach shown to motivate behavior change.(18) 2) Points: At the start of each week, the participant receives 70 points (10 for each day of the week). Participants are endowed with points rather than given points after achieving a milestone to leverage loss aversion, a concept from prospect theory that indicates that individuals are more motivated by losses than gains.(9) Each day the participant is informed of their step count from the day prior. If the step goal was achieved, the participant retains his or her points; if the step goal was not achieved, they are informed that they had lost 10 points. Points are replenished at the start of each week to leverage the “fresh start effect” – the concept that individuals are more motivated for aspirational behavior around temporal landmarks like the start of a new week.(19) 3) Levels: At the end of the week, participants with 40 points or more advance one level; participants with less than 40 points drop down a level. The levels are blue (lowest), bronze, silver gold, platinum (highest). Each participant begins in the silver level to create a sense of achievable goals and use loss aversion to motivate ongoing efforts not to lose status.(20) Every eight weeks, individuals in the blue and bronze levels are restarted back at silver, and offered a chance to adjust their step goal, as long as they remain within the range of a 33 to 50% increase from baseline. This allows for another “fresh start,” creates a new endowment, and avoids participants becoming discouraged if they set their goals too high at the start of the study. 4) Supportive sponsor: Each participant selects a family member or friend of their choice who receives a weekly email with the participant’s progress, including accumulated points, level in the game, and average step count. The supportive sponsor helps enhance social incentives to motivate the participant toward his or her goal. Prior to starting the study, supportive sponsors participate in a three-way phone call with the participant and study staff to discuss the rules of the game and ways that they can help the participant reach their goals. Every eight weeks, participants in the blue and bronze levels are contacted, along with their sponsor, to discuss ways the sponsor can better help participants achieve their goals moving forward. 5) Prize: At the end of the intervention period, participants in the platinum and gold levels receive a trophy (a nominal incentive of low monetary value) recognizing their achievement. The game lasts for the duration of the 12-month intervention. After 12 months, the participants in the gamification arm receive a daily text message noting their step count from the day prior (as in the attention control arm) for an additional 6-month follow-up period.
Table 1:
Behavioral economic principles used to inform the design of the interventions
| Principle | Predictably irrational tendency | Implications for intervention design |
|---|---|---|
| Status quo bias (49) | People favor the path of least resistance and avoid initiating change | Without the intervention(s), patients are unlikely to change their physical activity; therefore, the gamification and financial incentives interventions runs automatically rather than requiring the individual to actively participate, other than by working to achieve their physical activity goals |
| Immediacy (50) | Immediate rewards are more motivating than rewards far into the future (e.g. health outcomes) | Points or dollars are rewarded every day to create an immediate ‘benefit’ that links to future benefits |
| Loss aversion (9,10) | People are more motivated when the same situation is framed as a loss rather than a gain | Points and dollars are endowed at the beginning of each week and can be lost for not achieving step counts |
| Social ranking (51) | Social influences from networks impact people’s behavior | In the gamification arms, participants select a social support partner who will identify ways to help them in their journey and receive a weekly update on their progress. |
| Goal gradients (52) | People try harder when goals are within reach | In the gamification arms, participants start in the middle level and if they perform poorly, they get a fresh start every 8 weeks, and are moved back to the middle level |
In the financial incentives arm, patients are informed each week that $14 has been placed in a virtual account for them. Each day, the participant is informed of their step count on the prior day. If the step goal was achieved, the balance remains. If the step goal was not achieved, the participant is informed that $2 has been taken away from their virtual account. This structure leverages the concepts of loss aversion and the fresh start effect. After 12 months, participants no longer have money placed into their account each week but continue to receive a daily text message noting their step count from the day prior (as in the attention control arm) for an additional 6-month follow-up period.
In the gamification + financial incentives arm, participants receive the interventions from both the gamification and financial incentives arms.
In all three intervention arms, participants have an 8-week ramp-up period during which goals are increased gradually from baseline to the target. For example, if the baseline number of steps per day is 5000, and the goal is 7400 (an increase of 2400 steps over 8 weeks), then in week 1, the goal is 5300; in week 2, 5600, and so on through the 8-week ramp-up period.
Study Endpoints
The primary endpoint is change in mean daily steps from baseline through the 12-month intervention, excluding the 8-week ramp-up phase. Secondary outcomes include change in mean daily steps from baseline through the 6-month follow-up period, change in mean daily minutes of moderate to vigorous physical activity (MVPA) from baseline through the 12-month intervention and 6-month follow-up periods, and change in health-related quality of life (as measured by the EQ-5D-5L) from baseline through 12- and 18-month follow-up. We will also evaluate change in the proportion of patients that achieve the Center for Disease Control and Prevention recommendation of at least 150 minutes of moderate to vigorous activity per week from baseline through the 12-month intervention and 6-month follow-up periods.
Mean daily steps are captured by the Fitbit devices and automatically uploaded to the Penn Way to Health platform. Step data are transferred to the Way to Health platform every 4 hours. To identify minutes of MVPA, we will use data established in previous studies validating a threshold of 100 steps per minute as the minimum level of activity to be considered MVPA.(21,22) Based on the 2018 Physical Activity Guidelines for Americans,(23) our algorithm counts any minute with a pace of at least 100 steps as MVPA.
STATISTICAL CONSIDERATIONS
The primary analysis will fit linear mixed effect regression models to evaluate changes in physical activity and quality of life outcomes (primary and secondary outcomes) adjusting for each participant’s baseline measure, time, calendar-month fixed effects (fitted as a nominal variable), a variable to adjust for the COVID-19 pandemic at the participant-day level,(12) participant random effects, and accounting for repeated measures. For analyses of daily steps and MVPA, data captured during the entire study period will be used; this approach increases power by using all participant data, and provides a more complete picture of daily step count over the entire study period. All analyses will be performed according to the intention-to-treat principle.
Based on our prior work,(12,15,24–27) we estimate a standard deviation in the primary outcome of 2500 steps. Physical activity has a direct dose-response relationship with reduction in the risk of cardiovascular disease and events, with small increases significantly lowering risk.(1,28,29) The study is powered for six comparisons between arms using a common cutoff for the test statistics that ensures the familywise error rate is < 0.05.(30) With 300 participants in each intervention arm, and 150 participants in the control arm, we will have at least 93% power to detect a difference between groups of 1000 steps and 85% power to detect a difference of 750 steps, assuming a 10% drop-out rate.
As in prior studies with similar design,(12,27) our approach to handling days with missing step count data (due to participants not wearing their wearable device for that day, orthopedic injuries leading to temporary pausing of the study intervention, or participants who withdrew or were withdrawn from the study) will be to impute daily step counts for these days in our primary analysis, using an imputation model that includes study arm, calendar month (fitted as a nominal variable), week of study, baseline daily steps, age, sex, race/ethnicity, educational level, marital status, household income level, self-reported health, ASCVD condition (yes/no), and participant random effect. We will also perform a sensitivity analysis that uses collected data without imputation (such that days with missing step counts are recorded as zero steps). In prior studies using similar statistical methods, results of such sensitivity analyses have matched the primary analyses.(12,27) We will assess rates of missingness by arm, and if there is evidence of differential missingness, we will consider alternative modeling approaches that account for informative missingness.(31)
To further explore participant characteristics that might be predictive of the interventions’ success or failure, we will collect several baseline surveys in all participants: Self-Efficacy for Exercise Behaviors,(32) MOS Social Support survey,(33) the DOSPERT Risk Preferences survey,(34) the Big Five personality inventory,(35) and the Grit Scale.(36) Exploratory subgroup analyses will evaluate interactions between these characteristics and intervention effects, as well as between clinical, demographic, and socioeconomic variables and intervention effects.
Cost Effectiveness Analysis
To evaluate the cost-effectiveness of each intervention compared with control, we will use the health care sector perspective, which compares health outcomes with costs to providers.(37) As health outcomes, the analysis will report the differences between each intervention and control in measures of physical activity, and in health-related quality of life as measured by the EQ-5D-5L, over 12 and 18 months after baseline. We will use a simulation model to translate changes in these measures into changes in life expectancy and quality-adjusted life-years (QALYs) over participants’ remaining lifetimes, the recommended time horizon.(37) In translating changes in steps per day to changes in life expectancy or QALYs, we will rely on a series of cohort studies and systematic reviews of these cohort studies that evaluated the change in life expectancy for each additional 1000 steps per day measured by pedometer or accelerometer. In these studies, each 1000-step increase was associated with a 12–15% lower all-cause mortality, up to approximately 8000 steps per day.(16,38–46) We will use these studies to adjust mortality rates from the U.S. Life Tables, assuming that the life table mortality rates reflect average steps per day as reported in the literature,(16) to represent the baseline mortality risk of trial participants and the change in their mortality risk by the end of the intervention.
We directly measured intervention costs from the health care sector perspective, including costs for the Way to Health platform, staff (using a time diary to separate intervention from research tasks),(47) wearable devices, data storage, and financial incentives (where applicable). As a supplemental analysis, we surveyed participants to capture their costs: time spent on the intervention and physical activity, and out-of-pocket costs related to the intervention, such as clothing or shoes for exercise. We will summarize the results of this analysis in the form of incremental cost-effectiveness ratios that show the difference in costs between two arms of the trial (e.g. gamification vs. control) divided by the difference in each outcome (i.e. step count, minutes MVPA, life expectancy, QALYs). Sensitivity analyses will be conducted to determine the key drivers behind the cost-effectiveness ratios, including regression of daily physical activity rates toward baseline, intervention costs, and the strength of the association between daily step count and mortality. Future medical costs, currently recommended for the health care sector perspective but not yet routinely included in cost-effectiveness analyses, will be included in sensitivity analyses.
Mixed-Methods Process Evaluation
To understand how the interventions are implemented and received by participants, all participants will complete a fixed response questionnaire measuring their satisfaction with the wearable device, research technology platform, and intervention design. In addition, we will conduct semi-structured qualitative interviews with purposively sampled high- and low-performing (by change from baseline step count) participants in each arm. The interview guide is informed by the theoretical domains framework, which specifies the cognitive, affective, social, and environmental influences on behavior in relation to the implementation of interventions to improve health.(20,48) In these interviews, participants are asked to describe aspects of each intervention element that helped, or did not help, them achieve their physical activity goals. Interviews also elicit information about participants’ perceptions of intervention elements, the burden of participation, and suggestions for improvement in design. Interviews are transcribed and index coded by members of the study team. In future analyses, we will explore variation in perceptions and experiences across respondents.
TRIAL STATUS
The trial started enrollment in May 2019 and completed enrollment in May 2022, with a 6-month pause from March through August 2020 for the first wave of the COVID-19 pandemic. Ultimately, 1062 patients were enrolled, as patients in the baseline phase when the trial reached its recruitment goal were allowed to continue in the study. The last patient enrolled will finish follow up in November 2023. Baseline characteristics of trial participants are shown in Table 2. Participants’ mean ± standard deviation age is 66.8 ± 8.1; 60.4% of participants are female, 25.2% are Black, 23.1% have diabetes, 61.9% hypertension, and 53.2% hyperlipidemia. The mean participant took 5030 ± 1599 steps during the baseline run-in period and set a goal of increasing steps by 1858 ± 861 during the study period. The trial population is representativeness of the population of patients with or at risk for atherosclerotic vascular disease within the University of Pennsylvania Health System in terms of gender, age, and race, but it is a comparatively wealthy (42.0% with annual household income > $100,000) and well-educated (74.1% college graduate) population that reported having high levels of experience with wearable fitness trackers. However, due to the trial’s large sample size, we nevertheless enrolled a substantial number of lower income and less-well-educated individuals, and we expect that our results will be generalizable to the broad population of patients with or at risk for ASCVD.
Table 2:
Baseline characteristics of enrolled patients enrolled in BE ACTIVE
| Overall (n=1062) | |
|---|---|
| Age (mean, SD) | 66.7 (8.1) |
| Female sex (n, %) | 642 (60.5%) |
| Race/ethnicity (n, %) | |
| White non-Hispanic | 737 (69.4%) |
| Black non-Hispanic | 266 (25.0%) |
| Asian/Pacific Islander non-Hispanic | 28 (2.6%) |
| Hispanic | 16 (1.5%) |
| Other | 15 (1.4%) |
| Education (n, %) | |
| Some high school or less | 10 (0.9%) |
| High school graduate | 52 (4.9%) |
| Some college or specialized training | 215 (20.2%) |
| College graduate | 785(74.1%) |
| Marital status (n, %) | |
| Single | 159 (15.0%) |
| Married | 664 (62.5%) |
| Other | 239 (22.5%) |
| Annual household income (n, %) | |
| < $50,000 | 243 (22.9%) |
| $50–100,000 | 373 (35.1%) |
| > $100,000 | 446 (42.0%) |
| Self-reported health status (n, %) | |
| Excellent | 66 (6.2%) |
| Very good | 335 (31.5%) |
| Good | 501 (47.2%) |
| Fair | 152 (14.3%) |
| Poor | 8 (0.8%) |
| Prior wearable device use (n, %) | 739 (69.6%) |
| BMI (mean, SD) | 31.2 (6.7) |
| Diabetes (n, %) | 244 (23.0%) |
| Hyperlipidemia (n, %) | 565 (53.2%) |
| Hypertension (n, %) | 657 (61.9%) |
| Current smoking (n, %) | 43 (4.0%) |
| Prior myocardial infarction (n, %) | 25 (2.5%) |
| Heart failure | 20 (1.9%) |
| Chronic obstructive pulmonary disease (n, %) | 28 (2.6%) |
| Chronic kidney disease (n, %) | 37 (3.5%) |
| Baseline daily steps (mean, SD) | 5014 (1569) |
| Step goal selection (n, %) | |
| 33% increase from baseline | 352 (33.1%) |
| 40% increase from baseline | 164 (15.4%) |
| 50% increase from baseline | 209 (19.7%) |
| Custom goal | 337 (31.7%) |
| Step goal increase from baseline (mean, SD) | 1867 (817) |
To date, > 90% of participants randomized have remained in the study through 18-month follow-up.
CONCLUSIONS
The BE ACTIVE trial, a randomized trial of three automated low-cost interventions informed by insights from behavioral economics to improve physical activity in patients with or at risk for ASCVD identified by an electronic health record algorithm and directly contacted for participation, will provide several important insights into clinical practice and clinical trial conduct. From the standpoint of clinical practice, should any of the interventions lead to a sustained increase in physical activity, widespread implementation could have profound population-level effects on cardiovascular risk and quality of life. There will be strong incentives for health insurance plans and corporations to offer programs based on a successful intervention to plan members and employees, and for health systems to offer similar programs to their patients as capitated models proliferate. From the standpoint of clinical research, BE ACTIVE is among the first examples of a large clinical trial conducted entirely within a single health system using an electronic health record algorithm to identify patients for participation, direct outreach to potential participants with passive enrollment, and self-directed informed consent. As such, it is a model for the type of low-cost clinical trials designed to answer patient-centered comparative effectiveness questions and will provide important lessons for similar trials in the future.
FUNDING
BE ACTIVE was funded by a grant from the National Institutes of Health (R61/R33HL141440) to Drs. Volpp and Fanaroff.
Footnotes
Publisher's Disclaimer: This is a PDF file of an unedited manuscript that has been accepted for publication. As a service to our customers we are providing this early version of the manuscript. The manuscript will undergo copyediting, typesetting, and review of the resulting proof before it is published in its final form. Please note that during the production process errors may be discovered which could affect the content, and all legal disclaimers that apply to the journal pertain.
CONFLICTS OF INTEREST
Dr. Fanaroff reports a career development grant from the American Heart Association. Dr. Patel is an employee of Ascension Health. Dr. Volpp is a co-owner of a behavioral economics consulting firm, VAL Health. All other authors report no relevant conflicts of interest.
REFERENCES
- 1.Sattelmair J, Pertman J, Ding EL, Kohl HW, Haskell W, Lee IM. Dose response between physical activity and risk of coronary heart disease: a meta-analysis. Circulation. 2011. Aug 16;124(7):789–95. [DOI] [PMC free article] [PubMed] [Google Scholar]
- 2.Lee IM, Shiroma EJ, Lobelo F, Puska P, Blair SN, Katzmarzyk PT, et al. Effect of physical inactivity on major non-communicable diseases worldwide: an analysis of burden of disease and life expectancy. Lancet. 2012. Jul 21;380(9838):219–29. [DOI] [PMC free article] [PubMed] [Google Scholar]
- 3.Yang Q, Cogswell ME, Flanders WD, Hong Y, Zhang Z, Loustalot F, et al. Trends in cardiovascular health metrics and associations with all-cause and CVD mortality among US adults. JAMA. 2012. Mar 28;307(12):1273–83. [DOI] [PMC free article] [PubMed] [Google Scholar]
- 4.Artinian NT, Fletcher GF, Mozaffarian D, Kris-Etherton P, Van Horn L, Lichtenstein AH, et al. Interventions to promote physical activity and dietary lifestyle changes for cardiovascular risk factor reduction in adults: a scientific statement from the American Heart Association. Circulation. 2010. Jul 27;122(4):406–41. [DOI] [PMC free article] [PubMed] [Google Scholar]
- 5.Ding D, Lawson KD, Kolbe-Alexander TL, Finkelstein EA, Katzmarzyk PT, van Mechelen W, et al. The economic burden of physical inactivity: a global analysis of major non-communicable diseases. Lancet. 2016. Sep 24;388(10051):1311–24. [DOI] [PubMed] [Google Scholar]
- 6.Centers for Disease Control and Prevention. Physical Activity Data & Statistics [Internet]. Centers for Disease Control and Prevention. 2021. [cited 2021 May 16]. Available from: https://www.cdc.gov/physicalactivity/data/index.html [Google Scholar]
- 7.Andersen LB, Mota J, Di Pietro L. Update on the global pandemic of physical inactivity. Lancet. 2016. Sep 24;388(10051):1255–6. [DOI] [PubMed] [Google Scholar]
- 8.Kahneman D, Thinking, fast and slow. New York: Farrar, Straus and Giroux; 2013. [Google Scholar]
- 9.Kahneman D, Tversky A. Prospect Theory: An Analysis of Decision under Risk. Econometrica. 1979;47(2):263–91. [Google Scholar]
- 10.Kahneman D, Knetsch JL, Thaler RH. Anomalies: The Endowment Effect, Loss Aversion, and Status Quo Bias. J Econ Perspect. 1991. Mar;5(1):193–206. [Google Scholar]
- 11.Chokshi NP, Adusumalli S, Small DS, Morris A, Feingold J, Ha YP, et al. Loss-framed financial incentives and personalized goal-setting to increase physical activity among ischemic heart disease patients using wearable devices: the ACTIVE REWARD randomized trial. J Am Heart Assoc. 2018;7(12):e009173. [DOI] [PMC free article] [PubMed] [Google Scholar]
- 12.Patel MS, Bachireddy C, Small DS, Harrison JD, Harrington TO, Oon AL, et al. Effect of Goal-Setting Approaches Within a Gamification Intervention to Increase Physical Activity Among Economically Disadvantaged Adults at Elevated Risk for Major Adverse Cardiovascular Events: The ENGAGE Randomized Clinical Trial. JAMA Cardiol. 2021. Sep 1;6(12):1387–96. [DOI] [PMC free article] [PubMed] [Google Scholar]
- 13.Goff DC, Lloyd-Jones DM, Bennett G, Coady S, D’Agostino RB, Gibbons R, et al. 2013 ACC/AHA Guideline on the Assessment of Cardiovascular Risk. J Am Coll Cardiol. 2014;63(25):2935–59. [DOI] [PMC free article] [PubMed] [Google Scholar]
- 14.Asch DA, Volpp KG. On the Way to Health. LDI Issue Brief. 2012. Aug;17(9):1–4. [PubMed] [Google Scholar]
- 15.Patel MS, Benjamin EJ, Volpp KG, Fox CS, Small DS, Massaro JM, et al. Effect of a Game-Based Intervention Designed to Enhance Social Incentives to Increase Physical Activity Among Families: The BE FIT Randomized Clinical Trial. JAMA Intern Med. 2017. 01;177(11):1586–93. [DOI] [PMC free article] [PubMed] [Google Scholar]
- 16.Bassett DR, Wyatt HR, Thompson H, Peters JC, Hill JO. Pedometer-measured physical activity and health behaviors in U.S. adults. Med Sci Sports Exerc. 2010. Oct;42(10):1819–25. [DOI] [PMC free article] [PubMed] [Google Scholar]
- 17.Kang M, Rowe DA, Barreira TV, Robinson TS, Mahar MT. Individual information-centered approach for handling physical activity missing data. Res Q Exerc Sport. 2009. Jun;80(2):131–7. [DOI] [PubMed] [Google Scholar]
- 18.Rogers T, Milkman KL, Volpp KG. Commitment devices: using initiatives to change behavior. JAMA. 2014. May;311(20):2065–6. [DOI] [PubMed] [Google Scholar]
- 19.Dai H, Milkman KL, Riis J. Put Your Imperfections Behind You: Temporal Landmarks Spur Goal Initiation When They Signal New Beginnings. Psychol Sci. 2015. Dec;26(12):1927–36. [DOI] [PMC free article] [PubMed] [Google Scholar]
- 20.Cane J, O’Connor D, Michie S. Validation of the theoretical domains framework for use in behaviour change and implementation research. Implementation Science. 2012. Apr 24;7(1):37. [DOI] [PMC free article] [PubMed] [Google Scholar]
- 21.Marshall SJ, Levy SS, Tudor-Locke CE, Kolkhorst FW, Wooten KM, Ji M, et al. Translating physical activity recommendations into a pedometer-based step goal: 3000 steps in 30 minutes. Am J Prev Med. 2009;36(5):410–5. [DOI] [PubMed] [Google Scholar]
- 22.Tudor-Locke C, Sisson SB, Collova T, Lee SM, Swan PD. Pedometer-determined step count guidelines for classifying walking intensity in a young ostensibly healthy population. Can J Appl Physiol. 2005;30(6):666–76. [DOI] [PubMed] [Google Scholar]
- 23.Piercy KL, Troiano RP, Ballard RM, Carlson SA, Fulton JE, Galuska DA, et al. The Physical Activity Guidelines for Americans. JAMA. 2018. Nov 20;320(19):2020. [DOI] [PMC free article] [PubMed] [Google Scholar]
- 24.Patel MS, Asch DA, Rosin R, Small DS, Bellamy SL, Eberbach K, et al. Individual Versus Team-Based Financial Incentives to Increase Physical Activity: A Randomized, Controlled Trial. J Gen Intern Med. 2016;31(7):746–54. [DOI] [PMC free article] [PubMed] [Google Scholar]
- 25.Patel MS, Asch DA, Rosin R, Small DS, Bellamy SL, Heuer J, et al. Framing Financial Incentives to Increase Physical Activity Among Overweight and Obese Adults: A Randomized, Controlled Trial. Ann Intern Med. 2016. Mar 15;164(6):385–94. [DOI] [PMC free article] [PubMed] [Google Scholar]
- 26.Patel MS, Volpp KG, Rosin R, Bellamy SL, Small DS, Fletcher MA, et al. A Randomized Trial of Social Comparison Feedback and Financial Incentives to Increase Physical Activity. Am J Health Promot. 2016. Jul;30(6):416–24. [DOI] [PMC free article] [PubMed] [Google Scholar]
- 27.Patel MS, Small DS, Harrison JD, Fortunato MP, Oon AL, Rareshide CAL, et al. Effectiveness of Behaviorally Designed Gamification Interventions With Social Incentives for Increasing Physical Activity Among Overweight and Obese Adults Across the United States: The STEP UP Randomized Clinical Trial. JAMA Intern Med. 2019. Sep 9;179(12):1624–32. [DOI] [PMC free article] [PubMed] [Google Scholar]
- 28.Pandey A, Garg S, Khunger M, Darden D, Ayers C, Kumbhani DJ, et al. Dose-Response Relationship Between Physical Activity and Risk of Heart Failure: A Meta-Analysis. Circulation. 2015. Nov 10;132(19):1786–94. [DOI] [PubMed] [Google Scholar]
- 29.Löllgen H, Böckenhoff A, Knapp G. Physical activity and all-cause mortality: an updated meta-analysis with different intensity categories. Int J Sports Med. 2009. Mar;30(3):213–24. [DOI] [PubMed] [Google Scholar]
- 30.Follmann DA, Proschan MA, Geller NL. Monitoring pairwise comparisons in multi-armed clinical trials. Biometrics. 1994. Jun;50(2):325–36. [PubMed] [Google Scholar]
- 31.Spertus JV, Hatfield LA, Cohen DJ, Arnold SV, Ho M, Jones PG, et al. Integrating Quality of Life and Survival Outcomes in Cardiovascular Clinical Trials: Results From the PARTNER Trial. Circulation: Cardiovascular Quality and Outcomes. 2019. Jun;12(6):e005420. [DOI] [PMC free article] [PubMed] [Google Scholar]
- 32.Sallis J, Pinski R, Grossman R, Patterson T, Nader P. The development of self-efficacy scales for health-related diet and exercise behaviors. Health Educ Res. 1988(3):283–92. [Google Scholar]
- 33.Sherbourne CD, Stewart AL. The MOS social support survey. Soc Sci Med. 1991;32(6):705–14. [DOI] [PubMed] [Google Scholar]
- 34.Blais AR, Weber EU. A Domain-Specific Risk-Taking (DOSPERT) scale for adult populations. Judgm Decis. 2006;1(1):15. [Google Scholar]
- 35.John OP, Srivastava S. The Big-Five trait taxonomy: History, measurement, and theoretical perspectives. In: Pervin LA & John OP (eds), Handbook of personality. New York: Guilford Press; 1999. p. 102–38. [Google Scholar]
- 36.Duckworth AL, Quinn PD. Development and validation of the short grit scale (GRIT-S). J Pers Assess. 2009;91(2):166–74. [DOI] [PubMed] [Google Scholar]
- 37.Sanders GD, Neumann PJ, Basu A, Brock DW, Feeny D, Krahn M, et al. Recommendations for Conduct, Methodological Practices, and Reporting of Cost-effectiveness Analyses: Second Panel on Cost-Effectiveness in Health and Medicine. JAMA. 2016. Sep 13;316(10):1093–103. [DOI] [PubMed] [Google Scholar]
- 38.Althoff T, Sosič R, Hicks JL, King AC, Delp SL, Leskovec J. Large-scale physical activity data reveal worldwide activity inequality. Nature. 2017. Jul 20;547(7663):336–9. [DOI] [PMC free article] [PubMed] [Google Scholar]
- 39.Hall KS, Hyde ET, Bassett DR, Carlson SA, Carnethon MR, Ekelund U, et al. Systematic review of the prospective association of daily step counts with risk of mortality, cardiovascular disease, and dysglycemia. Int J Behav Nutr Phys Act. 2020. Jun 20;17(1):78. [DOI] [PMC free article] [PubMed] [Google Scholar]
- 40.Jayedi A, Gohari A, Shab-Bidar S. Daily Step Count and All-Cause Mortality: A Dose-Response Meta-analysis of Prospective Cohort Studies. Sports Med. 2022. Jan;52(1):89–99. [DOI] [PubMed] [Google Scholar]
- 41.Lee IM, Shiroma EJ, Kamada M, Bassett DR, Matthews CE, Buring JE. Association of Step Volume and Intensity With All-Cause Mortality in Older Women. JAMA Intern Med. 2019. Aug 1;179(8):1105. [DOI] [PMC free article] [PubMed] [Google Scholar]
- 42.Paluch AE, Gabriel KP, Fulton JE, Lewis CE, Schreiner PJ, Sternfeld B, et al. Steps per Day and All-Cause Mortality in Middle-aged Adults in the Coronary Artery Risk Development in Young Adults Study. JAMA Netw Open. 2021. Sep 1;4(9):e2124516. [DOI] [PMC free article] [PubMed] [Google Scholar]
- 43.Paluch AE, Bajpai S, Bassett DR, Carnethon MR, Ekelund U, Evenson KR, et al. Daily steps and all-cause mortality: a meta-analysis of 15 international cohorts. Lancet Public Health. 2022. Mar;7(3):e219–28. [DOI] [PMC free article] [PubMed] [Google Scholar]
- 44.Ramakrishnan R, He JR, Ponsonby AL, Woodward M, Rahimi K, Blair SN, et al. Objectively measured physical activity and all cause mortality: A systematic review and meta-analysis. Prev Med. 2021. Feb;143:106356. [DOI] [PubMed] [Google Scholar]
- 45.Saint-Maurice PF, Troiano RP, Bassett DR, Graubard BI, Carlson SA, Shiroma EJ, et al. Association of Daily Step Count and Step Intensity With Mortality Among US Adults. JAMA. 2020. Mar 24;323(12):1151. [DOI] [PMC free article] [PubMed] [Google Scholar]
- 46.Sheng M, Yang J, Bao M, Chen T, Cai R, Zhang N, et al. The relationships between step count and all-cause mortality and cardiovascular events: A dose-response meta-analysis. J Sport Health Sci. 2021. Dec;10(6):620–8. [DOI] [PMC free article] [PubMed] [Google Scholar]
- 47.Russell LB, Norton LA, Pagnotti D, Sevinc C, Anderson S, Finnerty Bigelow D, et al. Using Clinical Trial Data to Estimate the Costs of Behavioral Interventions for Potential Adopters: A Guide for Trialists. Med Decis Making. 2021. Jan;41(1):9–20. [DOI] [PMC free article] [PubMed] [Google Scholar]
- 48.Michie S, Johnston M, Francis J, Hardeman W, Eccles M. From Theory to Intervention: Mapping Theoretically Derived Behavioural Determinants to Behaviour Change Techniques. Appl Psychol. 2008;57(4):660–8. [Google Scholar]
- 49.Samuelson W, Zeckhauser R. Status quo bias in decision making. J Risk Uncertainty. 1988. Mar 1;1(1):7–59. [Google Scholar]
- 50.Keren G, Roelofsma P. Immediacy and Certainty in Intertemporal Choice. Organ Behav Hum Decis Process. 1995. Sep 1;63(3):287–97. [Google Scholar]
- 51.Bault N, Coricelli G, Rustichini A. Interdependent Utilities: How Social Ranking Affects Choice Behavior. PLoS One. 2008. Oct 22;3(10):e3477. [DOI] [PMC free article] [PubMed] [Google Scholar]
- 52.Liberman N, Förster J. Goal gradients, expectancy, and value. In: Goal-directed behavior. New York, NY, US: Psychology Press; 2012. p. 151–73. (Frontiers of social psychology). [Google Scholar]