

Abstract
Introduction
Desulfovibrio vulgaris Hildenborough is a gram-negative anaerobic bacterium belonging to the sulfate-reducing bacteria that exhibits highly versatile metabolism. By switching from one energy mode to another depending on nutrients availability in the environments„ it plays a central role in shaping ecosystems. Despite intensive efforts to study D. vulgaris energy metabolism at the genomic, biochemical and ecological level, bioenergetics in this microorganism remain far from being fully understood. Alternatively, metabolic modeling is a powerful tool to understand bioenergetics. However, all the current models for D. vulgaris appeared to be not easily adaptable to various environmental conditions.
Methods
To lift off these limitations, here we constructed a novel transparent and robust metabolic model to explain D. vulgaris bioenergetics by combining whole-cell proteomic analysis with modeling approaches (Flux Balance Analysis).
Results
The iDvu71 model showed over 0.95 correlation with experimental data. Further simulations allowed a detailed description of D. vulgaris metabolism in various conditions of growth. Altogether, the simulations run in this study highlighted the sulfate-to-lactate consumption ratio as a pivotal factor in D. vulgaris energy metabolism.
Discussion
In particular, the impact on the hydrogen/formate balance and biomass synthesis is discussed. Overall, this study provides a novel insight into D. vulgaris metabolic flexibility.
Keywords: metabolic model, flux balance analysis, proteomic, Desulfovibrio vulgaris Hildenborough, sulfate respiration, hydrogen metabolism, formate metabolism, metabolic flexibility
1 Introduction
Sulfate reducing microorganisms (SRMs) are anaerobic bacteria and archaea, not phylogenetically related, coupling dissimilatory sulfate (SO42–) reduction into sulfide (H2S) to the oxidation of organic compounds (such as lactate, pyruvate, formate or ethanol) or molecular H2 to support growth (Muyzer and Stams, 2008). SRMs are ubiquitous in anoxic environments such as flooded soils, sediments, landfills, lagoons, where they have an important role in sulfur and carbon cycles (Nriagu, 1985; Muyzer and Stams, 2008). In the absence of sulfate, they can also ferment a variety of organic substrates (such as lactate, pyruvate or ethanol) to acetate, hydrogen (H2) and carbon dioxide (CO2). This pathway is regulated by the H2-partial pressure and occurs mostly when H2-oxidizing microorganisms are present in the environment (such as methanogens) (Bryant et al., 1977; McInerney et al., 1979; Stolyar et al., 2007). Hence, depending on sulfate availability in the environment, SRMs can either contribute as intermediate in microbial degradation of complex organic matter in anoxic environments in syntrophy with methanogens, or compete with methanogens for hydrogen and acetate while providing electron donor to a great diversity of aerobic chemotrophic or anoxygenic phototrophic microorganisms (Muyzer and Stams, 2008). Therefore, SRMs play a central role in natural and engineered ecosystems (Wang et al., 2023). Besides, SRMs exhibit a great metabolic versatility, switching from one energy mode to another depending on nutrients availability, which allow them to adapt to various environmental conditions and persist into several ecological niches (Muyzer and Stams, 2008). SRMs, throughout the production of toxic and corrosive hydrogen sulfide, can cause significant damages to ecosystems (Malone Rubright et al., 2017). Beyond the environmental impact, they are also responsible of unwanted biocorrosion of ferrous metals (Enning and Garrelfs, 2014). Moreover, it is now well recognized that SRMs also contribute to human health disorders such as in Inflammatory Bowel diseases (Carbonero et al., 2012). Nevertheless, SRMs can also be exploited beneficially in industrial processes such as bio-capture and recovery of heavy metals from wastewater (Hao et al., 2014), or in depollution processes of toxic metals and radionuclides (Qian et al., 2019). Given the importance of SRMs in human health, environment and industrial microbiology, a fundamental understanding of SRMs energy metabolism is crucial for better prediction of SRMs activities in the environment. This will contribute to a better control of the entire ecosystem.
Among SRMs, Desulfovibrio vulgaris Hildenborough (DvH), a Gram-negative anaerobic bacterium, is one representative of SRMs that has been extensively studied at the genomic, biochemical and ecological level (Heidelberg et al., 2004). While lactate is preferentially used, this bacterium can also utilize formate or ethanol as carbon and energy source (Heidelberg et al., 2004; Tao et al., 2007). In a sulfate-containing medium, the bacterium will perform sulfate respiration which leads to hydrogen sulfide synthesis. It was initially proposed that electrons and protons generated through lactate oxidation could serve as substrates to membrane-associated hydrogenases (Keller and Wall, 2011). The hydrogen produced could then diffuse across the inner membrane and be oxidized by periplasmic hydrogenases, thus providing electrons for sulfate reduction while the protons released from this reaction would contribute to chemiosmotic gradient (Keller and Wall, 2011). This energy conserving model called hydrogen-cycling is reinforced by the transient presence of hydrogen during DvH growth (Smith et al., 2019). Alternatively, the oxidation of lactate could lead to the formation of formate through the pyruvate formate lyase (PFL) that catalyzes the interconversion of pyruvate into formate and acetyl-coA (Kazakov et al., 2015). In analogy with the hydrogen-cycling model, electrons and protons released from formate oxidation by periplasmic formate dehydrogenases (FDHs) can cycle back to the cytoplasm through transmembrane electron transport complexes (TMCs) for sulfate reduction while contributing to proton gradient across the membrane (Heidelberg et al., 2004). Using ATP synthase activity, this anaerobic respiration allows production of a higher amount of energy than fermentation. In comparison, fermentation alone generates 1 mol ATP per mol of lactate, whereas sulfate respiration generates 2.5 mol ATP per mol of lactate, showcasing its higher energy yield. Nevertheless, the concept of hydrogen- or formate-cycling remains controversial (Voordouw, 2002; Keller and Wall, 2011), and another model was proposed in which multiple electron transfer routes operate simultaneously: the hydrogen-/formate-cycling model and an independent pathway involving membrane-associated electron transfer complexes (Noguera et al., 1998; Sim et al., 2013).
To better understand the mechanisms involved in hydrogen and formate metabolisms, which are key metabolites in interspecies transfer within ecosystems, metabolic models could serve as powerful tools (Heirendt et al., 2019). Several metabolic models have been previously developed for DvH. One model was reconstructed based on balance equations to study the carbon metabolite exchanges between DvH and Methanococcus maripaludis, as well as their impact on the latter growth (Stolyar et al., 2007). Another model was developed to create and validate a numerical tool (OptCom) dedicated to the simulation of the complexity of metabolic exchanges within the context of a microbial consortium (Zomorrodi and Maranas, 2012). A third model investigated DvH ability to adapt to its environment, particularly with regard to available energy sources, by implementing specific reactions such as those of the Wood–Ljungdahl pathway (Flowers et al., 2018). This genome-based model is, to date, the most comprehensive and complex metabolic model. More recently, a mass transfer model providing a macroscopic representation of SRM metabolism was also constructed (Smith et al., 2019). However, this model does not give any information on the metabolic fluxes of the respective pathways involved in SRM metabolism. To our knowledge, no models accurately captured yet the hydrogen-/formate metabolism in DvH. Indeed, none of these models were designed to simulate production/utilization of hydrogen and formate by DvH. Therefore, they are uncomplete in terms of pathways involved. Furthermore, they also suffer from limited available and consistent experimental dataset. The objective of the present study was to reconstruct a transparent and robust metabolic model for DvH, combining proteomic-scale reconstruction, and metabolic analysis with the aim to investigate the hydrogen and formate metabolism of DvH.
2 Materials and method
2.1 Media and growth conditions
Pure cultures of DvH were typically grown at 37°C under anaerobic conditions to mid-exponential phase in Hungate tubes in Starkey (SKY) medium containing 0.5 g L–1 K2HPO4; 2 g L–1 NH4Cl; 2 g L–1 MgSO4, 7⋅H2O; 4 g L–1 Na2SO4; 1 g L–1 yeast extract (Difco laboratories), 3 6 g L–1 sodium lactate (adapted from Starkey, 1948); 1 mL L–1 trace elements [10.75 g L–1 MgO; 2 g L–1 CaCO3; 6.2 g L–1 FeSO4, 7⋅H2O; 1.44 g L–1 ZnSO4, 7⋅H2O; 0.84 g L–1 MnSO4, 7⋅H2O; 0.25 g L–1 CuSO4, 5⋅H2O; 0.9 g L–1 CoSO4, 7⋅H2O; 0.06 g L–1 BO3H3; 1 g L–1 Mo7O24 (NH4)6, 4⋅H2O; 0.04 g L–1 Ni(NO3)2, 6⋅H2O; 0.02 g L–1 Na2SeO3] adapted from Traore et al. (1983), 0.0001% β-Mercaptoethanol and buffered to pH 7.2 with NaOH. For proteomic analysis, DvH were grown in 1 L Duran bottle containing 700 mL SKY medium.
2.2 Analytical methods
Total biomass concentrations (cell dry weight) were determined using 30 mL cell culture. Cells were harvested by centrifugation for 10 min at room temperature and the harvested cells were dried at 65°C under vacuum (Thermo Scientific Savant DNA120).
Organic acid quantification was determined by high-performance liquid chromatography (HPLC) using 1200 Infinity HPLC system (Agilent) equipped with a Hi-Plex H 300 mm × 7.7 mm column (Agilent). Samples of 25 μL that were previously clarified through 0.2 μm filters were applied to the columns equilibrated in 10 mmol L–1 H2SO4 with a flow of 0.6 mL min–1 at 50°C/30 min/RI detection (Agilent).
Hydrogen, carbon dioxide, and hydrogen sulfide contents in the gas phase were determined by gas chromatography (Agilent 4890D) equipped with a thermal conductivity detector. The gases were separated using a GS-CARBONPLOT column (30 m × 0.535 mm × 3.00 mm) using N2 at high purity as carrier gas. The injector temperature was 80°C, the oven temperature was 30°C and the detector temperature was 90°C.
Total sulfide ions content was determined based on colorimetric assay. First, the pH of the cell culture was increased by adding sodium hydroxide to 0.25 N final concentration. This aims at shifting the equilibrium toward the aqueous HS– or S2– forms which are more soluble than gaseous H2S. Besides, this also contributed to cell lysis, thus releasing intracellular sulfide ions. Following 30 min incubation at room temperature, samples were clarified through a 0.22 μm filter to remove cell debris, and 10–200 μL were used in the assay as described previously (Guiral et al., 2005).
2.3 Proteomic analysis
Samples for proteomic analysis were obtained by harvesting 1 L cell culture by centrifugation at 3000 × g for 20 min. The cell pellet (0.46 g wet weight) was resuspended with 10 mmol L–1 Tris–HCl pH 7.6, 5 mmol ethylenediaminetetraacetate (as buffer A) supplemented with protease inhibitor cocktail (SigmaFast tablets) and cells were broken by three passages through a cell disruptor (Constant system Ltd., Northants, UK) at 1.6 Kbar. Unbroken cells and cell debris were removed by centrifugation at 12,000 × g, 4°C, for 15 min, soluble and membrane fractions were separated by ultracentrifugation at 150,000 × g, 4°C for 45 min. Proteins (10 mg mL–1) from the membrane fraction were solubilized in buffer A, supplemented with 10% (v/v) glycerol and 1% (w/v) n-Dodecyl-β-D-maltoside at 4°C for 1 h. Unsolubilized proteins were removed by ultracentrifugation as described previously. The total proteins in the soluble and membrane fractions were identified by shotgun proteomics as described in Prioretti et al. (2023). Briefly, samples (40 μg) were loaded on a denaturing stacking gel (5% acrylamide), ran for approximately 5 min at 25 mA and 250 V, then stained with Coomassie blue. The protein band visible in the stacking gel was cut out from the gel and stored at −20°C before LC-MS/MS analysis. Stacking gels for soluble and membrane protein fractions were performed in triplicate, then the bands were digested by Trypsin/Lys C protease (Promega), after a classical double step of reduction and alkylation of cysteine amino acids. Tryptic peptides were analyzed on a Q-Exactive Plus mass spectrometer (Thermo Fisher Scientific) coupled to a nano-LC system (Ultimate 3000, Dionex) equipped with an EASY-spray column (PepMaP TM RSLC, C18, 2, 75 μm ID × 15 cm, Thermo Fisher Scientific), after a separation by a two step -linear gradient from 4 to 40% of mobile phase B [0.1% (vol/vol) formic acid (FA)/ 80% (vol/vol) acetonitrile] in mobile phase A [0.1% (vol/vol) FA] for 52 min. For peptide ionization in the nanosource spray, voltage was set at 1.9 kV and the capillary temperature at 275°C. Top 10 Data Dependent workflow was used in a 350–1900 m/z range and a dynamic exclusion of 30 s. Data were processed by Proteome Discoverer (Thermo Fisher, version: 2.4.1.15) using the Sequest HT algorithm with the search following settings : databank DvH- (taxonomy ID 882) from Uniprot (version 2021-02-04); trypsin enzyme (maximum 2 missed cleavages); fixed modification: carbamidomethyl (Cys); variable modification: oxidation (Met); mass values specific for monoisotopic; precursor mass tolerance: ± 10 ppm; fragment mass tolerance: ± 0.02 Da. Peptide validation was based on score threshold at maximum Delta Cn 0.05. Proteins were identified if minimum 2 unique peptide sequences more than 6 amino acids passed the high confidence filter. For each replicate, results from soluble and membrane fractions were then combined as a single file. The mass spectrometry proteomics data will be deposited to the ProteomeXchange Consortium (Deutsch et al., 2023) via the PRIDE (Perez-Riverol et al., 2022) partner repository with the dataset identifier PXD046638.
2.4 Model reconstruction
Several steps were carried out to reconstruct the iDvu71 model. First, the considered metabolic network was reconstructed from the proteomic study performed in the present study and BiGG, KeGG and MetaNetx databases (Kanehisa, 2000; Ganter et al., 2013; King et al., 2016). The reconstructed metabolic model is presented in the Supplementary File 1 as a SBML file. To ensure standardized nomenclature and to facilitate comparison with other genome-scale metabolic models, all reactions and metabolites in the model were named with Kegg IDs.
Then, the network reconstruction was converted into a mathematical model and, finally, all simulations were carried out using the 3rd version of the Constraint-Based Metabolic Modeling Toolbox (COBRA Toolbox) (Heirendt et al., 2019) in the Matlab environment. Flux Balance Analysis (FBA) was employed as a method to predict the steady-state flux distribution in the metabolic network, by optimizing an objective function, typically biomass production or a specific metabolite production rate, subjected to constraints on the system’s available resources.
2.5 Mathematical determination of simulated concentrations based on simulated metabolic fluxes and model validation
Starting from the initial metabolic concentrations at 5.5 h, which corresponds to the beginning of the growth phase, the kinetics of metabolic concentrations were calculated using a time step of 0.01 h. For each time step, the concentration of each metabolite is updated using Euler’s method (Formula 1):
| (1) |
where Ci(t + Δt), in g L–1, is the predicted concentration of the ith metabolite at time t, Ci(t) is the concentration of the metabolite at the current time step, is the ith metabolic flux simulated by FBA, X(t) is the biomass concentration as g L–1, at time t, and Δt is the time step (0.01 h).
The validation of iDvu71 was based on the comparison of simulated and experimental metabolite and biomass concentrations. To validate the model accuracy, the Pearson correlation coefficient was calculated between simulated and experimental data.
3 Results
3.1 Proteomic analysis
To construct an accurate model of DvH metabolism, proteomes from three independent cultures of DvH grown to exponential phase (OD600 nm ∼ 0.6) in SKY medium were analyzed by LC-MS/MS. Table 1 shows the results obtained for the combined soluble and membrane fractions of one biological replicate. Protein abundance was evaluated by spectral counting as illustrated by PSM (as peptide spectrum match) number for all replicates and listed in Supplementary Table 1. The genome of DvH has 3351 predicted protein-encoding genes (Heidelberg et al., 2004), and a total of 1507–1669 unique proteins were detected in the three independent experiments corresponding to 42–47% genome coverage (Supplementary Table 1). Among them, attention was first paid toward the proteins involved in lactate metabolism, sulfate reduction and energy metabolism. All the key enzymes involved in the lactate oxidation in DvH, which belongs to the gene cluster “luo” (DVU3025-33) (Wall et al., 2008; Vita et al., 2015) were detected with confidence (Table 1). In addition, two paralogs (DVU0390 and DVU0253) of the D-LDH located in the “luo” operon (Vita et al., 2015) and one ortholog of the L-LDH (DVU2789) from Escherichia coli (Dong et al., 1993) were also identified with confidence in these conditions (Table 1). Moreover, all proteins involved in the respiration of sulfate showed higher PSM number relative to those from other pathways indicating a higher global relative abondance (Table 1). This included two orthologs of sulfate permeases (DVU0279 and DVU0053), the sulfate adenylyltransferase (Sat), the adenylyl-sulfate reductase (AprAB), the dissimilatory sulfate reductase (DsrAB), the key sulfur transfer protein (DsrC), as well as the dissimilatory sulfite-reductase (DsrMKJOP) and the quinone- interacting oxidoreductase (QmoABC) complexes (Figure 1). Interestingly, both enzymes involved in the hydrogen- and formate-cycles were identified under these growth conditions (Figure 1). For instance, four different hydrogenases were identified in these samples (Table 1). This includes two membrane-bound [NiFe]-hydrogenases belonging to the coo and ech genes clusters and two periplasmic hydrogenases, the [NiFe]-hydrogenases (Hyn-1) and the [NiFeSe]-hydrogenase (Hys) (Wall et al., 2008; Keller and Wall, 2011; Baffert et al., 2019). While the expression of hydrogenases is thought to be constitutive in the cells (Ogata and Lubitz, 2021), the periplasmic Hys was found to be the most abundant periplasmic hydrogenase under these conditions, whereas the low PSM values for other hydrogenases suggested that they are considerably less abundant in the cells under these growth conditions (Table 1). Moreover, enzymes involved in formate metabolism in DvH were also identified with confidence (Table 1). This included two isoforms of the PFLs (Keller and Wall, 2011), as well as subunits belonging to the membrane-associated FDH (FdhM) and the cytochrome c3-associated periplasmic FDH (FdhABC3) (Table 1).
TABLE 1.
Tandem mass spectrometry of DvH under lactate/sulfate respiration.
| Enzymes | Subunit/ Protein |
Accession | Locus tag | MW | PSM | Cov | Pep |
| Lactate utilization | |||||||
| Pyruvate: ferredoxin oxidoreductase subunit A | PorA | Q72BR5 | DVU_1569 | 61.8 | 13 | 23 | 8 |
| Pyruvate: ferredoxin oxidoreductase subunit B | PorB | Q72BR4 | DVU_1570 | 30.8 | 10 | 37 | 7 |
| Pyruvate: ferredoxin oxidoreductase | PFOR | Q726T1 | DVU_3025 | 30.8 | 402 | 37 | 7 |
| L-lactate permease | Ltp | Q726T0 | DVU_3026 | 60.8 | 6 | 13 | 6 |
| D-lactate dehydrogenase subunit A | D-LdII-A | Q726S9 | DVU_3027 | 49.3 | 85 | 81 | 32 |
| D-lactate dehydrogenase subunit B | D-LdII-B | Q726S8 | DVU_3028 | 45.9 | 32 | 45 | 16 |
| Phosphate acetyl transferase | Pta | Q726S7 | DVU_3029 | 76.8 | 121 | 75 | 41 |
| Acetate kinase | Ack | Q726S6 | DVU_3030 | 44.1 | 77 | 60 | 28 |
| Conserved hypothetical protein | Q726S5 | DVU_3031 | 39.0 | 12 | 27 | 8 | |
| L-lactate dehydrogenase subunit A | LldG | Q726S4 | DVU_3032 | 22.6 | 21 | 63 | 11 |
| L-lactate dehydrogenase subunit B | LldH | Q726S3 | DVU_3033 | 79.6 | 106 | 63 | 43 |
| Lactate dehydrogenase | P62051 | DVU_0600 | 32.2 | 2 | 13 | 2 | |
| D-lactate dehydrogenase subunit A (Dld-II family) | Q72DV3 | DVU_0826 | 47.4 | 2 | 4 | 2 | |
| D-lactate dehydrogenase subunit B (Dld-II family) | Q72DV2 | DVU_0827 | 50.1 | 7 | 22 | 6 | |
| D-lactate dehydrogenase (Dld-II family) | Q72F25 | DVU_0390 | 48.2 | 25 | 51 | 17 | |
| D-lactate dehydrogenase (Dld-II family) | Q72FG1 | DVU_0253 | 103 | 88 | 62 | 52 | |
| L-lactate dehydrogenase (LldG family) | Q72B57 | DVU_1781 | 23.9 | – | – | – | |
| L-lactate dehydrogenase (LldH family) | Q72B56 | DVU_1782 | 52.6 | 4 | 8 | 4 | |
| Lactate permeases, putative | Q72B55 | DVU_1783 | 27.4 | 3 | 14 | 2 | |
| Q72A87 | DVU_2110 | 57.9 | 5 | 9 | 3 | ||
| Q729R4 | DVU_2285 | 53.0 | 5 | 13 | 5 | ||
| Q725Z0 | DVU_3284 | 57.7 | – | – | – | ||
| Sulfate reduction | |||||||
| Sulfate permeases | Q72FD5 | DVU_0279 | 60.6 | 9 | 21 | 8 | |
| Q72G10 | DVU_0053 | 68.1 | 5 | 14 | 4 | ||
| Sulfate adenylyl transferase | Sat | Q72CI8 | DVU_1295 | 47.4 | 301 | 87 | 49 |
| Adenylyl sulfate reductase, AprAB complex, subunit B | AprB | Q72DT3 | DVU_0846 | 18.5 | 47 | 81 | 8 |
| Adenylyl sulfate reductase, AprAB comple, subunit A | AprA | Q72DT2 | DVU_0847 | 74.6 | 545 | 80 | 61 |
| Sulfite reductase, DsrABC complex, subunit A | DsrA | P45574 | DVU_0402 | 49.1 | 153 | 74 | 37 |
| Sulfite reductase, DsrABC complex, subunit B | DsrB | P45575 | DVU_0403 | 42.5 | 117 | 59 | 28 |
| Sulfite reductase, DsrABC complex, subunit D | DsvD | Q46582 | DVU_0404 | 8.8 | 7 | 60 | 3 |
| Sulfite reductase, DsrABC complex, subunit C | DsrC | P45573 | DVU_2776 | 11.9 | 14 | 66 | 7 |
| Quinone oxidoreductase, QmoABC complex, subunit A | QmoA | Q72DT1 | DVU_0848 | 44.6 | 82 | 78 | 28 |
| Quinone oxidoreductase, QmoABC complex, subunit B | QmoB | Q72DT0 | DVU_0849 | 82.5 | 211 | 85 | 54 |
| Quinone oxidoreductase, QmoABC complex, subunit C | QmoC | Q72DS9 | DVU_0850 | 42.6 | 46 | 42 | 18 |
| Quinone oxidoreductase, QmoABC complex, hypothetical protein | QmoD | Q72DS8 | DVU_0851 | 25.8 | 63 | 86 | 17 |
| Dissimilatory sulfite reductase, DsrMKJOP complex, subunit P | DsrP | Q72CJ7 | DVU_1286 | 43.5 | – | – | – |
| Dissimilatory sulfite reductase, DsrMKJOP complex, subunit O | DsrO | Q72CJ6 | DVU_1287 | 29.0 | 28 | 76 | 17 |
| Dissimilatory sulfite reductase, DsrMKJOP complex, subunit J | DsrJ | Q72CJ5 | DVU_1288 | 14.5 | – | – | – |
| Dissimilatory sulfite reductase, DsrMKJOP complex, subunit K | DsrK | Q72CJ4 | DVU_1289 | 60.7 | 40 | 54 | 20 |
| Dissimilatory sulfite reductase, DsrMKJOP complex, subunit M | DsrM | Q72CJ3 | DVU_1290 | 38.1 | 30 | 37 | 13 |
| Hydrogen metabolism | |||||||
| Membrane-bound hydrogenase Ech complex, subunit A | EchA | Q72EY4 | DVU_0434 | 69.1 | 4 | 8 | 3 |
| Membrane-bound hydrogenase Ech complex, subunit B | EchB | Q72EY5 | DVU_0433 | 31.2 | – | – | – |
| Membrane-bound hydrogenase Ech complex, subunit C | EchC | Q72EY6 | DVU_0432 | 16.8 | – | – | – |
| Membrane-bound hydrogenase Ech complex, subunit D | EchD | Q72EY7 | DVU_0431 | 14.6 | 2 | 40 | 2 |
| Membrane-bound hydrogenase Ech complex, subunit E | EchE | Q72EY8 | DVU_0430 | 40.1 | 5 | 18 | 5 |
| Membrane-bound hydrogenase Ech complex, subunit F | EchF | Q72EY9 | DVU_0429 | 14.8 | 2 | 19 | 2 |
| Membrane-bound hydrogenase Coo complex, subunit M | CooM | Q729R3 | DVU_2286 | 131.0 | 12 | 12 | 11 |
| Membrane-bound hydrogenase Coo complex, subunit K | CooK | Q729R2 | DVU_2287 | 33.7 | 7 | 8 | 3 |
| Membrane-bound hydrogenase Coo complex, subunit L | CooL | Q729R1 | DVU_2288 | 15.7 | 3 | 24 | 2 |
| Membrane-bound hydrogenase Coo complex, subunit X | CooX | Q729R0 | DVU_2289 | 22.7 | 6 | 21 | 3 |
| Membrane-bound hydrogenase Coo complex, subunit U | CooU | Q729Q9 | DVU_2290 | 19.6 | 5 | 27 | 4 |
| Membrane-bound hydrogenase Coo complex, subunit H | CooH | Q729Q8 | DVU_2291 | 40.7 | 25 | 70 | 19 |
| Hydrogenase nickel-insertion protein | HypA | Q729Q7 | DVU_2292 | 12.7 | – | – | – |
| Membrane-bound hydrogenase Coo complex, subunit F | CooF | Q729Q6 | DVU_2293 | 19.0 | – | – | – |
| [FeFe]-hydrogenase Hyd complex, subunit L | HydL | P07598 | DVU_1769 | 45.9 | – | – | – |
| [FeFe]-hydrogenase Hyd complex, subunit S | HydS | P07603 | DVU_1770 | 13.6 | – | – | – |
| [NiFeSe]-hydrogenase Hys complex, subunit B | HysB | Q72AS4 | DVU_1917 | 33.9 | 15 | 53 | 12 |
| [NiFeSe]-hydrogenase Hys complex, subunit A | HysA | Q72AS3 | DVU_1918 | 55.8 | 96 | 67 | 33 |
| [NiFe]-hydrogenase Hyn1 complex, subunit B | HynB1 | Q06173 | DVU_1921 | 34.2 | – | – | – |
| [NiFe]-hydrogenase Hyn1 complex, subunit A | HynA1 | Q72AS0 | DVU_1922 | 62.7 | 25 | 34 | 15 |
| [NiFe]-hydrogenase Hyn2 complex, subunit B | HynB2 | P61429 | DVU_2525 | 34.5 | – | – | – |
| [NiFe]-hydrogenase Hyn2 complex, subunit A | HynA2 | Q728S7 | DVU_2526 | 61.2 | – | – | – |
| Formate metabolism | |||||||
| Pyruvate formate lyase activating enzyme, putative | Q729S8 | DVU_2271 | 32.4 | – | – | – | |
| Pyruvate formate lyase, putative | Q729S7 | DVU_2272 | 91.2 | 13 | 15 | 9 | |
| Pyruvate formate lyase, putative | Q727N1 | DVU_2824 | 93.9 | 28 | 35 | 22 | |
| Pyruvate formate lyase activating enzyme, putative | Q727N0 | DVU_2825 | 33.7 | – | – | – | |
| Formate dehydrogenase FdhABC3 complex, cytochrome c3 subunit | Fdhc3 | Q727P6 | DVU_2809 | 15.8 | – | – | – |
| Formate dehydrogenase formation protein | FdhE | Q727P5 | DVU_2810 | 29.6 | – | – | – |
| Formate dehydrogenase FdhABC3 complex, subunit B | FdhB | Q727P4 | DVU_2811 | 24.5 | 2 | 10 | 1 |
| Formate dehydrogenase FdhABC3 complex, subunit A | FdhA | Q727P3 | DVU_2812 | 113.3 | 52 | 47 | 34 |
| Formate dehydrogenase FdhAB complex, subunit α | Fdhα | Q72EJ1 | DVU_0587 | 111.2 | – | – | – |
| Formate dehydrogenase FdhAB complex, subunit β | Fdhβ | Q72EJ0 | DVU_0588 | 26.4 | – | – | – |
| Formate dehydrogenase FdhM complex, subunit B | CfdB | Q728X1 | DVU_2481 | 29.2 | 2 | 16 | 2 |
| Formate dehydrogenase FdhM complex, subunit A | CfdA | Q728X0 | DVU_2482 | 110.8 | 48 | 43 | 30 |
| Formate dehydrogenase FdhM complex, cytochrome c putative | CfdE | Q728W9 | DVU_2483 | 61.9 | 11 | 23 | 8 |
| Formate dehydrogenase FdhM complex, cytochrome c putative | CfdD | Q728W8 | DVU_2484 | 47.7 | 7 | 13 | 3 |
| Transmembrane electron transport complexes | |||||||
| Quinone reductase complex QrcDCBA, subunit D | QrcD | Q72E86 | DVU_0692 | 47.5 | 8 | 16 | 6 |
| Quinone reductase complex QrcDCBA, subunit C | QrcC | Q72E85 | DVU_0693 | 29.0 | 16 | 39 | 8 |
| Quinone reductase complex QrcDCBA, subunit B | QrcB | Q72E84 | DVU_0694 | 72.3 | 105 | 81 | 36 |
| Quinone reductase complex QrcDCBA, subunit A | QrcA | Q72E83 | DVU_0695 | 7.4 | – | – | – |
| Transmembrane complex TmcABCD, subunit A | TmcA | Q72FF1 | DVU_0263 | 13.5 | – | – | – |
| Transmembrane complex TmcABCD, subunit B | TmcB | Q72FF0 | DVU_0264 | 49.6 | 46 | 51 | 21 |
| Transmembrane complex TmcABCD, subunit C | TmcC | Q72FE9 | DVU_0265 | 24.0 | 8 | 19 | 4 |
| Transmembrane complex TmcABCD, subunit D | TmcC | Q72FE8 | DVU_0266 | 44.9 | 19 | 43 | 11 |
| High molecular weight cytochrome complex Hmc, protein 6 | HmcF | P33393 | DVU_0531 | 52.7 | 29 | 43 | 17 |
| High molecular weight cytochrome complex Hmc, protein 5 | HmcE | P33392 | DVU_0532 | 25.3 | – | – | – |
| High molecular weight cytochrome complex Hmc, protein 4 | HmcD | P33391 | DVU_0533 | 5.8 | – | – | – |
| High molecular weight cytochrome complex Hmc, protein 3 | HmcC | P33390 | DVU_0534 | 43.1 | 2 | 6 | 2 |
| High molecular weight cytochrome complex Hmc, protein 2 | HmcB | P33389 | DVU_0535 | 40.0 | 18 | 47 | 14 |
| High molecular weight cytochrome complex Hmc, protein 1 | HmcA | P24092 | DVU_0536 | 58.9 | 12 | 26 | 16 |
| Cytochrome c | DhcA | Q727R4 | DVU_2791 | 27.8 | – | – | – |
| Rnf complex, subunit C | RnfC | Q727R3 | DVU_2792 | 43.5 | 26 | 60 | 14 |
| Rnf complex, subunit D | RnfD | Q727R2 | DVU_2793 | 33.7 | – | – | – |
| Rnf complex, subunit G | RndG | Q727R1 | DVU_2794 | 20.1 | 8 | 49 | 7 |
| Rnf complex, subunit E | RnfE | Q727R0 | DVU_2795 | 23.8 | 5 | 17 | 3 |
| Rnf complex, subunit A | RnfA | Q727Q9 | DVU_2796 | 20.8 | – | – | – |
| Rnf complex, subunit B | RnfB | Q727Q8 | DVU_2797 | 30.9 | 4 | 18 | 4 |
| Membrane associated lipoprotein | ApbE | Q727Q7 | DVU_2798 | 35.0 | – | – | – |
| Ethanol metabolism | |||||||
| Aldehyde oxidoreductase | Aor | Q72BS5 | DVU_1559 | 97.4 | 66 | 42 | 30 |
| Iron-containing alcohol dehydrogenases | Adh1 | Q729E6 | DVU_2405 | 41.7 | 111 | 64 | 27 |
| Q729Z6 | DVU_2201 | 41.9 | 37 | 52 | 17 | ||
| Q72F61 | DVU_0353 | 39.4 | 24 | 54 | 15 | ||
| Q727H0 | DVU_2885 | 42.0 | 7 | 25 | 5 | ||
| Q727F0 | DVU_2905 | 41.0 | 3 | 16 | 3 | ||
| Adh2 | Q729F5 | DVU_2396 | 41.0 | 2 | 6 | 2 | |
| Q728Q8 | DVU_2545 | 40.0 | – | – | – | ||
| NADH oxidoreductase complex Flx, subunit A | FlxA | Q729F2 | DVU_2399 | 31.0 | 24 | 64 | 13 |
| NADH oxidoreductase complex Flx, subunit B | FlxB | Q729F1 | DVU_2400 | 39.4 | 20 | 35 | 11 |
| NADH oxidoreductase complex Flx, subunit CD | FlxCD | Q729F0 | DVU_2401 | 54.1 | 46 | 74 | 22 |
| Hetero disulfide reductase complex Hdr, subunit A | HdrA | Q729E9 | DVU_2402 | 70.9 | 52 | 50 | 25 |
| Hetero disulfide reductase complex Hdr, subunit B | HdrB | Q729E8 | DVU_2403 | 35.1 | 17 | 45 | 10 |
| Hetero disulfide reductase complex Hdr, subunit C | HdrC | Q729E7 | DVU_2404 | 21.0 | 6 | 25 | 4 |
| Gluconeogenesis | |||||||
| Pyruvate kinase | Pk | Q728T8 | DVU_2514 | 50.4 | 31 | 55 | 17 |
| Phosphoenolpyruvate synthase | PpsA | Q72B07 | DVU_1833 | 132.6 | 184 | 68 | 85 |
| Pyruvate carboxylase | Pc | Q72B06 | DVU_1834 | 136.3 | 111 | 53 | 55 |
| 2,3 bisphosphoglycerate-independent phosphoglycerate mutase | PGM | Q72BL6 | DVU_1619 | 54.1 | 8 | 24 | 7 |
| Phosphoglycerate kinase | PGAM | P62412 | DVU_2529 | 414 | 41 | 62 | 18 |
| Glyceraldehyde-3-phosphate dehydrogenases | GAPDH | Q72EL3 | DVU_0565 | 37.0 | 28 | 67 | 18 |
| GAPDH | Q72A53 | DVU_2144 | 35.6 | 27 | 58 | 15 | |
| Fructose bi-phosphate aldolase | FBP | Q72A54 | DVU_2143 | 33.5 | 22 | 62 | 14 |
| 6-phosphofructokinase | PFK | Q72AD6 | DVU_2061 | 48.1 | 20 | 42 | 12 |
| Glucose 6-phosphate isomerase | GPI | Q725H4 | DVU_3222 | 48.7 | 18 | 38 | 13 |
| TCA cycle | |||||||
| Aconitate hydratase | CitB | Q72D65 | DVU_1064 | 67.5 | 49 | 54 | 23 |
| Isocitrate dehydrogenase | CitC | Q72EU1 | DVU_0477 | 41.5 | 24 | 53 | 17 |
| Fumarate reductase (Fdr) subunit C | FdrC | Q726D0 | DVU_3261 | 23.7 | – | – | – |
| Subunit A | FdrA | Q726C9 | DVU_3262 | 65.9 | 19 | 30 | 14 |
| Subunit B | FdrB | Q726C8 | DVU_3263 | 27.8 | 5 | 13 | 3 |
| Fumarate hydratase | FH | Q726A9 | DVU_3264 | 29.5 | 2 | 15 | 2 |
| Tartrate dehydratase | Q726A8 | DVU_3265 | 19.4 | – | – | – | |
Proteins were identified from the soluble and membrane fractions of DvH grown to exponential phase under anaerobic conditions in SKY medium as described in the section “2 Materials and methods.” Results corresponding to one of three independent experiments were reported in this table. Protein abundance (indicated by spectral counting as PSM) for all replicates is reported in Supplementary Table 1. Accession: accession number in the UniProt database. MW: theoretical molecular weight in kDa. PSM: peptide spectrum match number (given by the algorithm and corresponding to the total number of identified peptide sequences for the protein, including those redundantly identified). Cov: protein sequence coverage by the matching peptides in percentage. Pep: number of distinct peptides matching the protein sequence and unique to this protein. -: not identified by mass spectrometry.
FIGURE 1.

Overview of DvH carbon and energy metabolisms under lactate/sulfate respiration. The pathways identified with high confidence by proteomic and metabolic analysis are shown in bold arrows. Pathways relying on the presence of enzyme identification by proteomic analysis only are shown in dashed arrows. Filling colors indicate different metabolic pathways: lactate utilization related to the luo genes cluster and orthologs in green and white, respectively; gluconeogenesis in black; uncomplete TCA cycle in gray; sulfate reduction in blue; hydrogen metabolism in orange; formate metabolism in purple; ethanol metabolism in pink; membrane and soluble electron transport systems in red. Letter code for each enzyme is reported in Table 1. Fd, ferredoxin; CIT, citrate; ICT, isocitrate; OXO, 2-oxoglutarate; OAA, oxaloacetate; MAL, malate; Fum, fumarate; Suc, succinate; PEP, phosphoenolpyruvate; 3PG, 3-phosphoglycerate; 1,3-BPG, 1,3-bisphosphoglycerate; T3P, triose-3-phosphate; G6P, glucose-6-phosphate; F6P, fructose-6-phosphate; Acetyl-P, acetyl phosphate; APS, adenosine-5′-phosphate.
In both hydrogen- and formate-cycling model, electrons released in the periplasm are cycling back to the cytoplasm through transmembrane electron transport complexes, thus providing electrons for sulfate reduction and energy conservation in DvH (Keller and Wall, 2011; Tang et al., 2021). Among them, the quinone reductase complex (QrcDCBA) (Venceslau et al., 2010) and the transmembrane complex (TmcABCD) were identified with high confidence (Table 1) in these samples. Moreover, the high molecular weight cytochrome (HmcBCDE) (Venceslau et al., 2010) and the Rnf complex, which most likely acts as proton-pumping ferredoxin:cyt c3 oxidoreductase or ferredoxin:NAD+ oxidoreductase (Venceslau et al., 2010), were also detected by proteomic analysis (Table 1). Altogether, these results suggested that both hydrogen- and formate-cycles operate simultaneously during lactate oxidation under these conditions (Figure 1). Nevertheless, it is important to note that no transient formate was detected by HPLC in these samples (Supplementary Figure 1) by contrast with hydrogen during the various growth phases. The absence of formate in the cell supernatant could be explained by the fact that formate was metabolized straight after being produced at significant rate, or not excreted by the cell, or below the HPLC detection limit.
Strikingly, proteomic analysis revealed the presence of six alcohol dehydrogenases (Adhs), with Adh1 (DVU2405) being the most abundant (Table 1). This is in in line with previous studies showing that DVU2405 is one of the most highly expressed genes in cells grown in lactate/sulfate medium (Haveman et al., 2003; Zhang et al., 2006). It is assumed that Adh1 could function with the Hdr-Flx complex, identified with high confidence in these samples too (Table 1). The Hdr-Flx complex is formed by two sub-complexes: an HdrABC-like components involved in “flavin-based electron bifurcation/confurcation” linked to a flavin-dependent oxidoreductase named FlxABCD (Appel et al., 2021). It was proposed that during ethanol/sulfate growth, the NADH formed during ethanol oxidation by Adh1 is reoxidized via electron bifurcation by the Hdr-Flx complex to ferredoxins and a second electron acceptor, most likely DsrC (Ramos et al., 2015). By contrast, during fermentation Hdr-Flx is assumed to be involved in NAD+ recycling via electrons confurcation from reduced ferredoxins and the reduced DsrC dithiol. The NADH formed through this reaction would serve as reducing equivalent for the reduction of acetaldehyde to ethanol by Adh1 (Ramos et al., 2015). Given that no ethanol was detected by HPLC in the cell culture supernatant, here we propose that ethanol produced from acetyl-coA could be oxidized by Adh1 while producing NADH, which is used as electron donor for the reduction of the ferredoxin pool and DsrC through “flavin-based electron bifurcation” by Hdr-Flx, thus providing additional reducing equivalent for sulfate reduction (Figure 1). This is in line with previous studies on Desulfovibrio alaskensis G20 that pointed toward the involvement of Hdr-Flx complex in pyruvate/sulfate respiration, although it is not essential for growth (Meyer et al., 2014).
3.2 Reconstruction of the iDvu71 model
By combining the proteomic data obtained in the present study to information from BiGG, KeGG, MetaNetx databases, a simplified metabolic model called iDvu71 was reconstructed. The main metabolic pathways considered in this model were gluconeogenesis, fermentative pathways, and the uncomplete TCA cycle. The addition of the pentose phosphate pathway was carried out based on 13C tracing experiments (Tang et al., 2007). Dissimilatory sulfate reduction, taking place in several steps (Sim et al., 2017), from the cytoplasmic reduction of sulfate to the production of hydrogen sulfide was also included in the model (Voordouw, 1995; Sim et al., 2017; Baffert et al., 2019; Zhu et al., 2019). Based on the proteomic analysis conducted in the present study, the ethanol pathway including alcohol dehydrogenases (Adhs) and aldehyde dehydrogenase (Aor) that may be related to the acetate synthesis (Pereira et al., 2008) was also integrated. The addition of all these metabolic reactions enlarged the diversity of metabolites that can be consumed by DvH. Once reconstructed, iDvu71, was composed of 71 chemical reactions and 81 metabolites.
3.3 iDvu71 validation
A comparison of simulated and measured concentrations was performed to validate the iDvu71 model. Constraints such as consumption fluxes of lactate and sulfate were imposed. These calculated fluxes, based on sulfate and lactate concentrations determined throughout growth of DvH in SKY medium (Figures 2A, B) were, 5 mmol gDCW–1 h–1 and 2.5 mmol gDCW–1h–1, respectively. These fluxes enable the determination of simulated concentrations of biomass, acetate and hydrogen which have also been experimentally determined (Figures 2C–E). It should be noted that, except acetate, no other organic acid was produced and secreted by DvH throughout the entire growth (Supplementary Figure 1). Finally, simulations were carried out for various time points, relying on the interpolation of experimental measurements to provide more accurate and consistent results. A good Pearson correlation was obtained between the experimental and simulated concentrations (Figures 2C–E). Indeed, correlations higher than 0.95 for each metabolite between experimental and simulated concentrations were obtained, validating iDvu71 model.
FIGURE 2.

Validation of iDvu71 model. Lactate and sulfate concentrations (mmol L–1) measured experimentally and interpolation of these concentrations are given in (A,B), respectively. Comparison of experimental (n ≥ 3) and simulated concentrations of DvH cells [(C), in g L–1], hydrogen [(D), in mmol L–1] and acetate [(E) in mmol L–1]. The round points (o) correspond to the measured experimental concentration, the dashed line (–) corresponds to the experimental interpolation, and the solid line (-) to the simulated concentration.
3.4 Influence of sulfate on hydrogen production/consumption by DvH
After validation of iDvu71 model, simulations were run with (i) the “objective function” being the maximization of the biomass synthesis flux, (ii) a constant average lactate consumption flux of 5 mmol gDCW–1 h–1, and (iii) a gradually increased rate of sulfate consumption, starting from zero and increasing by 0.1 mmol gDCW–1 h–1 per simulation run. Under these conditions, the ratio between the sulfate consumption flux and the lactate consumption flux varied from 0 to 2 (Figure 3). Interestingly, a significant shift in the behavior of DvH hydrogen metabolism was observed when this ratio reached 0.45. Below this value, hydrogen was produced by DvH whereas above it, hydrogen was utilized as energy source. Because sulfate respiration is associated with a net consumption of two ATP per sulfate, two molecules of lactate are required per molecule of reduced sulfate yielding to zero net ATP through substrate-level phosphorylation. Further oxidation of the hydrogen resulting from the lactate oxidation to pyruvate and pyruvate oxidation to acetyl-coA could contribute to the generation of protomotive force while providing the electrons required for sulfate respiration. Hence, hydrogen consumption flux increased with the concentration of sulfate in the environment. Instead, under sulfate limitation, the excess of reducing equivalents is dissipated through the production of hydrogen. However, under these conditions cell growth is regulated by the H2-partial pressure and occurs mostly when co-cultured with H2-scavenging microorganisms (Bryant et al., 1977). Therefore, the hydrogen production flux is difficult to determine experimentally under fermentative growth and can only be accessed through metabolic modeling in these conditions. This emphasizes the importance of developing accurate models to capture hidden metabolic fluxes. From these simulations, the sulfate/lactate consumption flux ratio could be considered as a relevant indicator of DvH energy metabolism. Besides, our simulations are in line with previous studies using Solidesulfovibrio fructosivorans, showing that the gaseous H2 content strongly depends on the amount of sulfate in the medium (Payne et al., 2022; Kpebe et al., 2023).
FIGURE 3.
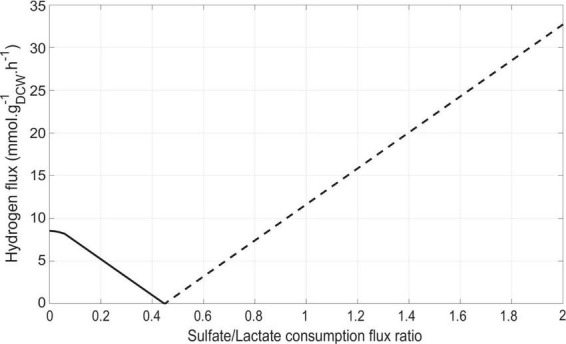
Impact of the sulfate/lactate flux ratio on hydrogen flux. Lactate consumption was set at a constant flux of 5 mmol gDCW–1 h–1. The hydrogen production and consumption fluxes are shown by solid (-) and dashed (–) lines, respectively.
Then, intracellular fluxes were simulated at the metabolic shift, i.e., a sulfate consumption flux/lactate consumption flux ratio of 0.45, or in the absence of sulfate (Figure 4). As expected, sulfate respiration was abolished in the absence of sulfate. As a consequence, the electrons generated from pyruvate oxidation by the pyruvate-ferredoxin oxidoreductase (PFOR), were transferred to hydrogenases leading to hydrogen synthesis by DvH (Figure 4). According to this simulation, succinate may be produced in the absence of sulfate (Figure 4). It was proposed that during fermentation of organic acids, part of the pyruvate is converted through reductive carboxylation to fumarate, which is then used as electron acceptor and reduced to succinate (Rabus et al., 2015). This is in line with previous studies in D. alaskensis G20 showing that succinate accumulate in the cell suspension under fermentative, sulfate-limited respiratory and co-culture conditions, while no succinate was detected in the cell suspension in excess of sulfate (Meyer et al., 2014). The addition of sulfate in the medium resulted in a twofold increase in fluxes leading to biomass synthesis (from 0.04 to 0.08 gCDW gCDW–1 h–1). Indeed, sulfate respiration leads to the production of protons gradient resulting in ATP synthesis through ATP synthase (Pohorelic, 2001). This is illustrated by a proton flux of 8.97 mmol gDCW–1 h–1 in the presence of sulfate. Such significant increase in ATP production occurring in the presence of sulfate in the environment, resulted in a rewiring carbon flux toward gluconeogenesis. This is illustrated by a twice increase in the gluconeogenesis flux that led to glucose-6-phosphate (G6P), enhancing the synthesis of biomass precursors. In this condition, the succinate production was abolished (Figure 4).
FIGURE 4.

Prediction of DvH intracellular fluxes by iDvu71. Lactate consumption flux was set at 5 mmol gDCW–1 h–1 and a sulfate consumption flux of 2.24 mmol gDCW–1 h–1, corresponding to a sulfate/lactate flux ratio of 0.45 (orange) or without sulfate consumption (green). All metabolic fluxes were expressed in mmol gDCW–1 h–1 except biomass synthesis flux which was expressed in gDCW gDCW–1 h–1. Acald: acetaldehyde; AcCoA, acetyl-coA; Pyr: pyruvate; PEP, phosphoenolpyruvate; 3PG, 3-phosphoglycerate; E4P, erythrose-4-phosphate; XYL5P, xylulose-5-phosphate; G6P, Glucose-6-phosphate; S7P, sedoheptulose-7-phosphate; OXO, 2-oxoglutarate; OAA, oxaloacetate.
3.5 Impact of hydrogen and formate-cycling mechanisms on biomass and hydrogen synthesis
In the previous set of simulations, no formate synthesis was simulated. Indeed, unlike hydrogen, no transient formate was experimentally detected in the cell culture supernatant under these growth conditions. However, as previously mentioned, some studies have highlighted the role of formate metabolism in energy conservation in DvH. Additionally, two alternative pathways for the interconversion of pyruvate to acetyl-coA were identified by proteomic analysis (Figure 1). This includes the PFOR pathway (which simultaneously produces reduced ferredoxins) and the PFLs pathway (which leads to the production of formate as a by-product). To assess the respective impact of these metabolic pathways on biomass and hydrogen synthesis, a new series of simulations was performed. During these, the metabolic fluxes of, respectively, PFOR and PFLs were imposed in two different conditions (i) without sulfate or (ii) with a sulfate/lactate consumption flux ratio of 0.45. For both conditions, a PFOR/PFLs flux ratio ranging from 0 (as no flux through PFOR) to 3 (PFOR flux was threefold higher than the PFLs one) was applied. The influence of formate production via the PFLs pathway on hydrogen evolution for both conditions is depicted in Figure 5. As expected, hydrogen was produced by DvH without sulfate in the culture medium. But in this condition, hydrogen production varied depending on the ratio between the PFOR and PFLs fluxes from 4.96 mmol gDCW–1 h–1 to 7.48 mmol gDCW–1 h–1 for a PFOR/PFLs ratio increasing from 0 to 3, respectively (Figure 5). This suggests that although both pathways can contribute to hydrogen production in DvH, it is favored through the PFOR pathway. Further simulations were performed when the PFOR activity was completely abolished (PFOR/PFLs ratio of 0) and in the absence or presence of sulfate (Figure 6). According to these simulations, the biomass synthesis flux remained unchanged whatever the presence of electrons acceptor (0.04 gDCW gDCW–1 h–1 in the absence of sulfate or 0.08 gDCW gDCW–1 h–1 for a sulfate/lactate consumption flux ratio of 0.45) (Figure 6). In fact, the results of the two simulations clearly showed that, the PFLs flux reached the same value, 4.12 gDCW–1 h–1 (Figure 6) than the one simulated for PFOR flux (Figure 4) when no constraint was imposed on the iDvu71 model to use one pathway or the other. Moreover, as the stoichiometry of both PFOR and PFLs reaction is the same (1 pyruvate for 1 acetyl-coA), no significant change was observed in downstream reactions leading to acetate and succinate synthesis (Figures 4, 6). Finally, the hydrogen flux in absence of sulfate was reduced by 40%, from 8.54 mmol gDCW–1 h–1 (Figure 4) to 5.36 mmol gDCW–1 h–1 (Figure 6). This most likely resulted from rerouting of electrons toward formate synthesis, which is accompanied by a significant increase in formate production from 0 (Figure 4) to 4.12 mmol gDCW–1 h–1 (Figure 6).
FIGURE 5.
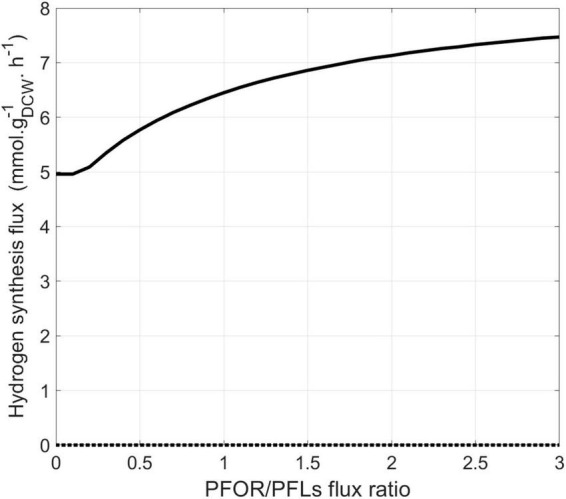
Model prediction for hydrogen synthesis flux (mmol gDCW–1 h–1) depending on the PFOR/PFLs flux ratio. Hydrogen intracellular flux was simulated in the presence (dashed line) or absence (solid line) of sulfate.
FIGURE 6.

Prediction of DvH intracellular fluxes under constrained PFOR/PFLs ratio at 0. Fluxes were calculated with a lactate consumption flux set at 5 mmol gDCW–1 h–1 and a sulfate consumption flux at 2.24 mmol gDCW–1 h–1, corresponding to a sulfate/lactate flux ratio of 0.45 (orange) or in sulfate-free condition (green). All metabolic fluxes were expressed in mmol gDCW–1 h–1 except biomass synthesis flux which was expressed in gDCW gDCW–1 h–1. The red and gray arrows indicate the main changes in DvH metabolism due to the constrained PFOR/PFLs ratio compared to simulation with unconstrained PFOR/PFLs ratio reported in Figure 4: in red, the formate excretion and in gray, the reduced hydrogen synthesis. Acald, acetaldehyde; AcCoA, acetyl-coA; Pyr, pyruvate; PEP, phosphoenolpyruvate; 3PG, 3-phosphoglycerate; E4P, erythrose-4-phosphate; XYL5P, xylulose-5-phosphate; G6P, Glucose-6-phosphate; S7P, sedoheptulose-7-phosphate; OXO, 2-oxoglutarate; OAA, oxaloacetate.
4 Discussion
In the past, several genomic, transcriptomic, or proteomic studies have provided important insights into bioenergetics pathways of SRMs using DvH as model organism (Heidelberg et al., 2004). Hence, several mechanisms were previously proposed to explain DvH bioenergetics based on the identification and quantification of transcripts and enzyme products under various growth conditions (Heidelberg et al., 2004; Zhang et al., 2006; Pereira et al., 2008; Keller and Wall, 2011). Despite these studies, the mechanism of energy conservation in DvH is far from being completely understood. One reason for this is that DvH exhibit high redundancy of enzymes (e.g., hydrogenases). It is still not clear whether each enzyme has a specialized function or if it allows functional substitution depending on environmental conditions (Baffert et al., 2019). Hence, FBA can provide a comprehensive picture of metabolic network in the cell. Three metabolic models for this organism were previously proposed. The two first (Stolyar et al., 2007; Zomorrodi and Maranas, 2012), which are closely related and can be considered as simplified models, were reconstructed to study the impact of DvH presence in syntrophy with Methanococcus maripaludis S2. However, when applied to a DvH pure culture, the simulations were not satisfactory (data not shown). Using the model from Stolyar et al. (2007), no solution was reached with the constraints that were imposed to the model. This was attributed to gaps in the metabolic network reconstructed in Stolyar work. This model was completed by Zomorrodi and Maranas (2012) who introduced some metabolic pathways such as transfer equations between extracellular compartment and the cytosol, for instance. Simulations with this model were quite satisfactory regarding biomass synthesis (0.85 correlation). However, the acetate synthesis was always underestimated by a factor 2. By carefully checking the carbon fluxes (consumption and production fluxes), it was noticed that 20% of consumed carbon was not recovered in the carbon products. This led to an unmet global carbon mass balance. The most recent model, the iJF744 model (Flowers et al., 2018), is a genome-based model. Such an approach may suffer a lack of traceability and reproducibility in the model reconstruction (Heavner and Price, 2015). Moreover, with the constraints applied in the present study, using iJF744 model, the DvH biomass concentration was overestimated whereas the acetate synthesis was underestimated. To resolve this divergence between experimental and simulated results, some modifications were performed in the metabolic network used by Flowers et al. (2018). The synthesis of formate by Formyltetrahydrofolate amidohydrolase, as proposed in the model, was replaced by the oxidation of pyruvate into formate as experimentally demonstrated by Zhou et al. (2017). This change induced a reduction in the biomass synthesis flux and an increase in acetate synthesis flux. However, even improved, the simulated fluxes remained unsatisfactory. For this reason, the choice was made to reconstruct a new transparent model, iDvu71, combined to an original proteomic analysis to investigate the role of hydrogen and formate metabolism in DvH metabolism.
The proteomic analysis was conducted using DvH grown to exponential phase in a medium containing lactate as carbon and energy source and sulfate as electron acceptor (SKY medium). This study provided an overall view of the bioenergetic metabolism of sulfate respiration in DvH (Figure 1). These data are consistent with previous proposed mechanisms based on proteomic and transcriptomic analysis under similar growth conditions (Zhang et al., 2006; Pereira et al., 2008). Especially, all the enzymes involved in the lactate utilization machinery (encoded within the luo gene cluster) as well as few LDHs orthologs and the enzymes involved in dissimilatory sulfate reduction were identified with high confidence in these samples (Table 1). Notably, the PFOR (DVU_3025), the Apr subunit A (DVU_0847) and sat (DVU_1295) are ones of the most abundant proteins (Supplementary File 2). Interestingly, among the four hydrogenases identified in these samples, the periplasmic HysAB was the most abundant while the FeFe-hydrogenase (Hyd) and the NiFe-hydrogenase isoform-2 (Hyn-A2) could not be identified in the three different replicates (Supplementary Table 1). These results differed from previous proteomic study, where the periplasmic NiFe-hydrogenase isoform-1 (Hyn-A1) was found to be the most abundant hydrogenase, while Hys was not even detected (Zhang et al., 2006). Such discrepancy might result from variation in the expression level of the different hydrogenases depending on metals availability in the growth medium. Indeed, it was shown that the Hys hydrogenase is dominant when nickel and selenium are available (Valente et al., 2006). Hence, this result does not particularly reflect a specialized role for the periplasmic Hys hydrogenase under these conditions. Instead, it greatly illustrated the high versatility of DvH energy metabolism in terms of proteins composition and nutrients availability that allows the bacterium to adapt to changing environments. The presence of two cytosolic membrane-associated and two periplasmic hydrogenases in these samples pointed toward energy conservation mechanism through hydrogen-cycling under sulfate respiration (Keller and Wall, 2011; Smith et al., 2019).
Besides, the iDvu71 model was used to assess the impact of sulfate presence on hydrogen metabolism and DvH physiology. In the absence of sulfate, electrons resulting from lactate oxidation led to hydrogen production (Voordouw, 1995; Noguera et al., 1998). However, in the presence of sulfate, a portion of the produced hydrogen is consumed by HysAB that provides two electrons per molecule of hydrogen for sulfate respiration (Pohorelic, 2001). As sulfate consumption increases, the demand for electrons also increases, resulting in a decrease of excreted hydrogen. Interestingly, when the sulfate/lactate flux ratio reaches 0.45, all produced hydrogen is used for sulfate respiration, and no more hydrogen is excreted by DvH. This mechanism was reinforced by the experimental data, since transient hydrogen in the gas phase was also detected throughout growth (Figure 2). The above observations could be explained by the role of sulfate respiration in ATP production. For each mmole of sulfate consumed by DvH, 2 mmoles of ATP are produced through a process involving the creation of a proton gradient (Pohorelic, 2001). The presence of sulfate triggers an increase in ATP production, leading to a rewiring of carbon fluxes toward gluconeogenesis and consequently to an increase in biomass synthesis which was previously determined (Noguera et al., 1998). In the absence of sulfate in the medium, the synthesis and excretion of succinate was also simulated by iDvu71. This is in agreement with previous data showing succinate excretion by DvH when fumarate was used as the sole source of carbon and electrons in the absence of sulfate. Under this growth condition, succinate acted as the final electron acceptor (Zaunmüller et al., 2006).
Interestingly, the enzymes involved in formate metabolism as PFLs and FDHs isoforms were also unambiguously identified in these samples by proteomic analysis (Table 1). However, in this case, no transient formate was detected by HPLC in the cell culture supernatant. The fact that extracellular formate is not detected under lactate/sulfate growth does not mean that the pathway is not functional. Instead, the absence of formate in the cell supernatant could be explained by the fact that the concentration of excreted formate is below the HPLC detection limit. Furthermore, in light of the formate-cycling model, formate could be further metabolized at significant rate immediately after being produced. This is in line with a study from Da Silva et al. (2013) reporting that traces of formate were transiently detected during lactate/sulfate growth based on enzymatic measurements. Hence, iDvu71 was also used to give clues toward the existence of formate-cycling in the cell under sulfate respiration. Through unconstrained computational simulations, it was observed that the pathway incorporating the ferredoxin-oxidoreductase reaction is exclusively utilized (Vita et al., 2015). This contrasted with previous mutagenesis studies showing that DvH growth is impaired by the inactivation of FDHs (Da Silva et al., 2013). To challenge the role of formate metabolism by constraining iDvu71 to use PFLs here we showed that DvH can use indifferently PFOR or PFLs for the conversion of pyruvate into acetyl-coA with no impact on the biomass growth rate. However, the hydrogen production was affected by the replacement of PFOR activity toward PFLs activities. This could be explained by the fact that both pathways operate concurrently with electrons being transferred from hydrogen synthesis toward formate synthesis. Moreover, in sulfate-consuming conditions, formate is oxidized to carbon dioxide, releasing electrons that are then employed in sulfate respiration via cytochromes. Ultimately, further studies will be required to experimentally capture formate synthesis in DvH during anaerobic sulfate respiration. Nevertheless, all these simulations provided further evidence for possible formate cycling in DvH. Furthermore, while different electron donor pathways do not influence DvH growth rate under lactate/sulfate respiration, it plays a key role determining the hydrogen/formate balance in the environment in the absence of sulfate. Indeed, hydrogen and formate are considered to be the primary shuttle compounds for interspecies electron transfer in anaerobic syntrophic consortia (McInerney et al., 2008; Stams and Plugge, 2009; Schink and Stams, 2013). Interestingly, syntrophic consortia can be mediated by the exclusive use of hydrogen as an electron donnor (Thiele and Zeikus, 1988; Müller et al., 2010; Teng et al., 2019), or by a combination of formate/hydrogen electron carriers (Stams and Plugge, 2009; Sieber et al., 2014; Krumholz et al., 2015). Hence, by controlling the hydrogen/formate balance in the environment, DvH might be a key determinant influencing the composition of the ecosystem.
Strikingly, six Adhs, one Aor, and all the subunits forming the Hdr-Flx complex were also identified with high confidence by proteomic analysis, with Adh1 being one of the most abundant protein in these samples (Table 1). These results suggest that ethanol might act as metabolic intermediates under these conditions as previously reported (Haveman et al., 2003). Indeed, it was proposed that ethanol could serve as alternative reducing equivalents for sulfate reduction (Haveman et al., 2003; Ramos et al., 2015), through alternative energy conserving (flavin-based electron bifurcation) process involving the Hdr-Flx complex (Ramos et al., 2015). The exact mechanism of ethanol metabolism remains unclear as of today, nevertheless several scenarios were previously proposed depending on nutrients availability. Under sulfate respiration using various electron donors, ethanol is oxidized by an Adh, most likely Adh1, coupled to the reduction of NAD+ to NADH. The two electrons generated from NADH reoxidation by the Flx complex are then transferred through the Hdr complex to the ferredoxin pool and an unknow electron acceptor (Pereira et al., 2008; Ramos et al., 2015). It was recently proposed that DsrC might serve as electron acceptor, thus providing electrons required for sulfate reduction, while reduced ferredoxin will serve as donor for hydrogen production by membrane-associated hydrogenases (Ech or Coo) for hydrogenase production and the generation of protons gradient (Ferreira et al., 2023). Alternatively, during fermentation, the complex might work in reverse thus dissipating the excess of reducing equivalents toward ethanol production with NADH. The NAD+ produced is recycled by Flx complex with electrons coming from reduced ferredoxin and DsrC through Hdr complex (Ramos et al., 2015; Ferreira et al., 2023). Interestingly, according to the present study no intracellular flux for ethanol pathway was simulated using the iDvu71 model. This result suggested that the absence of ethanol as intermediate metabolite must not prevent growth nor impact hydrogen and formate production in DvH under sulfate respiration.
To conclude, coupling fluxomic and proteomic analysis, the present study provided a comprehensive understanding of DvH primary metabolism intracellular fluxes. The contribution of different energy conservation mechanisms involving the cycling of intermediates on growth and hydrogen production was evaluated depending on the presence of sulfate as electron acceptor. Altogether, this study emphasized that the flexibility of DvH metabolic capabilities most likely lies in environmental conditions which determine enzymes composition in DvH, rather than bioenergetic advantages. Besides, this study also highlighted the importance of coupling fluxomic to experimental data to simulate accurate intracellular fluxes. Moreover, besides enabling DvH to grow and persist in various ecosystems, this breadth of metabolic capability most likely confers to DvH a central role in shaping microbiome composition and function. Developing models relevant in a variety of environmental conditions remains challenging. Most of the times, environmental changes require adjustments in the metabolic network to obtain accurate simulations. Comparison of iDvu71 results with those obtained with previously developed metabolic models of DvH illustrated this difficulty. To date, iDvu71 was only used to simulate the metabolic behavior of DvH with constrained lactate and sulfate consumption fluxes. However, this model will be part of a metabolic model for an artificial community composed of C. acetobutylicum and DvH. An overproduction of hydrogen was determined in this consortium compared to a C. acetobutylicum pure culture (Benomar et al., 2015; Barca et al., 2016). This community metabolic model, including iDvu71, should provide insights regarding the metabolite exchanges between these two bacteria which could be the basis of this overproduction.
Data availability statement
The data presented in the study are deposited in the ProteomeXchange Consortium via the PRIDE partner repository (http://www.ebi.ac.uk/pride) with the ProteomeXchange, accession PXD046638.
Author contributions
XM: Writing – original draft, Conceptualization, Data curation, Formal Analysis, Investigation, Methodology, Software, Validation, Visualization. MR: Conceptualization, Data curation, Formal Analysis, Investigation, Methodology, Validation, Visualization, Writing – original draft, Writing – review and editing, Supervision. FF: Conceptualization, Formal Analysis, Methodology, Software, Supervision, Writing – review and editing. PI: Conceptualization, Data curation, Formal Analysis, Investigation, Methodology, Writing – review and editing, Validation. EG: Conceptualization, Investigation, Supervision, Writing – review and editing. LD: Data curation, Formal Analysis, Investigation, Methodology, Writing – review and editing. RL: Data curation, Formal Analysis, Investigation, Methodology, Resources, Validation, Writing – review and editing. M-TG-O: Conceptualization, Funding acquisition, Project administration, Supervision, Validation, Writing – review and editing, Data curation, Formal Analysis. SD: Conceptualization, Data curation, Formal Analysis, Funding acquisition, Investigation, Methodology, Supervision, Visualization, Writing – review and editing.
Acknowledgments
We thank Audrey Soric (ENSCR, Rennes, France), Mathieu Luglia (UMR7340, Ecole Centrale, Marseille, France), Ievgen Mazurenko (UMR7281, CNRS, Marseille, France), Eric Olmos (LRGP, UMR7274, CNRS, Nancy), Marianne Guiral (UMR7281, CNRS, Marseille, France), and Marielle Bauzan (IMM, CNRS, Marseille, France) for helpful discussions. The “Plateforme Protéomique” at IMM is a part of the network “Marseille Protéomique,” IBiSA- and Aix-Marseille Université labeled.
Funding Statement
The author(s) declare financial support was received for the research, authorship, and/or publication of this article. This work was supported by National Research Agency (ANR, France) under the grant ANR-19-CE05-0017 and also received support from the French government under the France 2030 investment plan, as part of the Excellence Initiative of Aix-Marseille University—A*MIDEX. MR and LD are grateful to the Institute of Microbiology, Bioenergies, and Biotechnologies (IM2B, AMX-19-IET-006) for funding support (AO-IM2B-NE-2023-08-ROGER and AO-IM2B-CD-2021- DELECOURT).
Conflict of interest
The authors declare that the research was conducted in the absence of any commercial or financial relationships that could be construed as a potential conflict of interest.
Publisher’s note
All claims expressed in this article are solely those of the authors and do not necessarily represent those of their affiliated organizations, or those of the publisher, the editors and the reviewers. Any product that may be evaluated in this article, or claim that may be made by its manufacturer, is not guaranteed or endorsed by the publisher.
Supplementary material
The Supplementary Material for this article can be found online at: https://www.frontiersin.org/articles/10.3389/fmicb.2024.1336360/full#supplementary-material
References
- Appel A., Willistein M., Dahl C., Ermler U., Boll M. (2021). Functionnal diversity of prokaryotic HdrA(BC) modules: role in flavin-based electron bifurcation processes and beyond. BBA Bioernegetics 1862:148379. 10.1016/j.bbabio.2021.148379 [DOI] [PubMed] [Google Scholar]
- Baffert C., Kpebe A., Avilan L., Brugna M. (2019). Hydrogenases and H2 metabolism in sulfate-reducing bacteria of the Desulfovibrio genus. Adv. Microbial Physiol. 17 143–189. 10.1016/bs.ampbs.2019.03.001 [DOI] [PubMed] [Google Scholar]
- Barca C., Ranava D., Bauzan M., Ferrasse J.-H., Giudici-Orticoni M.-T., Soric A. (2016). Fermentative hydrogen production in an up-flow anaerobic biofilm reactor inoculated with a co-culture of Clostridium acetobutylicum and Desulfovibrio vulgaris. Bioresour. Technol. 221 526–533. 10.1016/j.biortech.2016.09.072 [DOI] [PubMed] [Google Scholar]
- Benomar S., Ranava D., Cárdenas M. L., Trably E., Rafrafi Y., Ducret A., et al. (2015). Nutritional stress induces exchange of cell material and energetic coupling between bacterial species. Nat. Commun. 6:6283. 10.1038/ncomms7283 [DOI] [PubMed] [Google Scholar]
- Bryant M. P., Campbell L. L., Reddy C. A., Crabill M. R. (1977). Growth of Desulfovibrio in lactate or ethanol media low in sulfate in association with H2 - utilizing Methanogenic Bacteria. Environ. Microbiol. 33 1162–1169. 10.1128/aem.33.5.1162-1169.1977 [DOI] [PMC free article] [PubMed] [Google Scholar]
- Carbonero F., Benefiel A. C., Alizadeh-Ghamsari A. H., Gaskins H. R. (2012). Microbial pathways in colonic sulfur metabolism and links with health and disease. Front. Physiol. 3:448. 10.3389/fphys.2012.00448 [DOI] [PMC free article] [PubMed] [Google Scholar]
- Da Silva S. M., Voordouw J., Leitão C., Martins M., Voordouw G., Pereira A. C. (2013). Function of formate dehydrogenases in Desulfovibrio vulgaris Hildenborough energy metabolism. Microbiology 159 1760–1769. 10.1099/mic.0.067868-0 [DOI] [PubMed] [Google Scholar]
- Deutsch E. W., Bandeira N., Perez-Riverol Y., Sharma V., Carver J. J., Mendoza L., et al. (2023). The ProteomeXchange consortium at 10 years: 2023 update. Nucleic Acids Res. 51 D1539–D1548. 10.1093/nar/gkac1040 [DOI] [PMC free article] [PubMed] [Google Scholar]
- Dong J. M., Taylor J. S., Latour D. J., Iuchi S., Lin E. C. (1993). Three overlapping lct genes involved in L-lactate utilization by Escherichia coli. J. Bacteriol. 175 6671–6678. 10.1128/jb.175.20.6671-6678.1993 [DOI] [PMC free article] [PubMed] [Google Scholar]
- Enning D., Garrelfs J. (2014). Corrosion of iron by sulfate-reducing bacteria: new views of an old problem. Environ. Microbiol. 80 1226–1236. 10.1128/AEM.02848-13 [DOI] [PMC free article] [PubMed] [Google Scholar]
- Ferreira D., Venceslau S. S., Bernardino R., Preto A., Zhang L., Waldbauer J. R., et al. (2023). DsrC is involved in fermentative growth and interacts directly with the FlxABCD–HdrABC complex in Desulfovibrio vulgaris Hildenborough. Environ. Microbiol. 25 962–976. 10.1111/1462-2920.16335 [DOI] [PubMed] [Google Scholar]
- Flowers J. J., Richards M. A., Baliga N., Meyer B., Stahl D. A. (2018). Constraint-based modelling captures the metabolic versatility of Desulfovibrio vulgaris: metabolic versatility of Desulfovibrio. Environ. Microbiol. Rep. 10 190–201. 10.1111/1758-2229.12619 [DOI] [PubMed] [Google Scholar]
- Ganter M., Bernard T., Moretti S., Stelling J., Pagni M. (2013). MetaNetX.org: a website and repository for accessing, analysing and manipulating metabolic networks. Bioinformatics 29 815–816. [DOI] [PMC free article] [PubMed] [Google Scholar]
- Guiral M., Tron P., Aubert C., Gloter A., Iobbi-Nivol C., Giudici-Orticoni M.-T. (2005). A membrane-bound multienzyme, hydrogen-oxidizing, and sulfur-reducing complex from the Hyperthermophilic bacterium Aquifex aeolicus. J. Biol. Chem. 280 42004–42015. 10.1074/jbc.M508034200 [DOI] [PubMed] [Google Scholar]
- Hao T., Xiang P., Mackey H. R., Chi K., Lu H., Chui H., et al. (2014). A review of biological sulfate conversions in wastewater treatment. Water Res. 65 1–21. [DOI] [PubMed] [Google Scholar]
- Haveman S. A., Brunelle V., Voordouw J. K., Voordouw G., Heidelberg J. F., Rabus R. (2003). Gene expression analysis of energy metabolism mutants of Desulfovibrio vulgaris Hildenborough indicates an important role for alcohol Dehydrogenase. J. Bacteriol. 185 4345–4353. 10.1128/JB.185.15.4345-4353.2003 [DOI] [PMC free article] [PubMed] [Google Scholar]
- Heavner B. D., Price N. D. (2015). Transparency in metabolic network reconstruction enables scalable biological discovery. Curr. Opin. Biotechnol. 34 105–109. 10.1016/j.copbio.2014.12.010 [DOI] [PMC free article] [PubMed] [Google Scholar]
- Heidelberg J. F., Seshadri R., Haveman S. A., Hemme C. L., Paulsen I. T., Kolonay J. F., et al. (2004). The genome sequence of the anaerobic, sulfate-reducing bacterium Desulfovibrio vulgaris Hildenborough. Nat. Biotechnol. 22 554–559. 10.1038/nbt959 [DOI] [PubMed] [Google Scholar]
- Heirendt L., Arreckx S., Pfau T., Mendoza S. N., Richelle A., Heinken A., et al. (2019). Creation and analysis of biochemical constraint-based models using the COBRA Toolbox v.3.0. Nat. Protoc. 14 639–702. 10.1038/s41596-018-0098-2 [DOI] [PMC free article] [PubMed] [Google Scholar]
- Kanehisa M. (2000). KEGG: kyoto encyclopedia of genes and genomes. Nucleic Acids Res. 28 27–30. [DOI] [PMC free article] [PubMed] [Google Scholar]
- Kazakov A. E., Rajeev L., Chen A., Luning E. G., Dubchak I., Mukhopadhyay A., et al. (2015). σ54-dependent regulome in Desulfovibrio vulgaris Hildenborough. BMC Genomics 16:919. 10.1186/s12864-015-2176-y [DOI] [PMC free article] [PubMed] [Google Scholar]
- Keller K. L., Wall J. D. (2011). Genetics and molecular biology of the electron flow for sulfate respiration in Desulfovibrio. Front. Microbiol. 2:135. 10.3389/fmicb.2011.00135 [DOI] [PMC free article] [PubMed] [Google Scholar]
- King Z. A., Lu J., Dräger A., Miller P., Federowicz S., Lerman J. A. (2016). BiGG models: a platform for integrating, standardizing and sharing genome-scale models. Nucleic Acids Res. 44 D515–D522. 10.1093/nar/gkv1049 [DOI] [PMC free article] [PubMed] [Google Scholar]
- Kpebe A., Guendon C., Payne N., Ros J., Khelil Berbar M., Lebrun R., et al. (2023). An essential role of the reversible electron-bifurcating hydrogenase Hnd for ethanol oxidation in Solidesulfovibrio fructosivorans. Front. Microbiol. 14:1139276. 10.3389/fmicb.2023.1139276 [DOI] [PMC free article] [PubMed] [Google Scholar]
- Krumholz L. R., Bradstock P., Sheik C. S., Diao Y., Gazioglu O., Gorby Y., et al. (2015). Syntrophic growth of Desulfovibrio alaskensis requires genes for H 2 and formate metabolism as well as those for flagellum and biofilm formation. Environ. Microbiol. 81 2339–2348. 10.1128/AEM.03358-14 [DOI] [PMC free article] [PubMed] [Google Scholar]
- Malone Rubright S. L., Pearce L. L., Peterson J. (2017). Environmental toxicology of hydrogen sulfide. Nitric Oxide 71 1–13. [DOI] [PMC free article] [PubMed] [Google Scholar]
- McInerney M. J., Bryant M. P., Pfennig N. (1979). Anaerobic bacterium that degrades fatty acids in syntrophic association with methanogens. Arch. Microbiol. 122 129–135. [DOI] [PubMed] [Google Scholar]
- McInerney M. J., Struchtemeyer C. G., Sieber J., Mouttaki H., Stams A. J. M., Schink B., et al. (2008). Physiology, ecology, phylogeny, and genomics of microorganisms capable of syntrophic metabolism. Ann. N. Y. Acad. Sci. 1125 58–72. 10.1196/annals.1419.005 [DOI] [PubMed] [Google Scholar]
- Meyer B., Kuehl J. V., Price M. N., Ray J., Deutschbauer A. M., Arkin A. P., et al. (2014). The energy-conserving electron transfer system used by desulfovibrio alaskensis strain G20 during pyruvate fermentation involves reduction of endogenously formed fumarate and cytoplasmic and membrane-bound complexes, Hdr-Flox and Rnf. Environ. Microbiol. 16 3463–3486. 10.1111/1462-2920.12405 [DOI] [PubMed] [Google Scholar]
- Müller N., Worm P., Schink B., Stams A. J. M., Plugge C. M. (2010). Syntrophic butyrate and propionate oxidation processes: from genomes to reaction mechanisms. Environ. Microbiol. Rep. 2 489–499. 10.1111/j.1758-2229.2010.00147.x [DOI] [PubMed] [Google Scholar]
- Muyzer G., Stams A. J. M. (2008). The ecology and biotechnology of sulphate-reducing bacteria. Nat. Rev. Microbiol. 6 441–454. [DOI] [PubMed] [Google Scholar]
- Noguera D. R., Brusseau G. A., Rittmann B. E., Stahl D. A. (1998). A unified model describing the role of hydrogen in the growth of Desulfovibrio vulgaris under different environmental conditions. Biotechnol. Bioeng. 59 732–746. 10.1002/(sici)1097-0290(19980920)59:6<732::aid-bit10>3.0.co;2-7 [DOI] [PubMed] [Google Scholar]
- Nriagu J. O. (1985). Sulfur: its significance for chemistry, for geo-, bio- and cosmosphere and technology (vol. 5 of studies in inorganic chemistry). Sci. Total Environ. 44:185. [Google Scholar]
- Ogata H., Lubitz W. (2021). “Bioenergetics theory and components | hydrogenases structure and function,” in Encyclopedia Biological Chemistry III, ed. Jez J.. (Amsterdam: Elsevier; ). [Google Scholar]
- Payne N., Kpebe A., Guendon C., Baffert C., Ros J., Lebrun R., et al. (2022). The electronbifurcating FeFe-hydrogenase Hnd is involved in ethanol metabolism in Desulfovibrio fructosovorans grown on pyruvate. Mol. Microbiol. 117 907–920. [DOI] [PubMed] [Google Scholar]
- Pereira P. M., He Q., Valente F. M. A., Xavier A. V., Zhou J., Pereira I. A. C. (2008). Energy metabolism in Desulfovibrio vulgaris Hildenborough: insights from transcriptome analysis. Antonie van Leeuwenhoek 93 347–362. 10.1007/s10482-007-9212-0 [DOI] [PubMed] [Google Scholar]
- Perez-Riverol Y., Bai J., Bandla C., García-Seisdedos D., Hewapathirana S., Kamatchinathan S., et al. (2022). The PRIDE database resources in 2022: a hub for mass spectrometry-based proteomics evidences. Nucleic Acids Res. 50 D543–D552. 10.1093/nar/gkab1038 [DOI] [PMC free article] [PubMed] [Google Scholar]
- Pohorelic B. K. J. (2001). Hydrogen Metabolism of the Sulfate-Reducing Bacterium Desulfovibrio vulgaris. 10.11575/PRISM/22319 27661965 [DOI] [Google Scholar]
- Prioretti L., D’Ermo G., Infossi P., Kpebe A., Lebrun R., Bauzan M., et al. (2023). Carbon fixation in the chemolithoautotrophic bacterium aquifex aeolicus involves two low-potential ferredoxins as partners of the PFOR and OGOR enzymes. Life 13:627. 10.3390/life13030627 [DOI] [PMC free article] [PubMed] [Google Scholar]
- Qian Z., Tianwei H., Mackey H. R., Van Loosdrecht M. C. M., Guanghao C. (2019). Recent advances in dissimilatory sulfate reduction: from metabolic study to application. Water Res. 150 162–181. [DOI] [PubMed] [Google Scholar]
- Rabus R., Venceslau S. S., Wöhlbrand L., Voordouw G., Wall J. D., Pereira I. A. C. (2015). A post-genomic view of the ecophysiology, catabolism and biotechnological relevance of sulphate-reducing prokaryotes. Adv. Microb. Physiol. 66 55–321. 10.1016/bs.ampbs.2015.05.002 [DOI] [PubMed] [Google Scholar]
- Ramos A. R., Grein F., Oliveira G. P., Venceslau S. S., Keller K. L., Wall J. D., et al. (2015). The FlxABCD - HdrABC proteins correspond to a novel NADH dehydrogenase/heterodisulfide reductase widespread in anaerobic bacteria and involved in ethanol metabolism in Desulfovibrio vulgaris H ildenborough. Environ. Microbiol. 17 2288–2305. 10.1111/1462-2920.12689 [DOI] [PubMed] [Google Scholar]
- Schink B., Stams A. J. M. (2013). “Syntrophism among prokaryotes,” in The Prokaryotes, eds Rosenberg E., DeLong E. F., Lory S., Stackebrandt E., Thompson F. (Berlin: Springer; ). [Google Scholar]
- Sieber J. R., Le H. M., McInerney M. J. (2014). The importance of hydrogen and formate transfer for syntrophic fatty, aromatic and alicyclic metabolism. Environ. Microbiol. 16 177–188. 10.1111/1462-2920.12269 [DOI] [PubMed] [Google Scholar]
- Sim M. S., Paris G., Adkins J. F., Orphan V. J., Sessions A. L. (2017). Quantification and isotopic analysis of intracellular sulfur metabolites in the dissimilatory sulfate reduction pathway. Geochim. Cosmochimica Acta 206 57–72. [Google Scholar]
- Sim M. S., Wang D. T., Zane G. M., Wall J. D., Bosak T., Ono S. (2013). Fractionation of sulfur isotopes by Desulfovibrio vulgaris mutants lacking hydrogenases or type I tetraheme cytochrome c3. Front. Microbiol. 4:171. [DOI] [PMC free article] [PubMed] [Google Scholar]
- Smith N. W., Shorten P. R., Altermann E., Roy N. C., McNabb W. C. (2019). A mathematical model for the hydrogenotrophic metabolism of sulphate-reducing bacteria. Front. Microbiol. 10:1652. 10.3389/fmicb.2019.01652 [DOI] [PMC free article] [PubMed] [Google Scholar]
- Stams A. J. M., Plugge C. M. (2009). Electron transfer in syntrophic communities of anaerobic bacteria and archaea. Nat. Rev. Microbiol. 7 568–577. [DOI] [PubMed] [Google Scholar]
- Starkey R. L. (1948). Characteristics and cultivation of sulfate-reducing bacteria. J. AWWA 40 1291–1298. [Google Scholar]
- Stolyar S., Van Dien S., Hillesland K. L., Pinel N., Lie T. J., Leigh J. A., et al. (2007). Metabolic modeling of a mutualistic microbial community. Mol. Syst. Biol. 3:92. [DOI] [PMC free article] [PubMed] [Google Scholar]
- Tang W., Hao T., Chen G. (2021). Comparative metabolic modeling of multiple sulfate-reducing prokaryotes reveals versatile energy conservation mechanisms. Biotech. Bioeng. 118 2676–2693. 10.1002/bit.27787 [DOI] [PubMed] [Google Scholar]
- Tang Y., Pingitore F., Mukhopadhyay A., Phan R., Hazen T. C., Keasling J. D. (2007). Pathway confirmation and flux analysis of central metabolic pathways in Desulfovibrio vulgaris Hildenborough using gas chromatography-mass spectrometry and fourier transform-ion cyclotron resonance mass spectrometry. J. Bacteriol. 189 940–949. 10.1128/JB.00948-06 [DOI] [PMC free article] [PubMed] [Google Scholar]
- Tao Y., Chen Y., Wu Y., He Y., Zhou Z. (2007). High hydrogen yield from a two-step process of dark- and photo-fermentation of sucrose. Int. J. Hydrogen Energy 32 200–206. [Google Scholar]
- Teng Y., Xu Y., Wang X., Christie P. (2019). Function of biohydrogen metabolism and related microbial communities in environmental bioremediation. Front. Microbiol. 10:106. 10.3389/fmicb.2019.00106 [DOI] [PMC free article] [PubMed] [Google Scholar]
- Thiele J. H., Zeikus J. G. (1988). Control of interspecies electron flow during anaerobic digestion: significance of formate transfer versus hydrogen transfer during syntrophic methanogenesis in Flocs. Environ. Microbiol. 54 20–29. 10.1128/aem.54.1.20-29.1988 [DOI] [PMC free article] [PubMed] [Google Scholar]
- Traore A. S., Fardeau M.-L., Hatchikian C. E., Le Gall J., Belaich J.-P. (1983). Energetics of growth of a defined mixed culture of Desulfovibrio vulgaris and Methanosarcina barkeri: interspecies hydrogen transfer in batch and continuous cultures. Appl. Environ. Microbiol. 46 1152–1156. 10.1128/aem.46.5.1152-1156.1983 [DOI] [PMC free article] [PubMed] [Google Scholar]
- Valente F. M. A., Almeida C. C., Pacheco I., Carita J., Saraiva L. M., Pereira I. A. C. (2006). Selenium is involved in regulation of periplasmic hydrogenase gene expression in Desulfovibrio vulgaris Hildenborough. J. Bacteriol. 188 3228–3235. 10.1128/JB.188.9.3228-3235.2006 [DOI] [PMC free article] [PubMed] [Google Scholar]
- Venceslau S. S., Lino R. R., Pereira I. A. C. (2010). The Qrc membrane complex, related to the alternative complex III, is a menaquinone reductase involved in sulfate respiration. J. Biol. Chem. 285 22774–22783. 10.1074/jbc.M110.124305 [DOI] [PMC free article] [PubMed] [Google Scholar]
- Vita N., Valette O., Brasseur G., Lignon S., Denis Y., Ansaldi M., et al. (2015). The primary pathway for lactate oxidation in Desulfovibrio vulgaris. Front. Microbiol. 6:606. 10.3389/fmicb.2015.00606 [DOI] [PMC free article] [PubMed] [Google Scholar]
- Voordouw G. (1995). The genus desulfovibrio: the centennial. Environ. Microbiol. 61 2813–2819. [DOI] [PMC free article] [PubMed] [Google Scholar]
- Voordouw G. (2002). Carbon monoxide cycling by Desulfovibrio vulgaris Hildenborough. J. Bacteriol. 184 5903–5911. 10.1128/JB.184.21.5903-5911.2002 [DOI] [PMC free article] [PubMed] [Google Scholar]
- Wall J. D., Arkin A. P., Balci N. C., Rapp-Giles B. (2008). “Genetics and genomics of sulfate respiration in Desulfovibrio,” in Microbial Sulfur Metabolism, eds Dahl C., Friedrich C. G. (Berlin: Springer; ). [Google Scholar]
- Wang D., Hunt K. A., Candry P., Tao X., Wofford N. Q., Zhou J., et al. (2023). Cross-feedings, competition, and positive and negative synergies in a four-species synthetic community for anaerobic degradation of cellulose to Methane. mBio 14 e3189–e3122. 10.1128/mbio.03189-22 [DOI] [PMC free article] [PubMed] [Google Scholar]
- Zaunmüller T., Kelly D. J., Glöckner F. O., Unden G. (2006). Succinate dehydrogenase functioning by a reverse redox loop mechanism and fumarate reductase in sulphate-reducing bacteria. Microbiology 152 2443–2453. 10.1099/mic.0.28849-0 [DOI] [PubMed] [Google Scholar]
- Zhang W., Gritsenko M. A., Moore R. J., Culley D. E., Nie L., Petritis K., et al. (2006). A proteomic view of Desulfovibrio vulgaris metabolism as determined by liquid chromatography coupled with tandem mass spectrometry. Proteomics 6 4286–4299. 10.1002/pmic.200500930 [DOI] [PubMed] [Google Scholar]
- Zhou C., Zhou Y., Rittmann B. E. (2017). Reductive precipitation of sulfate and soluble Fe (III) by Desulfovibrio vulgaris: electron donor regulates intracellular electron flow and nano-FeS crystallization. Water Res. 119 91–101. 10.1016/j.watres.2017.04.044 [DOI] [PubMed] [Google Scholar]
- Zhu L., Gong T., Wood T. L., Yamasaki R., Wood T. K. (2019). σ 54 -Dependent regulator DVU2956 switches Desulfovibrio vulgaris from biofilm formation to planktonic growth and regulates hydrogen sulfide production. Environ. Microbiol. 21 3564–3576. [DOI] [PubMed] [Google Scholar]
- Zomorrodi A. R., Maranas C. D. (2012). OptCom: a multi-level optimization framework for the metabolic modeling and analysis of microbial communities. PLoS Comput. Biol. 8:e1002363. 10.1371/journal.pcbi.1002363 [DOI] [PMC free article] [PubMed] [Google Scholar]
Associated Data
This section collects any data citations, data availability statements, or supplementary materials included in this article.
Supplementary Materials
Data Availability Statement
The data presented in the study are deposited in the ProteomeXchange Consortium via the PRIDE partner repository (http://www.ebi.ac.uk/pride) with the ProteomeXchange, accession PXD046638.