

Abstract
Background:
Alcohol consumption is the most important risk factor responsible for the disease burden of liver cirrhosis (LC). Estimates of risk relationships available usually neither distinguish between different causes such as alcohol-related LC or hepatitis-related LC, nor differentiate between morbidity and mortality as outcome. We aimed to address this research gap and identify dose-response relationships between alcohol consumption and LC, by cause and outcome.
Methods:
A systematic review using PubMed/Medline and Embase was conducted, identifying studies that reported an association between level of alcohol use and LC. Meta-regression models were used to estimate the dose-response relationships and control for heterogeneity.
Results:
44 studies, and one secondary data source, with a total of 5,122,534 participants and 15,150 cases were included. Non-linear dose-response relationships were identified, attenuated for higher levels of consumption. For morbidity, drinking 25 g/day was associated with a RR of 1.81 (95% CI 1.68-1.94) compared to lifetime abstention; 50 g/day and 100 g/day corresponded to 3.54 (95% CI 3.29-3.81) and 8.15 (95% CI 7.46-8.91), respectively. For mortality, for 25 g/day, a RR of 2.65 (95% CI 2.22-3.16); for 50 g/day, a RR of 6.83 (95% CI 5.84-7.97); for 100 g/day a RR of 16.38 (95% CI 13.81-19.42) were identified. A higher risk for alcohol-related and all-cause LC as compared to hepatitis C-related LC was found.
Conclusions:
Our results demonstrated higher acceleration for mortality compared to morbidity. The current findings will inform the way we quantify the burden due to LC attributable to alcohol use.
Keywords: liver cirrhosis, liver disease, alcohol, systematic review, dose-response, meta-analysis, epidemiology, public health, morbidity, mortality
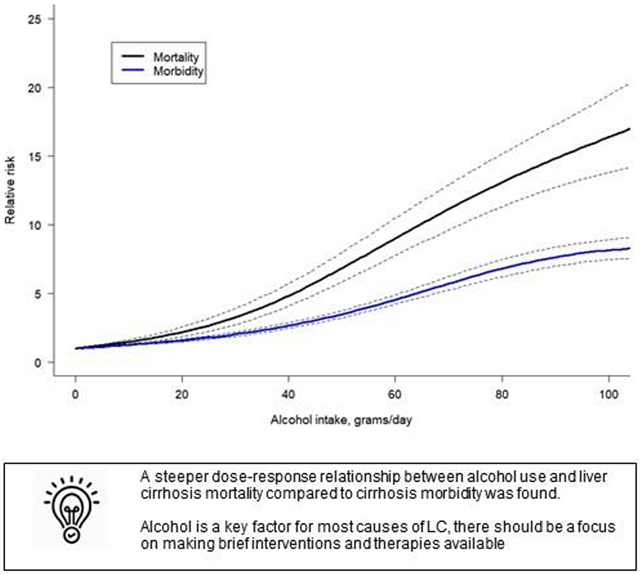
Graphical Abstract
Introduction
The causal impact of alcohol use on diseases of the liver has been known for centuries,1 and has led to a separate category of “alcoholic liver disease” in the International Classification of Disease (ICD) since the 1920s (to avoid stigmatization,2 we will use the term alcohol-related liver cirrhosis). A clear etiology of liver cirrhosis (LC) is not always possible to establish on a clinical level, blurring the lines between the different diagnoses.3 However, it has been shown that alcohol use not only impacts alcohol-related liver disease but also almost all causes,4 such as hepatitis-related LC or non-alcoholic fatty liver disease. The dose-response relationship between alcohol use and LC currently available does not distinguish between the different causes of LC, therefore, our study aimed to explore such differences.
The question of differing dose-response relationships for LC morbidity and mortality has yielded mixed results in the literature to date. Continued alcohol use by those diagnosed with LC leads to further complications and potential death in shorter periods, irrespective of the cause of the incident LC. An earlier meta-analysis found that the risk for LC mortality increased at a much steeper rate than the risk for morbidity,5 which is expected because it usually takes years to develop alcohol-related LC.4 However, a later review did not draw the same conclusion.6 Finally, since the genetic background differs worldwide, investigating regional differences in relative risk may help explain the variability in alcohol-attributable LC burden among individuals who consume the same average amount of alcohol.7,8
Accordingly, our review aimed to distinguish dose-response relationships for different categories of LC based on separate causes (all-cause LC, alcohol-related LC, and hepatitis-related LC) and assess regional differences in the risk relationship. In addition, this review focuses on the separate dose-response relationships between the level of alcohol consumption and LC morbidity, and LC mortality. We hypothesized that the LC mortality curve will be steeper than that for morbidity.
Materials and Methods
Systematic review
We conducted a systematic literature search on the relationship between alcohol consumption and the risk of LC, using PubMed/Medline and Embase from inception to March 8, 2023. We applied the Preferred Reporting Items for Systematic Reviews and Meta-Analyses (PRISMA) criteria (see PRISMA checklist9 in Supplementary Material Table e1). The search was conducted using keywords and MeSH terms relating to alcohol consumption, LC, and observational studies (for search strategy, see Supplementary Material Table e2). In addition, we manually reviewed the reference list of relevant articles. No language restrictions were imposed. The references were screened following a two-step approach of (1) title/abstract and (2) full-text screenings. All references were screened by one author (L.LF.), with independent verification by two additional reviewers (J.R and O.H.), and the full-text screening was conducted by two authors (L.LF. and J.R.). The study protocol was registered with PROSPERO, registration number CRD42022299680.
The inclusion criteria were as follows: case-control or cohort study design; studies reporting the quantity of alcohol use as the exposure variable; the endpoint was LC morbidity (incidence of LC diagnosed by liver biopsy or, in patients unable to undergo biopsy, by clinical and laboratory criteria; or decompensated LC, defined by the occurrence of ascites, variceal bleeding or hepatic encephalopathy10) and LC mortality (ICD-8 and ICD-9 codes 571 and ICD-10 codes K70, K73, K74); studies that reported odds ratios (OR), relative risks (RR), or hazard ratios (HR) and their 95% confidence intervals (CI), or information allowing us to compute them. The cause of LC was classified into three categories: all-cause LC, which accounted for all cases of LC, alcohol-related LC (defined by a medical diagnosis or ICD-10 code K70) and hepatitis C-related LC (defined by a medical diagnosis or ICD-10 code B18). Studies were excluded if: they were not published as full reports, a cross-sectional design was used, or there was not enough information to compute the risk and endpoints.
Data extraction
The following data was extracted by two authors (L.LF. and J.R.): title, first author, year of publication, country, study design, year of study, follow-up years, sample size, sex, age, cause of LC, socioeconomic status, race/ethnicity, alcohol consumption categories, period of alcohol consumption, risk estimates with their corresponding 95% CIs, adjustments, and endpoints. The term RR was used to describe all risk estimates, including OR or HR.
Alcohol consumption data that was not presented as grams per day was converted to this measurement based on the size of a standard drink in the study’s country of origin (as defined by the World Health Organization11). If alcohol consumption was provided in ranges, the midpoint was used. In cases where there was no upper bound for the highest category, the width of the previous category’s range was multiplied by 75%, and the resulting value was added to the lower bound, using this measure as the highest category (for examples of these methodology, see5, 12).
Quality assessment
The Cochrane Risk-of-Bias Tool for Non-Randomized Studies (ROBINS-I)13 was adapted and used to assess risk of bias in primary studies (for details on the adaptation, see Supplementary Material Table e3). We rated the evidence for the association between alcohol consumption and LC based on the Grading of Recommendations Assessment, Development and Evaluation approach.14 Each study was rated by at least two authors and results were discussed in person to reach a consensus on the final ratings.
Secondary data source
We conducted one secondary data analysis using nationally representative data from the United States (US) for inclusion in this review. We used cross-sectional data from the National Health Interview Survey (NHIS), covering the annual survey years from 1997 to 2018, linked to the mortality data from the US National Death Index, with a follow-up until 2019. Analyses were restricted to adult participants aged 25 years and older. After excluding missing values in covariates (which accounted for <5% of the total sample), our final sample size was 562,042 (246,004 men and 316,038 women), which included 1,280 LC deaths (720 men and 560 women). The average follow-up period was 10.7 with a standard deviation of 6.4 years. We used Cox proportional hazard models to calculate point estimates for the risk of LC mortality at various levels of alcohol use, while adjusting for sex, education (high school degree or less, some college education but no degree, and college degree or more), race/ethnicity (non-Hispanic White, non-Hispanic Black, Hispanic, and others), marital status, and survey year. We accounted for the complex survey design through survey weights, stratum, and PSU. Our analyses were stratified by sex.
Statistical analysis
We first separated lifetime abstainers from former drinkers based on a subset of studies and harmonized the reference category of the included studies to ensure that lifetime abstainers served as the reference category. This step is necessary to avoid “sick quitter bias”, i.e., the bias of including people as abstainers who quit drinking later in life for health reasons15 (for the reasoning used in this step, see Supplementary Material Methods e4).
Meta-analysis via multilevel meta-regression using Restricted Maximum Likelihood (REML) random-effects model was conducted to investigate and quantify the dose-response relationship.16 Such a model was suited to handle clustered data. We modelled the intercept to go through zero on the logarithmic scale. Variation in the effect size due to heterogeneity between studies was quantified using both Cochrane Q-test and the I2 statistic. We tested a set of shapes of the dose-response relationship (linear, quadratic, restrictive cubic splines, and cubic polynomials) using all point estimates.17 The best-fitting model was selected based on the Akaike information criterion (AIC) and Bayesian information criterion (BIC) statistics. Next, to investigate heterogeneity in the dose-response relationship, we included the following variables in the model: cause of LC (all-cause LC, alcohol-related LC, and hepatitis C-related LC), region (Asia and all other countries) and endpoint (morbidity and mortality). For each of the variables, potential interaction effects with the dose of alcohol consumption were tested to determine if stratified models had to be calculated. We then fitted stratified dose-response relationships for the variables that showed a statistical significant interaction effect.
We conducted three sensitivity analyses. First, we used a wider definition of liver disease (ICD-10 codes K70-K76) to gauge the generalizability of the dose-response relationship using a broader evidence base. Secondly, to account for changes in the prevention and treatment of LC since the turn of the century, we restricted the analysis to studies that were published after the year 2000. Finally, we restricted the analysis to studies that obtained a low and moderate score in the risk of bias assessment to investigate any differences in the findings when excluding studies with a high risk of bias. Significant differences were identified based on non-overlapping CIs for the resulting risk relationships compared to our main results. All statistical analyses were conducted using meta18 and metafor19 packages in R software version 4.0.5.20
Results
In total, 44 studies fulfilled our inclusion criteria, outlined in Figure 1. The characteristics of all studies included in our analysis, including the secondary data source, are summarized in Supplementary Material Table e5. The studies included 5,122,534 participants and 15,150 cases of LC. Overall, 26 studies were cohort studies and 18 studies were case-control studies. As for the specific cause of LC, six studies reported on alcohol-related LC and 14 studies reported on hepatitis C-related LC. In total, 24 studies (53%) used LC morbidity as the endpoint, 17 studies (38%) used LC mortality as the endpoint and four studies (9%) presented data on LC morbidity and mortality together. Alcohol consumption was measured via self-report in all the studies that were included in our analysis. The majority of studies were conducted in the US (31%), followed by France (20%), Italy (11%), and Australia, China and United Kingdom (7% each). Regarding the risk of bias, 18 studies were rated as having a moderate risk of bias score, 11 studies were rated as seriously biased, and 15 studies were rated as having a critical risk of bias (the poorest assessment). However, it should be noted that a high risk of bias predominantly arose because almost all studies evaluated alcohol use at a single time point and, consequently, alcohol use was not treated as a time-varying factor. When removing this criterion, we obtained 7 studies with a low risk of bias, 12 studies with moderate risk, 10 studies with serious risk, and 15 studies with a critical risk of bias.
Figure 1.
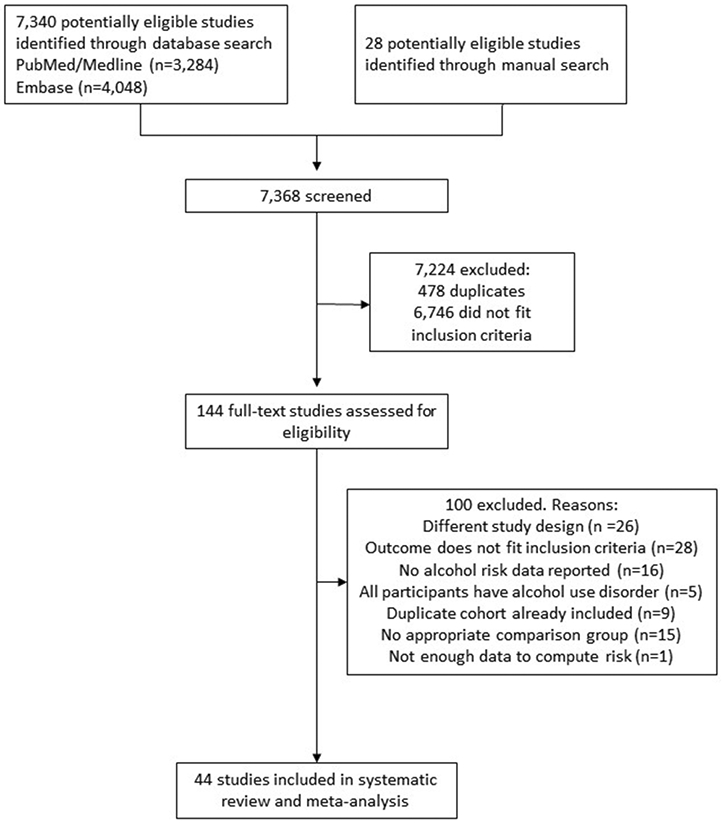
Flowchart of study selection
We identified a non-linear dose-response relationship between alcohol use and all-cause LC. The best-fitting shape was the restrictive cubic spline (for justification, see Supplementary Material File e6). Overall, for both sexes combined, we identified a RR of 1.85 (95% CI 1.73-1.99) of all-cause LC when consuming 25 g/day compared to lifetime abstention, a RR of 4.11 (95% CI 3.86-4.38) for 50 g/day and a RR of 9.49 (95% CI 8.81-10.23) for 100 g/day. In sex-specific analyses, we identified that women experience higher risks at any given level of average alcohol consumption, with a steeper curve compared to men (data not shown, see21).
When comparing cause-specific dose-response relationships, for the same level of alcohol use per day, there was a higher risk for alcohol-related and all-cause LC as compared to hepatitis C-related LC (Figure 2). The dose-response relationship for alcohol-related LC showed an exponential increase with higher doses of alcohol use. For example, drinking 50 g/day was associated with a RR of 6.51 (95% CI 4.94 – 8.57) for alcohol-related LC compared to lifetime abstention, and for hepatitis C-related LC the RR was 3.10 (95% CI 2.84 – 3.39). However, drinking 100 g/day was associated with a RR of 29.08 (95% CI 22.34 – 37.87) for alcohol-related LC compared to lifetime abstention, while for hepatitis C-related LC the RR was 5.80 (95% CI 4.78 – 7.04), showing a higher difference in the risk of LC by the specific cause studied. Statistically significant differences between all-cause LC morbidity and mortality were identified (Figure 3), with a higher acceleration of the curve observed in mortality studies. For all-cause LC morbidity, drinking 25 g/day was associated with a RR of 1.81 (95% CI 1.68-1.94) compared to lifetime abstention, while drinking 50 g/day and 100 g/day was associated with a RR of 3.54 (95% CI 3.29-3.81) and 8.15 (95% CI 7.46-8.91), respectively. For all-cause LC mortality, we found a RR of 2.65 (95% CI 2.22-3.16) compared to lifetime abstention when drinking 25 g/day, and RRs of 6.83 (95% CI 5.84-7.97) and 16.38 (95% CI 13.81-19.42) were identified for a consumption of 50 g/day and 100 g/day, respectively.
Figure 2.
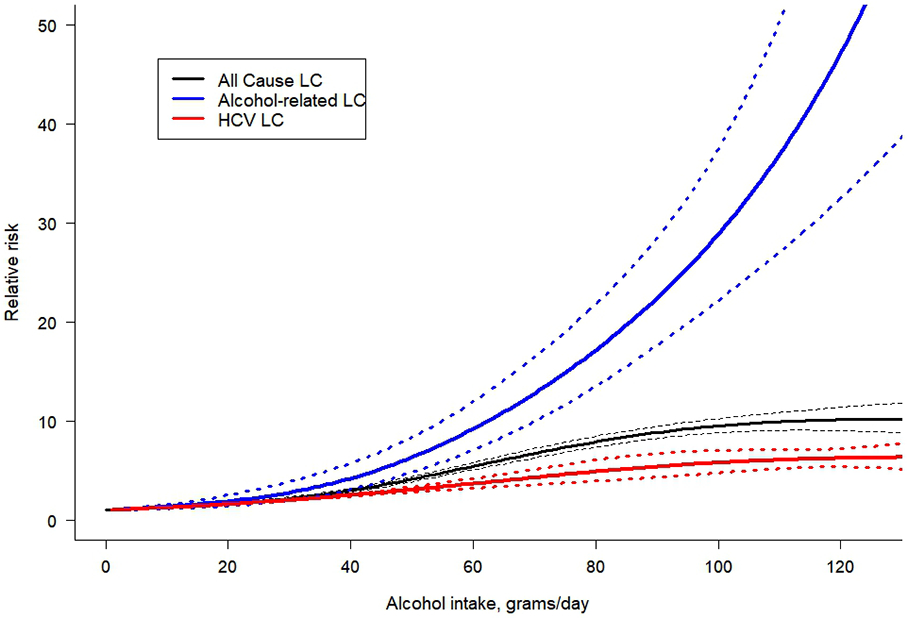
Dose-response meta-analysis between alcohol intake in average grams per day and risk of cirrhosis for both sexes combined, by cause of cirrhosis. LC: liver cirrhosis; HCV: hepatitis C
Figure 3.
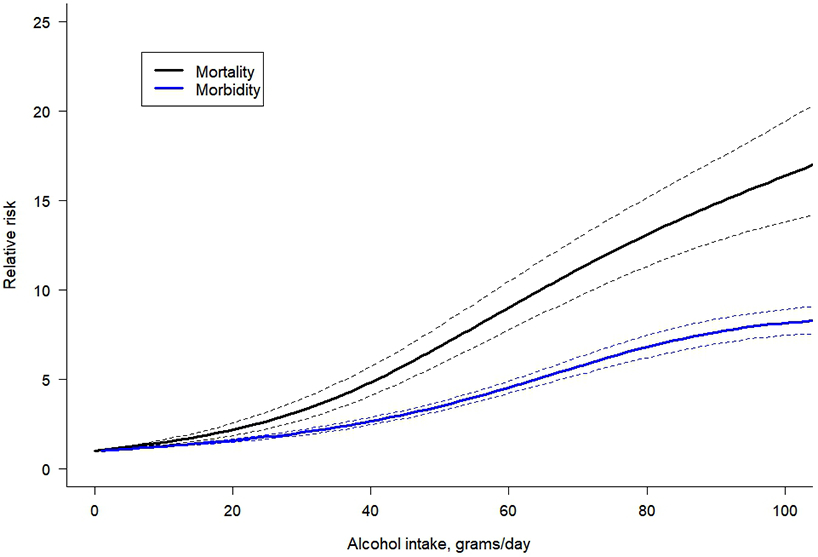
Dose-response meta-analysis between alcohol intake in average grams per day and risk of all-cause cirrhosis for both sexes combined, by endpoint.
As for regional differences, we did not find a statistically significant interaction between alcohol use and region when comparing Asia with other countries (for details, see Supplementary Material File e7). Additionally, we did not identify any study that analyzed the association between alcohol use and the subcategory of alcohol-related LC in Asia, and thus, we were unable to test this interaction. Finally, four studies and our secondary data source adjusted their analyses by race/ethnicity, but there was not enough data to include this variable in our meta-regression. In our first sensitivity analysis, using a wider definition of liver disease, five additional studies were identified in the systematic review (for additional studies included and results, see Supplementary Materials File e8). We found an almost identical dose-response relationship compared to our main results. For our second sensitivity analysis, a total of 21 studies and our secondary data analysis were selected (for studies selected and results, see Supplementary Material File e9). We identified a similar dose-response relationship compared to our main results. Finally, when restricting the analysis to papers with low and moderate risk of bias, the dose-response relationship yielded a slightly lower risk compared with our main results (for details, see Supplementary Material File e10).
Discussion
We found a steeper dose-response relationship between alcohol use and LC mortality compared to LC morbidity, although the curve slightly attenuated at higher levels of daily drinking. Some variation by cause of LC, i.e., a steeper dose-response relationship in alcohol-related LC compared to all-cause LC and hepatitis C-related LC was also found. Notably, the impact of alcohol use on hepatitis C-related LC was the lowest compared to the two other causes. The risk relationship varied by the level of drinking (the higher the consumption, the higher the risk). However, we were not able to identify a statistically significant interaction by region. The most recent meta-analysis on the topic,6 based on nine studies, found an increasing dose-response relationship in women and a possible lower threshold effect in men. However, the authors were not able to include other variables due to the small sample size because they excluded multiple studies that specifically used alcohol-related LC as the outcome. It was based on studies mainly from high-income countries, thus relying on the distribution of LC in these countries. Our review was able to identify a considerably larger number of studies by not excluding any form of LC, which gave us enough power to fit specific dose-response relationships by cause and endpoints. This also led to different findings, such as no protective effect in any of the dose-response relationships was identified.
The mechanisms linking alcohol use with the different causes of LC have been previously studied. Heavy alcohol use can increase viral replication and affect the immune response, which can interact with chronic hepatitis C virus infection.12 Current hepatitis C virus treatment options seem effective in decreasing the risk of LC in the long term,22 and therefore efforts should be made to increase the accessibility and coverage worldwide. Given that the Global Burden of Disease Study estimates the proportion of different causes of LC,23 our results allow us to more precisely predict the risk curves in different regions. It is noteworthy that our analysis took into account regional differences, although we did not identify a significant interaction. However, studying the geographical variation is important due to the genetic differences around the world. Specific genetic polymorphism, modifiers, and variations are predominant in selected regions of the world, such as the aldehyde dehydrogenase 2 (ALDH2) polymorphism, mostly prevalent in East Asian.24 Mutations of this gene cause symptoms of discomfort which could lead to different patterns of drinking, thus, changing the risk relations of different LC.7, 8 Conducting additional studies that examine the impact of race/ethnicity on the relationship between alcohol use and LC could also help address geographical variations.
With regard to limitations, first and most importantly, any meta-analysis is only as good as the underlying research. Although our systematic review did not impose any language restrictions on the search, we were only able to identify studies conducted in Western and Asia-Pacific countries, primarily consisting of high-income countries. Consequently, our findings may not fully account for the potential influence of confounding genetic and nutritional factors in unexamined populations. Unfortunately, even though almost 50% of LC globally is attributable to alcohol use, many aspects of this relationship are under-researched, and measurement of alcohol use in epidemiological studies continues to be poor. Furthermore, alcohol use was measured based on self-report from a single time point in almost all of the studies. These measures are usually subjective and biases cannot be avoided although they are valid overall.25 In addition, our analysis was limited by including case-control studies, for which the temporal sequence of events cannot be determined with certainty. However, we aimed to address this by taking into account the risk of bias rating. As well, in our study, OR, RR, and HR were treated as equivalent measures of the risk estimates and, for rare outcomes, the ORs can be very similar to RR.26 Another limitation was that the cause of LC was often missing or not well categorized, and we found a lack of data regarding some causes of LC (in particular, LC related to metabolic diseases). It is also important to note that potential under-reporting of alcohol-related LC in medical records may occur due to insurance or other social reasons such as stigmatization.27, 28 Due to our selection criteria, the ICD codes used to measure LC varied across studies and we excluded some studies that combined chronic liver disease and LC endpoints. Nevertheless, we found a minimal difference in the dose-response relationship when including articles with a wider definition of liver disease. Unrecorded alcohol, especially illegally produced non-commercial alcohol, and its compounds have been hypothesized as a cause of liver disease and mortality,29 thus introducing bias into the relationship between level of consumption and harm. While some of the compounds of unrecorded alcohol may contribute to liver disease, the overall impact of this form was no longer associated with LC mortality, once heavy episodic drinking occasions had been controlled.30 Finally, we would like to address the population representatively of the samples. While this is not a necessary condition for cohort studies, it may play a role in LC research, since there are many interactions between alcohol and other individual risk factors, and these individual risk factors are unequally distributed between social strata.31 Unfortunately, large cohorts fulfilling the statistical definition of representativeness are almost impossible to obtain, so the entire field of epidemiology struggles with this limitation. The resulting error for LC, though, is expected to be on the conservative side as it underestimates the true relationship, given the usual missing groups.
Despite the limitations noted above, it is clear that alcohol use constitutes an important risk factor for LC (a more significant risk for mortality than morbidity), with a non-linear relationship. Given its significant contribution to risk estimates that increases exponentially over time, alcohol use is an important consideration in the assessment of the risk of liver disease outcomes. Current clinical guidelines focus on distinguishing the primary etiology and identifying the causal factor.10 However, independent of the direct causal factor, assessment and treatment of alcohol use may be a crucial element to be considered in clinical programs, and might be relevant in reducing all LC cases (and not only alcohol-related LC). Based on our findings that alcohol is a key factor for most causes of LC, there should be a focus on making brief interventions and therapies available, that are known to be effective and cost-effective,32 to reduce alcohol consumption or to achieve abstinence. However, the most cost-effective way to reduce the burden of LC on a population level in almost all societies is through the use of alcohol control policies,33 in particular, taxation.34
Supplementary Material
Acknowledgements
We would like to thank Ms. Astrid Otto for referencing and copyediting the text and Mr. Omer S.M. Hasan for his work as an independent reviewer in the systematic review.
Funding
Research reported in this publication was supported by the National Institute on Alcohol Abuse and Alcoholism of the National Institutes of Health under Award Number R01AA028009. JR was additionally supported by NIAAA grant R01AA028224. The content is solely the responsibility of the authors and does not necessarily represent the official views of the National Institutes of Health.
Footnotes
Competing interest
A.L. reported grants from Swiss National Science Foundation (SNSF) during the conduct of the study. All other authors declare no competing interests.
Informed Consent
This article does not contain any studies with human participants or animals performed by any of the authors.
Data transparency statement
The original contribution presented in the study are included in the article and Supplementary Materials. Further inquiries can be directed to the corresponding author.
References
- 1.Rush B An inquiry into the effects of ardent spirits upon the human body and mind: With an account of the means of preventing, and of the remedies for curing them. 8th edition. Reprint ed. Richardson; 1785. [Google Scholar]
- 2.Schomerus G, Leonhard A, Manthey J, et al. The stigma of alcohol-related liver disease and its impact on healthcare. Journal of Hepatology. 2022;77(2):516–524. doi: 10.1016/j.jhep.2022.04.026 [DOI] [PubMed] [Google Scholar]
- 3.Ramrakhiani NS, Le MH, Yeo YH, Le AK, Maeda M, Nguyen MH. Validity of international classification of diseases, tenth revision, codes for cirrhosis. Digestive Diseases. 2021;39(3):243–246. doi: 10.1159/000510981 [DOI] [PMC free article] [PubMed] [Google Scholar]
- 4.Rehm J, Patra J, Brennan A, et al. The role of alcohol use in the aetiology and progression of liver disease: A narrative review and a quantification. Drug and alcohol review. Nov 2021;40(7):1377–1386. doi: 10.1111/dar.13286 [DOI] [PMC free article] [PubMed] [Google Scholar]
- 5.Rehm J, Taylor B, Mohapatra S, et al. Alcohol as a risk factor for liver cirrhosis: a systematic review and meta-analysis. Drug and alcohol review. Jul 2010;29(4):437–45. doi: 10.1111/j.1465-3362.2009.00153.x [DOI] [PubMed] [Google Scholar]
- 6.Roerecke M, Vafaei A, Hasan OSM, et al. Alcohol Consumption and Risk of Liver Cirrhosis: A Systematic Review and Meta-Analysis. Am J Gastroenterol. Oct 2019;114(10):1574–1586. doi: 10.14309/ajg.0000000000000340 [DOI] [PMC free article] [PubMed] [Google Scholar]
- 7.He L, Deng T, Luo H. Aldehyde Dehydrogenase 2 (ALDH2) Polymorphism and the Risk of Alcoholic Liver Cirrhosis among East Asians: A Meta-Analysis. Yonsei Med J. Jul 2016;57(4):879–84. doi: 10.3349/ymj.2016.57.4.879 [DOI] [PMC free article] [PubMed] [Google Scholar]
- 8.Emdin CA, Haas M, Ajmera V, et al. Association of Genetic Variation With Cirrhosis: A Multi-Trait Genome-Wide Association and Gene-Environment Interaction Study. Gastroenterology. Apr 2021;160(5):1620–1633.e13. doi: 10.1053/j.gastro.2020.12.011 [DOI] [PMC free article] [PubMed] [Google Scholar]
- 9.Page MJ, McKenzie JE, Bossuyt PM, et al. The PRISMA 2020 statement: an updated guideline for reporting systematic reviews. BMJ. Mar 29 2021;372:n71. doi: 10.1136/bmj.n71 [DOI] [PMC free article] [PubMed] [Google Scholar]
- 10.Gines P, Krag A, Abraldes JG, Solà E, Fabrellas N, Kamath PS. Liver cirrhosis. The Lancet. 2021;398(10308):1359–1376. doi: 10.1016/S0140-6736(21)01374-X [DOI] [PubMed] [Google Scholar]
- 11.World Health Organization. International guide for monitoring alcohol consumption and related harm. Accessed 10/07/2022), [Google Scholar]
- 12.Llamosas-Falcón L, Shield KD, Gelovany M, et al. Impact of alcohol on the progression of HCV-related liver disease: A systematic review and meta-analysis. Journal of Hepatology. 2021;75(3):536–546. doi: 10.1016/j.jhep.2021.04.018 [DOI] [PubMed] [Google Scholar]
- 13.Sterne JA, Hernán MA, Reeves BC, et al. ROBINS-I: a tool for assessing risk of bias in non-randomised studies of interventions. BMJ. 2016;6(355):i4919. [DOI] [PMC free article] [PubMed] [Google Scholar]
- 14.Balshem H, Helfand M, Schünemann HJ, et al. GRADE guidelines: 3. Rating the quality of evidence. Journal of clinical epidemiology. 2011;64(4):401–406. doi: 10.1016/j.jclinepi.2010.07.015. [DOI] [PubMed] [Google Scholar]
- 15.Shaper AG, Wannamethee G, Walker M. Alcohol and mortality in British men: explaining the U-shaped curve. Lancet (London, England). Dec 3 1988;2(8623):1267–73. doi: 10.1016/s0140-6736(88)92890-5 [DOI] [PubMed] [Google Scholar]
- 16.Corbeil RR, Searle SR. Restricted maximum likelihood (REML) estimation of variance components in the mixed model. Technometrics. 1976;18(1):31–38. [Google Scholar]
- 17.Harrell FE. Recession Modeling Strategies: with applications to linear models, logistic regression, and survival analysis. . New York: Springer-Verlag; 2010. [Google Scholar]
- 18.Harrer M, Cuijpers P, Furukawa TA, Ebert DD. Doing meta-analysis with R: a hands-on guide. Chapman and Hall/CRC; 2021. [Google Scholar]
- 19.Viechtbauer W. Conducting Meta-Analyses in R with the metafor Package. Journal of Statistical Software. 08/May 2010;36(3):1 – 48. doi: 10.18637/jss.v036.i03 [DOI] [Google Scholar]
- 20.R Core Team. A language and environment for statistical computing. R Foundation for Statistical Computing. Version 4.0.5. R Foundation for Statistical Computing,. Accessed 20/04/2022, https://www.R-proiect.org/ [Google Scholar]
- 21.Llamosas-Falcón L, Probst C, Buckley C, et al. Sex-specific association between alcohol consumption and liver cirrhosis: An updated systematic review and meta-analysis. Systematic Review. Frontiers in Gastroenterology. 2022-October-13 2022;1doi: 10.3389/fgstr.2022.1005729 [DOI] [PMC free article] [PubMed] [Google Scholar]
- 22.Pinzani M. Liver Fibrosis in the Post-HCV Era. Seminars in Liver Disease. 2015;35(02):157–165. doi: 10.1055/s-0035-1550056 [DOI] [PubMed] [Google Scholar]
- 23.Institute for Health Metrics and Evaluation (IHME). GBD Results. University of Washington. Accessed 20/06/2022, https://vizhub.healthdata.org/gbd-results/ [Google Scholar]
- 24.Vishnubhotla R, Kulkarni AV, Sharma M, Rao PN, Reddy DN. An update on the genetics of alcoholic liver disease. Mini Review. Frontiers in Gastroenterology. 2022-November-30 2022;1doi: 10.3389/fgstr.2022.1030399 [DOI] [Google Scholar]
- 25.Midanik LT. Validity of self-reported alcohol use: a literature review and assessment. British journal of addiction. 1988;83(9):1019–1029. doi: 10.1111/j.1360-0443.1988.tb00526.x [DOI] [PubMed] [Google Scholar]
- 26.Viera AJ. Odds ratios and risk ratios: what's the difference and why does it matter? Southern medical journal. 2008;101(7):730–734. doi: 10.1097/SMJ.0b013e31817a7ee4 [DOI] [PubMed] [Google Scholar]
- 27.Puffer RR, Griffith GW. Patterns of urban mortality: report of the Inter-American Investigation of Mortality. 1967;Washington, D.C.: Pan American Health Organization. [Google Scholar]
- 28.Rehm J, Hasan OSM, Imtiaz S, Neufeld M. Quantifying the contribution of alcohol to cardiomyopathy: A systematic review. Alcohol. Jun 2017;61:9–15. doi: 10.1016/j.alcohol.2017.01.011 [DOI] [PubMed] [Google Scholar]
- 29.Ostapenko YN, Brusin KM, Zobnin YV, et al. Acute cholestatic liver injury caused by polyhexamethyleneguanidine hydrochloride admixed to ethyl alcohol. Clin Toxicol (Phila). Jul 2011;49(6):471–7. doi: 10.3109/15563650.2011.592837 [DOI] [PubMed] [Google Scholar]
- 30.Lachenmeier DW, Monakhova YB, Rehm J. Influence of unrecorded alcohol consumption on liver cirrhosis mortality. World J Gastroenterol. Jun 21 2014;20(23):7217–22. doi: 10.3748/wjg.v20.i23.7217 [DOI] [PMC free article] [PubMed] [Google Scholar]
- 31.Bellis MA, Hughes K, Nicholls J, Sheron N, Gilmore I, Jones L. The alcohol harm paradox: using a national survey to explore how alcohol may disproportionately impact health in deprived individuals. BMC public health. 2016;16(1):1–10. doi: 10.1186/s12889-016-2766-x [DOI] [PMC free article] [PubMed] [Google Scholar]
- 32.Carvalho AF, Heilig M, Perez A, Probst C, Rehm J. Alcohol use disorders. The Lancet. 2019;394( 10200):781–792. doi: 10.1016/S0140-6736(19)31775-1 [DOI] [PubMed] [Google Scholar]
- 33.Chisholm D, Moro D, Bertram M, et al. Are the “best buys” for alcohol control still valid? An update on the comparative cost-effectiveness of alcohol control strategies at the global level. Journal of Studies on Alcohol and Drugs. 2018;79(4):514–522. [PubMed] [Google Scholar]
- 34.Neufeld M, Rovira P, Ferreira-Borges C, et al. Impact of introducing a minimum alcohol tax share in retail prices on alcohol-attributable mortality in the WHO European Region: A modelling study. The Lancet Regional Health-Europe. 2022;15:100325. doi: 10.1016/j.lanepe.2022.100325 [DOI] [PMC free article] [PubMed] [Google Scholar]
Associated Data
This section collects any data citations, data availability statements, or supplementary materials included in this article.