Abstract
Ectopic activation of rearranged during transfection (RET) has been reported to facilitate lineage differentiation and cell proliferation in different cytogenetic subtypes of acute myeloid leukemia (AML). Herein, we demonstrate that RET is significantly (p < 0.01) upregulated in AML subtypes containing rearrangements of the lysine methyltransferase 2A gene (KMT2A), commonly referred to as KMT2A‐rearranged (KMT2A‐r) AML. Integrating multi‐epigenomics data, we show that the KMT2A‐MLLT3 fusion induces the development of CCCTC‐binding (CTCF)‐guided de novo extrusion enhancer loop to upregulate RET expression in KMT2A‐r AML. Based on the finding that RET expression is tightly correlated with the selective chromatin remodeler and mediator (MED) proteins, we used a small‐molecule inhibitor having dual inhibition against RET and MED12‐associated cyclin‐dependent kinase 8 (CDK8) in KMT2A‐r AML cells. Dual inhibition of RET and CDK8 restricted cell proliferation by producing multimodal oxidative stress responses in treated cells. Our data suggest that epigenetically enhanced RET protects KMT2A‐r AML cells from oxidative stresses, which could be exploited as a potential therapeutic strategy.
Keywords: chromatin looping, epigenetic, KMT2A‐r AML, oxidative‐stress, RET, RET‐inhibitor
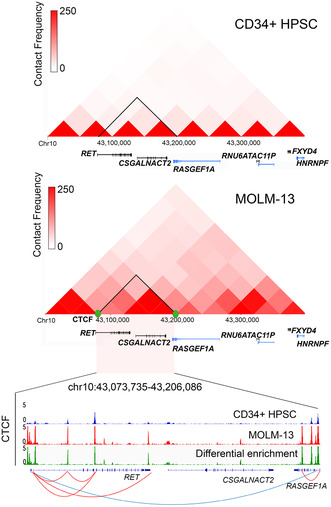
Rearranged during transfection (RET) proto‐oncogene is epigenetically regulated and highly expressed in KMT2A‐rearranged acute myeloid leukemia subtypes. We developed a novel small‐molecule inhibitor that expressed dual inhibition against RET and mediator protein 12 (MED12)‐associated cyclin‐dependent kinase 8 (CDK8). RET inhibition caused oxidative stress and inhibited leukemic cell growth.
1. INTRODUCTION
Rearranged during transfection (RET) is a proto‐oncogene that encodes a receptor tyrosine kinase containing an extracellular domain, a transmembrane domain, and an intracellular tyrosine kinase domain. 1 Canonical RET signaling is contingent upon heterodimerization of RET with glial cell line‐derived neurotrophic factor (GDNF) family receptors (GFRα1‐4) engaged with their cognate ligands, neurturin (NRTN), artemin (ARTN), or persephin (PSPN) [6]. RET signals impact downstream cell differentiation and survival effectors, including the PI3K/AKT, RAS/RAF/MEK/ERK, and JAK2/STAT3 pathways. 2 In cancers, activation of RET is often achieved either through gain‐of‐function mutations or somatic rearrangements. 3 , 4 , 5 , 6
RET‐deregulated events have been studied in solid tumors but are infrequently described in hematological malignancies, with isolated cases reporting novel RET fusions such as RET‐BCR and RET‐FGFR1OP. 7 A large‐scale short hairpin RNA (shRNA)‐based screening of acute myeloid leukemia (AML) cell lines identified the dependency of AML subtypes on RET expression. 8 For instance, the RET‐mTORC1 signaling axis promotes leukemic growth in AML with FLT3 internal tandem duplication. 8 While high RET expression was noted in patients with AML and monocytic or intermediate‐mature myeloid phenotypes, mutational profiling has failed to explain the underlying molecular basis of RET dependency in AML. 6 , 9 , 10
In this study, we show that RET expression is significantly upregulated in AML subtypes harboring genetic fusions of KMT2A compared with age‐matched healthy donors and other AML subtypes. We propose a novel epigenetic mechanism of RET overexpression in KMT2A‐r AML and dissect the functional role of RET in KMT2A‐r cell lines by chemical RET inhibition.
2. MATERIALS AND METHODS
2.1. Cell lines and patient data
RET expression was evaluated in adult and pediatric AML patients as described in the Supplementary Information (SI). MV4‐11 (CRL‐9591) and KG‐1A (CCL‐246.1) cell lines were purchased from American Type Culture Collection (ATCC). The MOLM‐13 cell line was provided from the laboratory of late Prof. Robert J. Arceci, Phoenix Children's Hospital. Culture conditions are detailed in SI.
2.2. Analysis of chromatin assembly on RET oncogene
The higher‐order chromatin structure of RET was examined from publicly available HiC data in the MOLM‐13 cell line and CD34+ hematopoietic progenitor stem cells (HPSC) 11 , 12 (for details see Supplementary Information (SI) S1 and Table S1).
2.3. Assay for transposase‐accessible chromatin (ATAC) sequencing
Nuclei were prepared to assess the chromatin accessibility in MOLM‐13 and CD34+ HPSC in three experimental replicates according to the OMNI‐ATAC protocol. 13 The preparation of ATAC libraries and sequencing data processing have been described in the SI.
2.4. Prediction of transcription factor (TF) bindings to RET
Prediction of putative bindings of TFs was made using the Open Regulatory Annotation Database (ORegAnno) identifiers, which include the target regulatory regions belonging to the selective exons of RET (Table S2). 14
2.5. Coexpression analysis
We evaluated the degree of correlation (Spearman's ρ) between the expression of RET and other genes that code for enhancer‐bound proteins using Cancer Cell Line Encyclopedia (CCLE) data for the MLL‐r AML cell lines such as MOLM‐13, MONOMAC‐6, MV4‐11, NOMO1, OCIAML3, and THP1. 15
2.6. Cell viability assay
MOLM‐13, MV4‐11, and KG‐1A cell lines were treated with BI‐1347, sorafenib, or 8p. 16 Cells were cultured at 1 × 10⁴ cells/well in a 96‐well plate, supplemented with drugs at concentrations of 25, 10, 5, 2.5, 1, 0.5, 0.25, and 0.1 μM, compared with the untreated (control) in triplicate. Cells were grown for 48 h at 37°C, followed by the determination of cell viability with the CellTiter‐Glo Luminescent Cell Viability Assay (G7570, Promega). The half‐maximal inhibitory concentration (IC50) was evaluated and plotted with Prism software v7.0.
2.7. Molecular docking analysis of 8p
To construct a RET DFG‐out protein structure, a vascular endothelial growth factor receptor 2 (VEGFR‐2), DFG‐out crystal structure (Protein Data Bank [PDB]# 2OH4) and the amino acid sequence of RET (PDB# 2IVU) were obtained. The subsequent docking analysis has been described in the SI.
2.8. Quantitation of RNA and protein expression
Genes that code for RET ligand/coreceptor pairs, such as GDNF/GFRA1, NRTN/GFRA2, ARTN/GFRA3, or PSPN/GFRA4, were analyzed in triplicate with quantitative real‐time PCR (qRT‐PCR) in reference to the endogenous ATP5B (for details see Figure S1 and Table S3). For protein expression, whole‐cell lysates were prepared from the treated cells and controlled cells with RIPA buffer, followed by Western blotting using antibodies against CDK8, pSTAT1, and β‐actin (for details see SI S1 and Table S4).
2.9. Apoptosis and cell cycle assay
MOLM‐13 cells (1 × 10⁶) were treated in triplicate with 8p at concentrations of 5 and 10 nM. The control cells were labeled with FITC and propidium iodide with Dead Cell Apoptosis Kits with Annexin V for Flow Cytometry (V13242, Thermo Scientific), followed by apoptosis analysis with flow cytometry with an LSRFortessa Cell Analyzer (BD Bioscience). Using flow cytometry, treated cells were also analyzed for the distribution of different cell cycle stages after labeling the cells with Vybrant DyeCycle Violet Stain (V35003, Thermo Scientific).
2.10. Proteomic analysis with DIA‐MS
The whole‐cell protein lysates from both the control and treated MOLM‐13 cells (five independent biological replicates) were reduced, alkylated, and purified by chloroform/methanol extraction before digestion with sequencing‐grade modified porcine trypsin (V511A, Promega). 17 The subsequent processing of samples and analysis of MS data have been summarized in the SI S1.
2.11. Pathway enrichment analysis
Pathway enrichment analysis was performed with STRING (https://string‐db.org/) based on their molecular function at the highest confidence limit (0.9). The active interactions between proteins were considered only if supported by experimental evidence.
2.12. Oxidative stress biomarker analyses
MOLM‐13 cells treated with 8p at two different concentrations (5 nM and 10 nM) were tested for oxidative stress by determining the reduced GSH and GSSG 18 ratio as detailed in SI S1.
2.13. Metabolic flux assay
The metabolic flux in 8p‐treated MOLM‐13 cells was measured by determining the extracellular acidification rate (ECAR) and oxygen consumption rate (OCR) with the Seahorse XFe Analyzer (Agilent) and has been detailed in SI S1.
2.14. Statistical analysis
The difference in gene expression, apoptosis, percentage of cell population in cell cycle stages, and mitochondrial oxidative properties between treatment and control cells were analyzed with one‐way ANOVA, considering the difference significant at p < 0.01 or p < 0.05. The difference in RET expression between MOLM‐13 and HPSC was analyzed with a paired t‐test at a significant level of p < 0.01. Statistical plots were generated with Prism software v7 (GraphPad Software).
3. RESULTS
3.1. RET is overexpressed in KMT2A‐r AML subgroups
In the Microarray Innovations in Leukemia (MILE)‐AML study cohort of 542 cases of adult AML, 18 , 19 we identified that RET expression was significantly (p < 0.01) higher in the KMT2A‐r (log2 signal intensity 4.66 ± 0.75) subgroups compared with normal bone marrow (NBM) isolates (4.17 ± 0.24; Figure 1A). A propensity of high RET expression also was observed in the majority of KMT2A‐r subgroups among 1124 pediatric cases in the Therapeutically Applicable Research to Genome Effective Treatments (TARGET)‐pAML study. 20 We identified significant (p < 0.01) RET upregulation (fold change [FC] > 1, log2 transcripts per million ± SD) in the KMT2A‐MLLT3 (2.94 ± 5.24) subgroup, followed by the KMT2A‐MLLT10 (1.87 ± 2.29), KMT2A‐ELL (1.34 ± 3.22), and KMT2A‐MLLT4 (1.21 ± 1.6) subgroups compared with NBM mononuclear cells (0.22 ± 0.10) and other non‐KMT2A‐r AML (Figure 1B). We confirmed that the high RET expression observed in patient‐derived KMT2A‐r samples is consistent in a panel of AML lines. We identified high expression (TPM >10 and ≤100) to exceptional expression (TPM >100) of RET in primary KMT2A‐r samples, particularly those with KMT2A‐MLLT3 fusions (Figure 1C). Given the consistency of high expression between patients and representative cell lines, we further investigated the molecular basis of RET overexpression in AML‐harboring KMT2A‐MLLT3 fusions.
FIGURE 1.
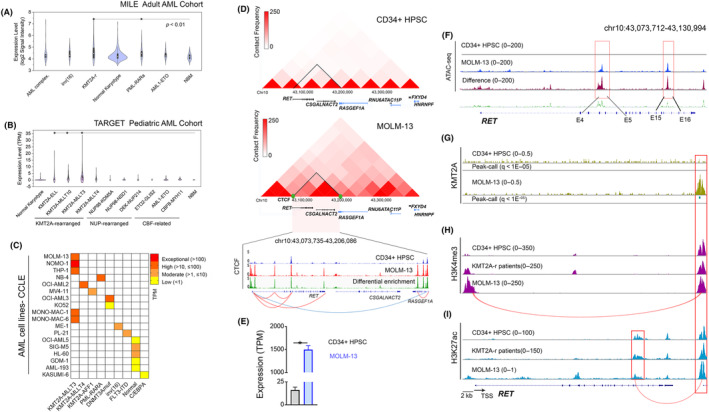
(A) The median of RET mRNA expression (signal intensity) in adult acute myeloid leukemia (AML) patients from the MILE study. (B) The median of RET mRNA expression (TPM) in pediatric and young adult patients with AML from the TARGET AML study. (C) An expression heatmap depicting the mRNA expression of RET in a panel of AML cell lines, as available in the Cancer Cell Line Encyclopedia (CCLE) dataset. (D) A CTCF‐guided TAD (blue arc) was predicted in KMT2A‐r positive MOLM‐13 cells, compared with CD34+ HPSC, flanking RET, CSGALNACT2, and RASGEF1A. Interstitial TAD extrusion loops (red arcs) were validated with the enrichment of CTCF. (E) RET was exceptionally upregulated in MOLM‐13 cells compared with hematopoietic progenitor stem cells (HPSC). (F) Differential chromatin opening was observed in RET, spanning the regions between E‐4 and E‐5 and between E‐15 and E‐16. ChIP‐sequencing data based on enrichment of (G) KMT2A, (H) H3K4me3, and (I) H3K27ac at selective loci of RET in MOLM‐13 cells, compared with HPSC.
3.2. RET expression is regulated by an enhancer loop in the KMT2A‐MLLT3 subgroup
Based on the marked RET expression in the MOLM‐13 cell line compared with CD34+ umbilical cord blood‐driven HPSC, we used published Hi‐C data to understand the differential higher‐order chromatin structure of RET in the KMT2A‐MLLT3 subgroup. 11 , 12 We identified a 132‐kb topologically associating domain (TAD) demarcated by the binding of CTCF TF, which encompasses RET, CSGALNACT2, and a portion of RASGEF1A (Figure 1D). The RET‐TAD observed in MOLM‐13 cells expressed a higher contact frequency, compared with HPSC, suggesting selective upregulation of RET in the KMT2A‐MLLT3 subgroup is mediated by de novo focal chromatin architecture. We observed a mean differential enrichment of CTCF binding across the TAD in MOLM‐13 cells compared with HPSC (Figure 1D). Most importantly, we noticed de novo intra‐TAD CTCF‐CTCF loops encompassing RET alone, which may coincide with activating TFs and histones, leading to overexpression of RET in KMT2A‐r AML, as evidenced by upregulation of the gene in MOLM‐13 cells (TPM = 1496) compared with HPSC (TPM = 16) (Figure 1E). In contrast, the RET‐adjacent genes, CSGALNACT2 and RASGEF1A were not upregulated compared with HPSC (SI, Figure S1).
Next, we performed ATAC‐seq to identify regions of differential chromatin accessibility between MOLM‐13 and HPSC at the RET locus. We found five regions with increased accessibility in MOLM‐13 cells located within exon 4 (E‐4) and E‐5 and an intronic region between E‐15 and E‐16 of RET (Table S5). We analyzed ChIP‐sequencing data and observed that KMT2A binding coincides with the activating H3K27ac and H3K4me3 marks at an intergenic region proximal to the 3′‐end of RET in samples from patients with KMT2A‐MLLT3 AML and MOLM‐13 cells, compared with HPSC (Figure 1G–I). Based on these data, we propose that H3K27ac mediates an enhancer interaction between the epigenetically primed intronic region flanking between E‐15 and E‐16 and the intergenic enhancer region proximal 3′‐end of RET. In contrast, H3K4me3 mediates an enhancer interaction between the transcription start site (TSS) and the same enhancer region.
3.3. Enhanced RET is tightly correlated with the expression of selective enhancer‐bound proteins
The open chromatin regions of RET spanning E‐4 and E‐5 encode for the extracellular domain, whereas E‐15 and E‐16 encode for the tyrosine‐kinase receptor of the intracellular domain of the gene (Figure 2A). 1 , 21 The increased chromatin accessibility of these exons seems crucial for the upregulation of RET, given that several activating TFs are predicted to bind these epigenetically primed exons (Table S2). For instance, E‐4 and E‐5 are expected to be bound by CTCF, epidermal growth receptor 1 (EGR1), estrogen receptor 1 (ESR1), and forkhead box P1 (FOXP1) (Figure 2B). In contrast, the intronic region between E‐15 and E‐16 was predicted to be bound by the SWI/SNF‐related, matrix‐associated, actin‐dependent regulator of chromatin, subfamily A, member 4 (SMARCA4), squamosa promoter‐binding protein‐like 1 (SPL1), melanocyte‐inducing transcription factor (MITF1), and EBF transcription factor 1 (EBF1) (Figure 2C).
FIGURE 2.
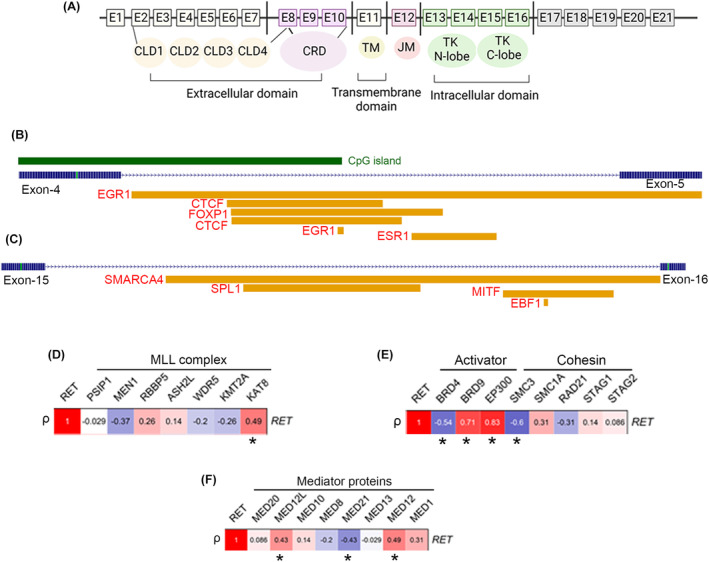
(A) Schematic representation of the RET protein. The epigenetically primed regions of RET proto‐oncogene, which span the E‐4 and E‐5 (B) and E‐15 and E‐16 (C), represent the predicted binding of different activating transcription factors. The degree of correlation (* r ≥ 0.4 or r ≤ ‐0.4, p < 0.05) was evaluated between the expression of RET with essential genes involved in the formation of KMT2A‐complex (D), the activator or cohesion complex of enhancer assemblies (E), or establishing the enhancer‐mediator complexes (F).
Considering that RET expression is epigenetically enhanced in KMT2A‐r AML cases, we examined the degree of correlation between the expression of RET and key genes belonging to the KMT2A complex such as PSIP1, MEN1, RBBP5, ASH2L, WDR5, KMT2A, and KAT8 (Figure 2D) in a panel of KMT2A‐MLLT3 cell lines. We similarly evaluated additional epigenetic regulator genes (including BRD4, BRD9, and EP300), cohesion‐complexes (SMC3, SMC1A, RAD21, STAG1, and STAG2) (Figure 2E), and enhancer‐bound mediator‐complex subunits (MED20, MED12L, MED10, MED8, MED21, MED13, MED12, and MED1) in AML cell lines (Figure 2F). We observed a positive correlation (ρ ≥ ±0.4) between the expression of RET and KMT2A (ρ = 0.49), BRD9 (ρ = 0.71), EP300 (ρ = 0.83), MED12 (ρ = 0.49), and the MED12 paralog MED12L (ρ = 0.43). In contrast, a negative correlation was observed between the expression of RET and SMC3 (ρ = −0.6) and MED21 (ρ = −0.43).
3.4. Dual inhibition of RET and CDK8 kinase in KMT2A‐r AML
Given that RET expression is tightly correlated with MED12/12 L in KMT2A‐r cases, we aimed to test whether KMT2A‐r cells are susceptible to CDK8 inhibition, a close associating kinase partner of MED12/12 L. We treated KMT2A‐r positive lines, MOLM‐13 and MV4‐11, compared with a non‐KMT2A‐r AML cell line, KG‐1A, with a type I selective CDK8 inhibitor, BI‐1347. 22 We found that IC50 values against BI‐1347 were reached at relatively lower concentrations in MOLM‐13 cells (73.81 nM) and MV4‐11 cells (147 nM) compared with the KG‐1A (2.36 μM) cells (Figure 3A). This observation leads to the idea of targeting the KMT2A‐r‐positive AML cells with an inhibitor having dual inhibition against CDK8 and RET. With this rationale, we treated the target cells with sorafenib, a known inhibitor of RET and CDK8. 23 , 24 The IC50 of sorafenib was reached at relatively low concentrations in MOLM‐13 (26.1 nM) and MV4‐11 (45.5 nM) compared with BI‐1347 (Figure 3B). To further improve the dual inhibition efficacy against CDK8 and RET, we used a synthetic pyrazoloadenine‐based molecule, 8p (RET/CDK8i), which previously demonstrated inhibition of RET and CDK8 (Figure 3C). 16 With the 8p treatment, the IC50 exhibited a remarkable drop in both the MOLM‐13 (7.25 nM) and MV4‐11 cells (9.75 nM) compared with sorafenib (Figure 3D).
FIGURE 3.
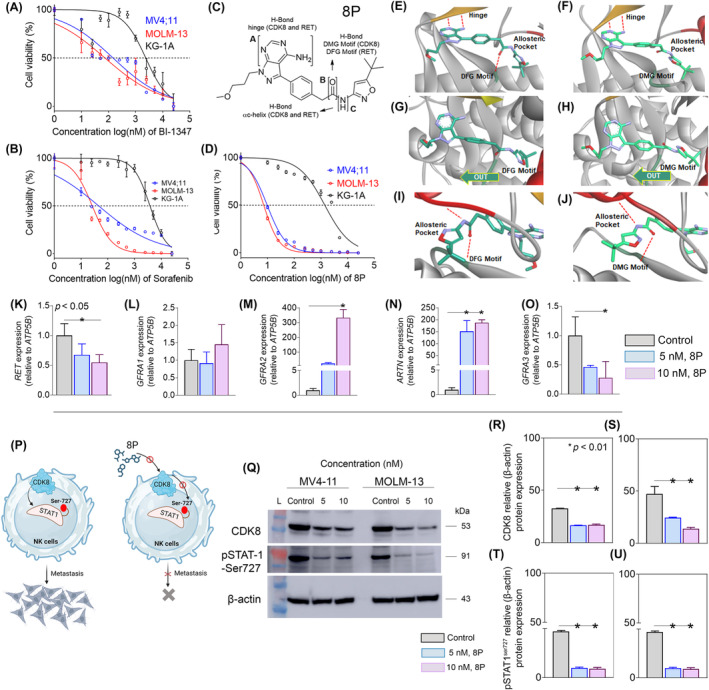
The IC50 against BI‐1347 (A) sorafenib (B) was achieved at significantly lower concentrations in KMT2A‐r‐positive AML cell lines, MV4‐11 and MOLM‐13, compared with a non‐KMT2A‐r AML cell line, KG‐1A. (C) Schema representing the structure of a synthetic RET‐inhibitor, 8p, which possesses dual inhibition efficacy against RET and CDK8. (D) MV4‐11 and MOLM‐13 cells were also susceptible to 8p but not KG‐1A cells. Computational modeling of 8p in RET (E, G, I) and CDK8 (F, H, J), In both RET (E) and CDK8 (F), 8p is predicted to create two hydrogen bonds with the kinase hinge and a hydrogen bond with aspartic acid of the DFG motif in RET and the DMG motif of CDK8. 8p is predicted to bind to the DXG‐out conformation in RET (G, DFG‐out) and CDK8 (H, DMG‐out). The free rotation of the methylene linker in 8p is predicted to permit conformation adjustments when binding to the DXG motif in either kinase (G, H). 8p is precited to form a hydrogen bond with the c‐Helix in RET (I) and CDK8 (J) at the back of the allosteric pocket. RET mRNA expression was significantly reduced in MOLM‐13 cells treated at different concentrations of 8p (K). No change was observed in GFRA1 expression in treated versus control cells (L). A significant increase in GFRA2 expression was observed in cells treated at 10 nM of 8P compared with the control (M). Despite a substantial increase in the expression of ARTN, a reduction in its receptor, GRFA3, was observed in cells treated with 10 nM 8p (N, O). (P) Schematic representation of the possible effect of inhibiting CDK8 and phosphorylation (serine 727) of its downstream effector, STAT1, on the proliferation of cancer cells. (Q) Western blot representing the reduction in the protein expression of CDK8 and pSTAT1 in MV4‐11 and MOLM‐13 cell lines. A decrease was observed in CDK8 (R, S) and pSTAT1 (T, U) expression in MV4‐11 and MOLM‐13 cell lines.
RET/CDK8i was modeled in RET (DFG‐out) and CDK8 (DMG‐out) kinase domains with AutoDock Vina. 25 , 26 Based on the modeling studies, fundamental interactions were identified that RET/CDK8i makes with both RET and CDK8. The pyrazoloadenine warhead forms a hydrogen bond at the hinge of both kinases, the amide linker oxygen accepts a hydrogen bond at both the DFG motif (RET) and DMG motif (CKD8), and the amide linker nitrogen donates a hydrogen bond with the αc‐helix of both allosteric pockets. Furthermore, overall binding geometries of RET/CDK8i in both RET and CDK8 are similar at the hinge, DFG/DMG motifs, and allosteric pocket (Figure 3E–J). Together, these computational modeling studies support the idea that RET/CDK8i is a dual RET/CDK8 inhibitor.
We observed a dose–response in RET expression in cells treated with RET/CDK8i at concentrations of 5 nM (32% ± 0.14 decrease) and 10 nM (45% ± 0.14 reduction) (Figure 3K). Next, we examined whether RET inhibition affects the expression of RET ligand/coreceptor pairs. We did not observe amplification of GDNF, NRTN, PSPN ligands, or the PSPN receptor GFRA4. In contrast, a nonsignificant (p > 0.01) change in expression was observed for GFRA1 (GDNF‐receptor) in treated cells (Figure 3L). However, we observed a significant increase (322% ± 26.4) in GFRA2 expression in cells treated at 10 nM (Figure 3M). Expression data suggest that RET expression may be facilitated through the ARTN/GFRA3 ligand‐receptor pair in KMT2A‐r AML because we observed significant alterations, particularly in the expression of this pair. For instance, we observed a substantial enhancement in ARTN expression in treated cells compared with control (Figure 3N). In contrast, expression of the ARTN receptor, GFRA3, was significantly decreased (72% ± 0.2) at 10 nM compared with the control (Figure 3O).
Next, we tested the inhibition efficacy of RET/CDK8i against CDK8, and its downstream effector STAT1. 27 CDK8 has been demonstrated to phosphorylate serine 727 (S727) of STAT1 to promote metastasis, while inhibition of CDK8 reduces cell proliferation (Figure 3P). 28 Since RET/CDK8i is predicted to bind both RET and CDK8, we hypothesized that RET/CDK8i also exerts an inhibitory effect on CDK8 and its downstream STAT‐S727 substrate. To test this, we measured alterations in CDK8 and phosphorylated STAT1 (pSTAT) expression levels in MV4‐11 and MOLM‐13 cells treated with RET/CDK8i (Figure 3Q). We observed a significant (p < 0.01) reduction in CDK8 protein levels in both MV4‐11 and MOLM‐13 cells (Figure 3R,S). We also observed a substantial degree of reduction in pSTAT‐S727 levels in both MV4‐11 and MOLM‐13 cells (Figure 3T,U).
3.5. RET‐CDK8 inhibition induces apoptotic responses in KMT2A‐r AML cell lines
The impact of RET and CDK8 inhibition was further assessed on apoptosis and cell cycling in MOLM‐13 cells at two sub‐IC50 concentrations of RET/CDK8i. We identified a significant (p < 0.01) increase in early‐apoptotic (Q2) and late‐apoptotic (Q3) cell populations in treated groups (Figure 4A). The early‐apoptotic population increased by 11% with 5 nM and 12.6% with 10 nM compared with the control (1.06%). The late‐apoptotic population increased by 17.8% with 5 nM and 20.2% with 10 nM compared with the control (2.96%). The induction of apoptotic events in treated cells is further supported by a significant (p < 0.01) increase in cellular fragments in the sub‐G1 phase compared with the control (Figure 4B). Additionally, the G2/M population was significantly reduced in MOLM‐13 cells treated with 5 nM (2.72 ± 0.26) or 10 nM (3.53 ± 0.26) of RET/CDK8i compared with the nontreated cells.
FIGURE 4.
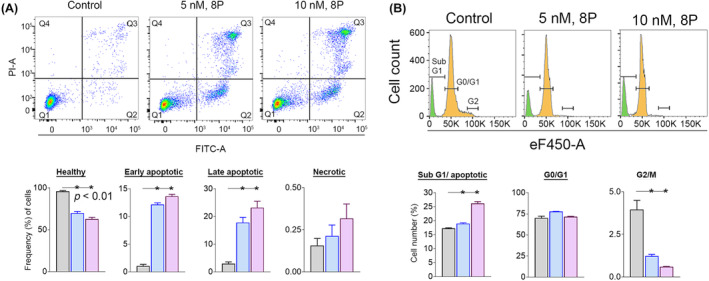
(A) A dual inhibition of RET and CDK8 was found to induce apoptotic responses, such that early and late apoptotic cell population was increased in MOLM‐13 cells in response to the treatment of RET/CDK8i. (B) Cell cycle analysis indicated a possible increase in cellular fragments in RET/CDK8i‐treated MOLM‐13 cells.
3.6. Targeted inhibition of RET‐CDK8 evokes an oxidative stress response
We studied the effects of RET‐CDK8 inhibition in MOLM‐13 cells by profiling the alterations in global protein expression with data‐independent acquisition mass spectrometry (DIA‐MS)‐based proteomics. We identified 4116 unique differentially expressed proteins (Table S6) with 301 proteins significantly (p < 0.05, FC > 1, log2) upregulated and 436 proteins downregulated in cells treated with RET/CDK8i at 5 nM (Figure 5A). Similarly, we observed 323 proteins upregulated and 507 proteins downregulated in cells treated with RET/CDK8i at 10 nM (Figure 5A). We observed a concentration‐dependent change in protein expression in 212 proteins that were mutually upregulated and 382 proteins that were mutually downregulated at both concentrations (Figure 5B). Next, based on molecular function, we determined that most upregulated proteins were enriched for oxidative‐stress or transport‐related pathways (Figure 5C). A relatively more minor fraction of the differentially upregulated proteins also was increased for the nucleosomal DNA binding or protein heterodimerization. In contrast, differentially downregulated proteins were primarily involved with nuclear or cytoskeletal functions (Figure 5D).
FIGURE 5.
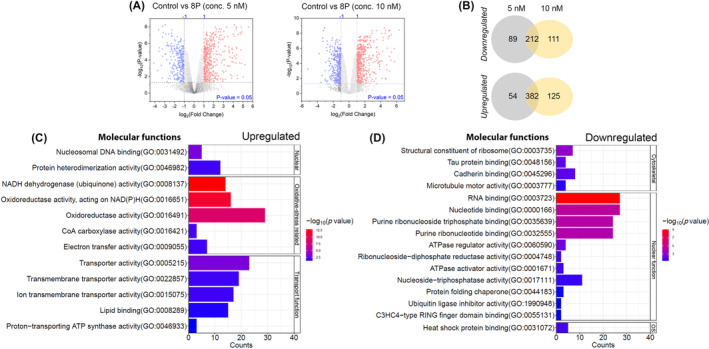
(A) Volcano plots represent differential upregulation (red) and downregulation (blue) of the proteins in MOLM‐13 cells treated with RET/CDK8i at 5 nM or 10 nM. (B) Venn diagram representing the differentially expressed proteins in cells mutually inclusive or exclusive at the concentrations of RET/CDK8i used. Several signaling pathways were predicted based on the enrichment of molecular functions of differentially (C) upregulated or (D) downregulated proteins.
We quantified oxidative stress‐related biomarkers because inhibition of RET and CDK8 evokes oxidative stress‐related pathways. Glutathione (GSH) levels were significantly (p < 0.01) decreased in cells treated with RET/CDK8i at all concentrations (Figure 6A), and oxidized glutathione disulfide (GSSG) was significantly increased in cells treated at 10 nM (Figure 6B), with a concomitant reduction in the GSH/GSSG ratio to <5 times in cells treated at both 5 and 10 nM (Figure 6C). We also observed an increase of 20% in 8‐hydroxy‐2‐deoxyguanosine (8‐OHdG) content in RET‐inhibited cells (Figure 6D). Next, we measured mitochondrial respiration and anaerobic glycolysis and CO2 production by quantifying the basal OCR and basal ECAR in cells treated with RET/CDK8i. We observed a significant (p < 0.01) reduction in both the OCR (Figure 6E,G) and ECAR (Figure 6F,H) at all concentrations, indicating a global decrease in cellular bioenergetics and metabolism.
FIGURE 6.
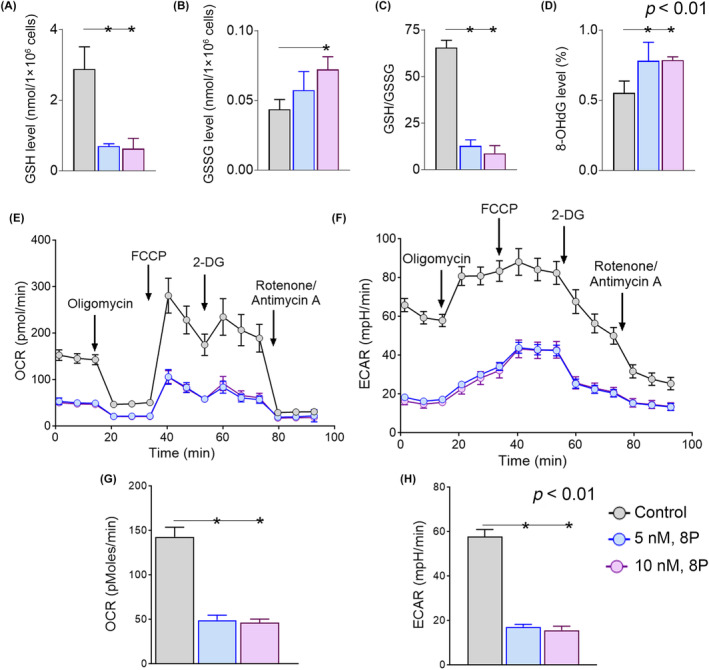
The level of oxidative stress in RET‐inhibited cells was determined with the observation that the glutathione (GSH) level (A) was decreased, and the glutathione disulfide (GSSG) level (B) was increased, whereas the ratio of GSH to GSSG (C) was significantly decreased in treated cells, compared with control. (D) The impact of RET inhibition on DNA fragmentation was confirmed with the increase in 8‐OHdG level in treated cells. A significant reduction in both the basal oxygen consumption rate (OCR) (E, G) and basal extracellular acidification rate (ECAR) (F, H) suggests that RET inhibition could severely compromise the bioenergetics of the cells.
4. DISCUSSION
Our findings suggest an active epigenetic regulation of RET overexpression in KMT2A‐r AML patients. We identified a de novo leukemia‐specific TAD in MOLM‐13 cells, compared with HPSC encompassing RET and adjacent genes, CSGALNACT2 and RASGEF1A. However, despite sharing the same TAD, we did not see any noticeable changes (FC >1, log2) in the expression of CSGALNACT2 (Figure S1A) and observed no RASGEF1A expression (FC = −9.72) in MOLM‐13 (Figure S1B). This disparity can be explained by the intra‐TAD CTCF‐CTCF loop model, where the formation of multiple CTCF‐guided interphase loop extrusions is possible within the same TAD, thereby allowing differential accessibility of these genes to activators or repressors that limit transcriptional output. 29 , 30 The epigenetically primed intronic regions flanking between E‐4 and E‐5 or E‐15 and E‐16 of RET have been predicted to be the binding sites of several activating factors, which has been seen in other RET‐deregulated cancers (Figure 2B,C). For instance, GDNF‐RET signaling was reported to be regulated by EGR1 and ESR1 in different types of cancer. 31 , 32 , 33 In contrast, the predicted binding of SPL1, MITF, or EBF1 to E‐15/E‐16 suggests the possible importance of the gene in physiological functions. Previously, SMARCA4 and RET mutations were found mutually exclusive in non‐small cell lung cancer. 34 Therefore, the predicted binding of SMARCA4 to E15/16 could not be explained within the scope of the current study but could be interesting to investigate.
Based on the correlation between the expression of RET and MED12/12 L (Figure 2G), we used a synthetic inhibitor that could inhibit RET and MED12‐bound CDK8 kinase. Previously, from kinome profiling, we observed reactivity of 8p against CDK8 in addition to CDK7 and CDK11 within the CDK family 16 (Table S8). Nonetheless, given the dual inhibition efficacy of the drug against RET and CDK8 over other multikinase inhibitors such as sorafenib, we used 8p in the current study. RET/CDK8i reserves an advantage over selective RET inhibitors, 35 as inhibiting RET alone may not interfere with the de novo enhancer loop upstream of the gene. In contrast, 8p treatment perturbs the chromatin‐mediator loop associated with CDK8 and the downstream RET proteins in AML cells. RET/CDK8i treatment also inhibited the phosphorylation of STAT1, a downstream effector of CDK8 (Figure 3Q–U).
RET has previously been shown to promote oncogenesis by inducing antiapoptotic signaling in a classical mechanism. 36 , 37 , 38 We have expanded upon this mechanism by offering that inhibition of RET and enhancer‐bound CDK8 evoked a significant increase in apoptotic responses in cells because many differentially upregulated proteins were enriched for oxidative stress‐related pathways (Figure 4A). These findings align with the observation that both mitochondrial respiration and glycolytic respiration are compromised in RET/CDK8i‐treated cells (Figure 6). In contrast, while many proteins downregulated in response to RET/CDK8i were associated with nuclear functions, the expression of a nuclear‐encoded flavoprotein, NADH dehydrogenase (ubiquinone) flavoprotein 2 (NDUFV2), was increased (Table S7). RET is reported to regulate the expression of mitochondrial complex‐I components and ATP production, including the complex I core component encoded by NDUFV2. 39 Inhibition of the RET‐CDK8 axis thus indicates a similar oncoprotein function in regulating stress responses in KMT2A‐r AML.
In summary, we identified a novel enhancer that regulates RET overexpression in KMT2A‐r AML and used a synthetic inhibitor to manipulate this epigenetic vulnerability therapeutically. A rational follow‐up of the current study will aim to tease out the resistance of RET/CDK8i against non‐KMT2A‐r cells such as KG‐1A. We also aim to evaluate the efficacy of RET/CDK8i in vivo with the KMT2A‐r xenograft mouse model. The proof of concept generated from this current study provides a rationale for targeting the RET proto‐oncogene in KMT2A‐r AML.
AUTHOR CONTRIBUTIONS
Brendan Frett: Data curation; formal analysis; investigation; methodology; writing – review and editing. Kimberly E. Stephens: Formal analysis; investigation; methodology; writing – review and editing. Brian Koss: Formal analysis; investigation; methodology; writing – review and editing. Stepan Melnyk: Formal analysis; investigation; methodology; writing – review and editing. Jason Farrar: Formal analysis; investigation; methodology; writing – review and editing. Debasmita Saha: Investigation; methodology; writing – review and editing. Samrat Roy Choudhury: Conceptualization; data curation; formal analysis; investigation; methodology; supervision.
FUNDING INFORMATION
The study was supported by grants from the NIH (P20GM121293) to SRC and KES and partially by the NIGMS (P20GM109005) to BF. The study was also partly supported by the Seeds of Science award, UAMS proteomics vouchers, and start‐up from the WPRCI/UAMS and ACRI to SRC.
CONFLICT OF INTEREST STATEMENT
The authors have no conflict of interest. None of the authors in the manuscript are this journal's editors/editorial board members.
ETHICS STATEMENT
Approval of the research protocol by an Institutional Reviewer Board: N/A.
Informed Consent: N/A.
Registry, and the Registration No. of the study/trial: N/A.
Animal Studies: N/A.
Supporting information
Supplementary Information
Tables S1–S8.
ACKNOWLEDGEMENTS
We are thankful to the science communication group at the University of Arkansas for Medical Sciences for the critical reading and proofreading of the manuscript.
Frett B, Stephens KE, Koss B, et al. Enhancer‐activated RET confers protection against oxidative stress to KMT2A‐rearranged acute myeloid leukemia. Cancer Sci. 2024;115:963‐973. doi: 10.1111/cas.16069
DATA AVAILABILITY STATEMENT
The Gene Expression Omnibus has been used to deposit the RNA‐sequencing (GSE241867) and ATAC sequencing (GSE241738) data from the CD34+ HPSC and MOLM‐13 cell line.
REFERENCES
- 1. Jhiang SM. The RET proto‐oncogene in human cancers. Oncogene. 2000;19:5590‐5597. doi: 10.1038/sj.onc.1203857 [DOI] [PubMed] [Google Scholar]
- 2. Regua AT, Najjar M, Lo HW. RET signaling pathway and RET inhibitors in human cancer. Front Oncol. 2022;12:932353. doi: 10.3389/fonc.2022.932353 [DOI] [PMC free article] [PubMed] [Google Scholar]
- 3. Salvatore D, Santoro M, Schlumberger M. The importance of the RET gene in thyroid cancer and therapeutic implications. Nat Rev Endocrinol. 2021;17:296‐306. doi: 10.1038/s41574-021-00470-9 [DOI] [PubMed] [Google Scholar]
- 4. Santoro M, Carlomagno F. Central role of RET in thyroid cancer. Cold Spring Harb Perspect Biol. 2013;5:a009233. doi: 10.1101/cshperspect.a009233 [DOI] [PMC free article] [PubMed] [Google Scholar]
- 5. Drusbosky LM, Rodriguez E, Dawar R, Ikpeazu CV. Therapeutic strategies in RET gene rearranged non‐small cell lung cancer. J Hematol Oncol. 2021;14:50. doi: 10.1186/s13045-021-01063-9 [DOI] [PMC free article] [PubMed] [Google Scholar]
- 6. Zhou L, Li J, Zhang X, Xu Z, Yan Y, Hu K. An integrative pan cancer analysis of RET aberrations and their potential clinical implications. Sci Rep. 2022;12:13913. doi: 10.1038/s41598-022-17791-y [DOI] [PMC free article] [PubMed] [Google Scholar]
- 7. Ballerini P, Struski S, Cresson C, et al. RET fusion genes are associated with chronic myelomonocytic leukemia and enhance monocytic differentiation. Leukemia. 2012;26:2384‐2389. doi: 10.1038/leu.2012.109 [DOI] [PubMed] [Google Scholar]
- 8. Rudat S, Pfaus A, Cheng YY, et al. RET‐mediated autophagy suppression as targetable co‐dependence in acute myeloid leukemia. Leukemia. 2018;32:2189‐2202. doi: 10.1038/s41375-018-0102-4 [DOI] [PubMed] [Google Scholar]
- 9. Gattei V, Degan M, Rossi FM, et al. The RET receptor tyrosine kinase, but not its specific ligand, GDNF, is preferentially expressed by acute leukaemias of monocytic phenotype and is up‐regulated upon differentiation. Br J Haematol. 1999;105:225‐240. doi: 10.1111/j.1365-2141.1999.01285.x [DOI] [PubMed] [Google Scholar]
- 10. Visser M, Hofstra RMW, Stulp RP, et al. Absence of mutations in the RET gene in acute myeloid leukemia. Ann Hematol. 1997;75:87‐90. doi: 10.1007/s002770050319 [DOI] [PubMed] [Google Scholar]
- 11. Xu Z, Lee DS, Chandran S, et al. Structural variants drive context‐dependent oncogene activation in cancer. Nature. 2022;612:564‐572. doi: 10.1038/s41586-022-05504-4 [DOI] [PMC free article] [PubMed] [Google Scholar]
- 12. Reilly A, Philip Creamer J, Stewart S, et al. Lamin B1 deletion in myeloid neoplasms causes nuclear anomaly and altered hematopoietic stem cell function. Cell Stem Cell. 2022;29:577‐592. doi: 10.1016/j.stem.2022.02.010 [DOI] [PMC free article] [PubMed] [Google Scholar]
- 13. Corces MR, Trevino AE, Hamilton EG, et al. An improved ATAC‐seq protocol reduces background and enables interrogation of frozen tissues. Nat Methods. 2017;14:959‐962. [DOI] [PMC free article] [PubMed] [Google Scholar]
- 14. Lesurf R, Cotto KC, Wang G, et al. ORegAnno 3.0: a community‐driven resource for curated regulatory annotation. Nucleic Acids Res. 2016;44:D126‐D132. doi: 10.1093/nar/gkv1203 [DOI] [PMC free article] [PubMed] [Google Scholar]
- 15. Ghandi M, Huang FW, Jané‐Valbuena J, et al. Next‐generation characterization of the cancer cell line encyclopedia. Nature. 2019;569:503‐508. doi: 10.1038/s41586-019-1186-3 [DOI] [PMC free article] [PubMed] [Google Scholar]
- 16. Frett B, Saha D, Ryan K, Lakkaniga R, Smith E. Pyrazoloadenine inhibitors of the RET lung cancer Oncoprotein discovered by a fragment optimization approach. ChemMedChem. 2021;16:1605‐1608. doi: 10.1002/cmdc.202100013 [DOI] [PMC free article] [PubMed] [Google Scholar]
- 17. Wiśniewski JR, Zougman A, Nagaraj N, Mann M. Universal sample preparation method for proteome analysis. Nat Methods. 2009;6:359‐362. doi: 10.1038/nmeth.1322 [DOI] [PubMed] [Google Scholar]
- 18. Haferlach T, Kohlmann A, Wieczorek L, et al. Clinical utility of microarray‐based gene expression profiling in the diagnosis and subclassification of leukemia: report from the international microarray innovations in leukemia study group. J Clin Oncol. 2010;28:2529‐2537. [DOI] [PMC free article] [PubMed] [Google Scholar]
- 19. Kohlmann A, Kipps TJ, Rassenti LZ, et al. An international standardization programme towards the application of gene expression profiling in routine leukaemia diagnostics: the microarray innovations in LEukemia study prephase. Br J Haematol. 2008;142:802‐807. doi: 10.1111/j.1365-2141.2008.07261.x [DOI] [PMC free article] [PubMed] [Google Scholar]
- 20. Farrar JE, Smith JL, Othus M, et al. Long noncoding RNA expression independently predicts outcome in pediatric acute myeloid leukemia. J Clin Oncol. 2023;41:2949‐2962. doi: 10.1200/jco.22.01114 [DOI] [PMC free article] [PubMed] [Google Scholar]
- 21. Kucharczyk T, Krawczyk P, Kowalski DM, Płużański A, Kubiatowski T, Kalinka E. RET proto‐oncogene‐not such an obvious starting point in cancer therapy. Cancers (Basel). 2022;14(21):5298. doi: 10.3390/cancers14215298 [DOI] [PMC free article] [PubMed] [Google Scholar]
- 22. Hofmann MH, Mani R, Engelhardt H, et al. Selective and potent CDK8/19 inhibitors enhance NK‐cell activity and promote tumor surveillance. Mol Cancer Ther. 2020;19:1018‐1030. doi: 10.1158/1535-7163.Mct-19-0789 [DOI] [PMC free article] [PubMed] [Google Scholar]
- 23. Bergeron P, Koehler MFT, Blackwood EM, et al. Design and development of a series of potent and selective type II inhibitors of CDK8. ACS Med Chem Lett. 2016;7:595‐600. doi: 10.1021/acsmedchemlett.6b00044 [DOI] [PMC free article] [PubMed] [Google Scholar]
- 24. Horiike A, Takeuchi K, Uenami T, et al. Sorafenib treatment for patients with RET fusion‐positive non‐small cell lung cancer. Lung Cancer. 2016;93:43‐46. doi: 10.1016/j.lungcan.2015.12.011 [DOI] [PubMed] [Google Scholar]
- 25. Eberhardt J, Santos‐Martins D, Tillack AF, Forli S. AutoDock Vina 1.2.0: new docking methods, expanded force field, and python bindings. J Chem Inf Model. 2021;61:3891‐3898. doi: 10.1021/acs.jcim.1c00203 [DOI] [PMC free article] [PubMed] [Google Scholar]
- 26. Trott O, Olson AJ. AutoDock Vina: improving the speed and accuracy of docking with a new scoring function, efficient optimization, and multithreading. J Comput Chem. 2010;31:455‐461. doi: 10.1002/jcc.21334 [DOI] [PMC free article] [PubMed] [Google Scholar]
- 27. Bancerek J, Poss ZC, Steinparzer I, et al. CDK8 kinase phosphorylates transcription factor STAT1 to selectively regulate the interferon response. Immunity. 2013;38:250‐262. doi: 10.1016/j.immuni.2012.10.017 [DOI] [PMC free article] [PubMed] [Google Scholar]
- 28. Putz EM, Gotthardt D, Hoermann G, et al. CDK8‐mediated STAT1‐S727 phosphorylation restrains NK cell cytotoxicity and tumor surveillance. Cell Rep. 2013;4:437‐444. doi: 10.1016/j.celrep.2013.07.012 [DOI] [PMC free article] [PubMed] [Google Scholar]
- 29. Fudenberg G, Imakaev M, Lu C, Goloborodko A, Abdennur N, Mirny LA. Formation of chromosomal domains by loop extrusion. Cell Rep. 2016;15:2038‐2049. doi: 10.1016/j.celrep.2016.04.085 [DOI] [PMC free article] [PubMed] [Google Scholar]
- 30. Tena JJ, Santos‐Pereira JM. Topologically associating domains and regulatory landscapes in development, evolution and disease. Front Cell Dev Biol. 2021;9:702787. doi: 10.3389/fcell.2021.702787 [DOI] [PMC free article] [PubMed] [Google Scholar]
- 31. Bhinge K, Yang L, Terra S, et al. EGFR mediates activation of RET in lung adenocarcinoma with neuroendocrine differentiation characterized by ASCL1 expression. Oncotarget. 2017;8:27155‐27165. [DOI] [PMC free article] [PubMed] [Google Scholar]
- 32. Marks BA, Pipia IM, Mukai C, et al. GDNF‐RET signaling and EGR1 form a positive feedback loop that promotes tamoxifen resistance via cyclin D1. BMC Cancer. 2023;23:138. doi: 10.1186/s12885-023-10559-1 [DOI] [PMC free article] [PubMed] [Google Scholar]
- 33. Stine ZE, McGaughey DM, Bessling SL, Li S, McCallion AS. Steroid hormone modulation of RET through two estrogen responsive enhancers in breast cancer. Hum Mol Genet. 2011;20:3746‐3756. doi: 10.1093/hmg/ddr291 [DOI] [PMC free article] [PubMed] [Google Scholar]
- 34. Tian Y, Xu L, Li X, Li H, Zhao M. SMARCA4: current status and future perspectives in non‐small‐cell lung cancer. Cancer Lett. 2023;554:216022. doi: 10.1016/j.canlet.2022.216022 [DOI] [PubMed] [Google Scholar]
- 35. Hadoux J, Elisei R, Brose MS, et al. Phase 3 trial of Selpercatinib in advanced RET‐mutant medullary thyroid cancer. N Eng J Med. 2023;389:1851‐1861. doi: 10.1056/NEJMoa2309719 [DOI] [PubMed] [Google Scholar]
- 36. Drosten M, Hilken G, Bockmann M, et al. Role of MEN2A‐derived RET in maintenance and proliferation of medullary thyroid carcinoma. J Natl Cancer Inst. 2004;96:1231‐1239. [DOI] [PubMed] [Google Scholar]
- 37. Myers SM, Mulligan LM. The RET receptor is linked to stress response pathways. Cancer Res. 2004;64:4453‐4463. doi: 10.1158/0008-5472.Can-03-3605 [DOI] [PubMed] [Google Scholar]
- 38. Bagheri‐Yarmand R, Sinha KM, Li L, et al. Combinations of tyrosine kinase inhibitor and ERAD inhibitor promote oxidative stress–induced apoptosis through ATF4 and KLF9 in medullary thyroid cancer. Mol Cancer Res. 2019;17:751‐760. doi: 10.1158/1541-7786.Mcr-18-0354 [DOI] [PMC free article] [PubMed] [Google Scholar]
- 39. Klein P, Muller‐Rischart AK, Motori E, et al. Ret rescues mitochondrial morphology and muscle degeneration of drosophila Pink1 mutants. EMBO J. 2014;33:341‐355. doi: 10.1002/embj.201284290 [DOI] [PMC free article] [PubMed] [Google Scholar]
Associated Data
This section collects any data citations, data availability statements, or supplementary materials included in this article.
Supplementary Materials
Supplementary Information
Tables S1–S8.
Data Availability Statement
The Gene Expression Omnibus has been used to deposit the RNA‐sequencing (GSE241867) and ATAC sequencing (GSE241738) data from the CD34+ HPSC and MOLM‐13 cell line.


