Abstract
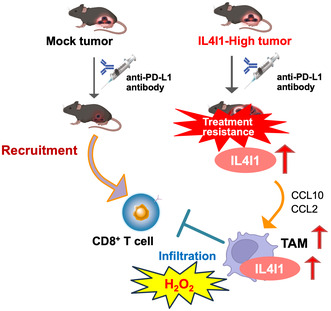
Cancer cells adopt multiple strategies to escape tumor surveillance by the host immune system and aberrant amino acid metabolism in the tumor microenvironment suppresses the immune system. Among the amino acid‐metabolizing enzymes is an L‐amino‐acid oxidase called interleukin‐4 induced 1 (IL4I1), which depletes essential amino acids in immune cells and is associated with a poor prognosis in various cancer types. Although IL4I1 is involved in immune metabolism abnormalities, its effect on the therapeutic efficacy of immune checkpoint inhibitors is unknown. In this study, we established murine melanoma cells overexpressing IL4I1 and investigated their effects on the intratumor immune microenvironment and the antitumor efficacy of anti‐programmed death‐ligand 1 (PD‐L1) antibodies (Abs) in a syngeneic mouse model. As a result, we found that IL4I1‐overexpressing B16‐F10‐derived tumors showed resistance to anti‐PD‐L1 Ab therapy. Transcriptome analysis revealed that immunosuppressive genes were globally upregulated in the IL4I1‐overexpressing tumors. Consistently, we showed that IL4I1‐overexpressing tumors exhibited an altered subset of lymphoid cells and particularly significant suppression of cytotoxic T cell infiltration compared to mock‐infected B16‐F10‐derived tumors. After treatment with anti‐PD‐L1 Abs, we also found a more prominent elevation of tumor‐associated macrophage (TAM) marker, CD68, in the IL4I1‐overexpressing tumors than in the mock tumors. Consistently, we confirmed an enhanced TAM infiltration in the IL4I1‐overexpressing tumors and a functional involvement of TAMs in the tumor growth. These observations indicate that IL4I1 reprograms the tumor microenvironment into an immunosuppressive state and thereby confers resistance to anti‐PD‐L1 Abs.
Keywords: IL4I1, immune checkpoint inhibitor, immune escape, melanoma, tumor microenvironment
Interleukin‐4 induced 1 overexpression upregulates immunosuppressive gene expression, decreases CD8+ T cell infiltration, and causes resistance to the anti‐ programmed death‐ligand‐1 Ab therapy in a mouse melanoma model.
Abbreviations
- Abs
antibody
- AhR
aryl hydrocarbon receptor
- AMM
amelanotic malignant melanoma
- CCL
C‐C motif chemokine ligand
- CL
clodronate liposome
- DDBJ
DNA Data Bank of Japan
- DRAGEN
Dynamic Read Analysis for GENomics
- FC
fold change
- GO
Gene Ontology
- ICI
immune checkpoint inhibitor
- IDO
indoleamine 2,3‐dioxygenase
- IHC
immunohistochemistry
- IL4I1
interleukin‐4 induced 1
- PAS
periodic acid–Schiff
- PD‐L1
programmed death‐ligand 1
- qPCR
quantitative PCR
- RNA‐seq
RNA sequencing
- TAM
tumor‐associated macrophage
- TCGA
The Cancer Genome Atlas
- TDO
tryptophan 2,3‐dioxygenase
- TIL
Tumor infiltrated Lymphocytes
- Treg
regulatory T cell
- TV
tumor volume
- WB
western blot
1. INTRODUCTION
The advent of programmed death‐1/PD‐L1 immune checkpoint inhibitors (ICIs) has dramatically changed the standard of care for various solid tumors, including melanoma. These medications are characterized by durable responses; however, they are only achieved in 15%–25% of patients. 1 Data from clinical trials indicate that tumors with significant infiltration of cytotoxic T cells respond to ICI treatment, whereas tumors that do not respond show suppression of T cell infiltration. 2 This suggests that the accumulation of cytotoxic T cells could be a critical determinant of the therapeutic response.
Abnormal amino acid metabolism within the tumor microenvironment affects antitumor immunity and therapeutic efficacy of ICIs. Interleukin‐4 induced 1 (IL4I1), an amino acid oxidase, 3 , 4 , 5 , 6 depletes essential amino acids and produces metabolites that are toxic to cytotoxic T cells. 7 The primary role of IL4I1 in immunoregulation involves depletion of amino acids and promotion of hydrogen peroxide (H2O2) generation. 8 IL4I1 metabolizes phenylalanine as a substrate and activates the aryl hydrocarbon receptor (AhR) through indole metabolites and kynurenic acid. Activated AhR promotes tumor cell motility and suppresses CD8+ T cell proliferation. Therefore, IL4I1 is attracting attention as a novel metabolic immune checkpoint molecule that reprograms the metabolic balance in the tumor microenvironment.
Although IL4I1 is implicated in immune metabolic abnormalities, its potential impact on immune cell types other than T cells and the efficacy of ICI therapy remain unknown. IL4I1 is more highly expressed than other amino acid‐metabolizing enzymes, such as indoleamine 2,3‐dioxygenase (IDO), in patients with various cancers. 9 Increased IL4I1 expression has been observed in resistant patients with advanced melanoma treated with the anti‐PD1 Ab nivolumab. This suggests that IL4I1 expression in cancer cells could influence the therapeutic efficacy of ICIs; however, its functional involvement remain elusive.
Here, we investigated whether IL4I1 confers resistance to ICIs in murine melanomas. We found that IL4I1 acts as a resistance factor against ICI therapy. Comprehensive analysis of immune cells within tumors further revealed a global effect of IL4I1 on the tumor microenvironment.
2. MATERIALS AND METHODS
2.1. Cell culture
The murine melanoma cell line B16‐F10 (CRL‐6475; ATCC) was cultured in RPMI‐1640 medium, supplemented with 10% heat‐inactivated fetal bovine serum (FBS), L‐glutamate, and penicillin–streptomycin. The murine glioma cell line GL261, kindly provided by Dr. Atsushi Natsume at Nagoya University, was cultured in high glucose DMEM supplemented with 10% FBS, L‐glutamate, and penicillin–streptomycin. Experiments were carried out with mycoplasma‐free cells.
2.2. Vector construction and retrovirus‐mediated gene transfer
The human IL4I1 cDNA‐containing plasmid pRP(Exp)‐EGFP/Neo‐CMV > hIL4I1 was obtained from VectorBuilder. The human IL4I1 coding gene or scramble control fragments were subcloned into the pLPCX vector (Addgene). Retroviral infection was carried out as described previously 10 and in Appendix S1.
2.3. Animal experiments
Animal experiments were approved by the Japanese Foundation for Cancer Research, Institutional Animal Care and Use Committee, and were conducted in accordance with the institutional guidelines. Details of the housing and husbandry of the mice have been previously described. 11 Six‐week‐old C57BL/6 female mice (Jackson Laboratory) were subcutaneously injected with 100 μL of a cell solution prepared as 1 × 10⁵ cells in a 1:1 mixture of Hanks’ balanced salt solution and Matrigel (Corning) of the same quantity. When tumors reached an average size of ~90 mm3, animals were randomized into six groups (10 animals/group/experiment in two independent experiments). Mice were treated with intraperitoneal injections of anti‐PD‐L1 Ab (Cat: #BE0101; BioXcell) or IgG2a isotype control (Cat: #BE0089; BioXcell) at 1.5 mg/kg or 5 mg/kg in phosphate‐buffered saline (PBS) twice a week for 2 weeks. The length (L) and width (W) of the tumor mass were measured and the TV was calculated using the following formula: TV = (L × W 2)/2. Procedures for the treatment with clodronate liposomes (CL) were described in Appendix S1. At the end of the experiments, mice were euthanized by cervical dislocation.
2.4. Protein isolation, WB, and l‐amino acid oxidase analyses
Cell lysates were prepared and L‐amino acid oxidase assay was undertaken as described in Appendix S1. Western blot analysis was carried out as described, 10 , 11 using the Abs listed in Table S1.
2.5. Histology and IHC
Tumors were fixed with 10 N Mildform (Wako Pure Chemical), embedded in paraffin, and sliced at 4–5 μm thickness. Immunohistochemistry was carried out as previously described, 10 using the Abs listed in Table S1. Hematoxylin–eosin (HE) and periodic acid‐schiff (PAS) staining were carried out as described. 10 , 12 In the immunohistochemistry (IHC) analysis, the locations of quantified regions on each slide (central or peripheral) were randomly selected. For each mouse, 7 or 10 regions were quantified, and efforts were made to evenly distribute the regions.
2.6. Fluorescence‐activated cell sorting
Fluorescence‐activated cell sorting (FACS) analysis was undertaken with an Ab cocktail (Table S1) as previously described with slight modifications. 13 , 14 Detailed procedures are described in Appendix S1. The gating strategy is shown in Figures S1 and S2. Immune cell fractions were classified according to the definitions given in Figures S1 and S2: lymphocyte, total T cells (T cell), CD4+ T cells, CD8+ T cells, regulatory T cells (Tregs), granulocytic myeloid‐derived auppressor cells, monocytic myeloid‐derived suppressor cells, and M1/2 macrophages. In order to quantify CD45+ cells/mg of tumor, absolute cell numbers were determined using Trucount (BD Biosciences) in conjunction with FACS. The measurement and calculation were carried out as described. 15
2.7. Reverse transcription‐qPCR (RT‐qPCR)
RT‐qPCR was undertaken with primers (Table S2) as described in Appendix S1.
2.8. Small interfering RNA (siRNA) transfection
IL4I1 and AhR knockdown by siRNA oligonucleotides was carried out as previously described, 14 using Lipofectamine reagent RNAiMAX (Invitrogen). Silencer Select Negative Control siRNA (Cat: #4390843; Invitrogen) and siIL4I1 (#1, s66061; #2, s66063) were transfected in accordance with the manufacturer's instructions. Samples were harvested 48 h after transfection and analyzed by RT‐qPCR.
2.9. RNA sequencing (RNA‐Seq) and enrichment analysis
RNAs were extracted using an RNeasy Kit (Qiagen). Construction of the RNA‐seq library and next‐generation sequencing were undertaken by Macrogen Japan. Reads were aligned and quantified by DRAGEN RNA Pipeline 3.6.3 (DRAGEN host software version 05.021.572.3.6.3). Mouse Genome Build GRCm38 with Ensemble gene annotations was used as the reference genome. Differential gene expression was analyzed for all genes hosted in the Illumina Base‐space using DRAGEN Differential Expression 3.6.3. Identified genes were further processed by calculating the log2‐FC between groups. Significant results were selected based on |FC| ≥ 2 and an exactTest raw p value <0.5. To identify pathways enriched in the differentially expressed gene subset, Metascape (https://metascape.org/) was used. Gene expression correlation was analyzed by cBioPortal (https://www.cbioportal.org). A skin cutaneous melanoma cohort from the TCGA database (PanCancer Atlas) was utilized for the analysis. OncoDB is an online database for the study of abnormal patterns of gene expression correlated with clinical features of cancer. 15 The RNA‐seq data were deposited to the DNA Databank of Japan (DDBJ), with links to accession number DRA016420 in the DDBJ BioProject database.
2.10. Statistics and reproducibility
GraphPad Prism 9.0.2 was used to evaluate statistical significance between samples. Data are expressed as means ± Standard error of the mean (SEM) of at least three independent experiments. Statistical significance of differences in mean values between two groups was tested using Student's t test. Analysis of variance (ANOVA) was used to compare the means among three or more groups. For consistency in comparisons, significance is denoted as follows in all figures: *p < 0.05, **p < 0.01, ***p < 0.001, ****p < 0.0001. For all representative findings, triplicate or multiple independent experiments were carried out, and reproducible results were obtained.
3. RESULTS
3.1. Establishment of IL4I1‐overexpressing cells in mouse melanomas
To determine the impact of IL4I1 on tumor responsiveness to ICIs and tumor‐infiltrating immune cells, we established IL4I1‐overexpression in a cancer cell line. We used retrovirus‐mediated gene transduction to overexpress IL4I1 in B16‐F10 cells. The IL4I1‐overexpressing cells showed increased levels of IL4I1 mRNA and protein compared with mock‐infected cells (Figure 1A). Interleukin‐4 inducing 1 catalyzes the oxidation of aromatic amino acids to produce H2O2. Therefore, we undertook H2O2 assays to measure IL4I1 activity. The IL4I1‐overexpressing cells showed higher phenylalanine‐oxidizing activity than the mock‐infected cells (Figure 1B). Because IL4I1 expression was significantly higher in melanomas from patients than in normal tissues (Figure S3), we considered that IL4I1‐overexpressing cells could be relevant to the tumor environment of clinical samples.
FIGURE 1.
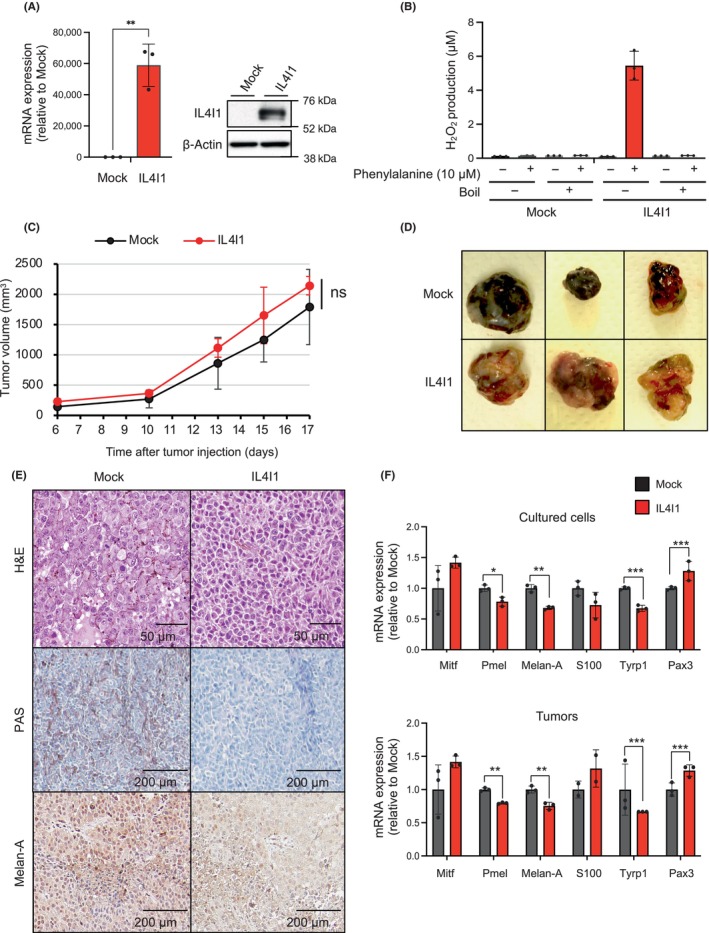
Establishment of interleukin‐4 induced 1 (IL4I1)‐overexpressing B16‐F10 melanoma cells with dedifferentiation status in vivo. (A) Reverse transcription‐quantitative PCR (RT‐qPCR) (left) and western blot analysis (right) of IL4I1 in B16‐F10 cells infected with IL4I1‐expressing retrovirus or empty vector (mock), using GAPDH and β‐actin as internal controls, respectively (n = 3). (B) H2O2 assays of IL4I1 L‐amino acid oxidase activity (n = 3 independent assays). (C) Relative volumes of tumors derived from mock‐infected or IL4I1‐overexpressing B16‐F10 cells subcutaneously inoculated in C57BL/6J mice. (D, E) Representative images of (D) allografted tumors and (E) tissue sections stained with H&E or periodic acid–Schiff, or subjected to immunohistochemistry. Scale bars, 50 μm or 200 μm. Tumors were harvested 13 days after transplantation. (F) RT‐qPCR of mRNA expression of the indicated melanocyte differentiation markers in cultured cells (upper) and tumors (bottom) (n = 3). (A, F) Data expressed as means ± SEM and analyzed by a two‐tailed unpaired Student's t‐test. Data are representative of (D, E) two or (A, B, C, F) three independent experiments. Cell establishment was carried out independently and validated in at least in two experiments. *p < 0.05, **p < 0.01, ***p < 0.001.
Next, IL4I1‐overexpressing or mock‐infected control cells were subcutaneously injected into C57BL/6J mice. IL4I1 overexpression had no effect on tumor growth (Figure 1C). While malignant melanoma tumors derived from control (mock‐infected) cells were black, those derived from IL4I1‐overexpressing cells lost melanin pigment (Figure 1D). HE staining showed that mock‐infected cells were characterized by round nuclei with prominent nucleoli and abundant cytoplasm, whereas IL4I1‐overexpressing cells were spindle‐shaped, with hyperchromatic nuclei and scant cytoplasm (Figure 1E, upper). PAS staining clearly showed melanin deposition in mock‐infected cells, but not in IL4I1‐overexpressing cells (Figure 1E, middle). Immunohistochemistry revealed decreased Melan‐A expression in IL4I1‐overexpressing tumors compared with that in control tumors (Figure 1E, lower). RT‐qPCR analysis indicated that the expression of several melanocyte differentiation markers, including Pmel, Melan‐A, and Tyrp1, were lower in IL4I1‐overexpressing cells than in mock‐infected cells (Figure 1F). To elucidate whether differentiation induction mediated by IL4I1 is observed across multiple cell lines, we also established the IL4I1‐overexpressing GL261 glioma cell line. As a result, we observed an increase in the expression of genes associated with glioma stem cell markers in IL4I1‐overexpressing GL261 cells (Figure S4). These results suggested that IL4I1 induces dedifferentiated states in some cancer.
3.2. Reduced infiltration of CD8+ T cells in IL4I1‐overexpressing tumors
Although IL4I1 is a newly discovered metabolic immune checkpoint molecule, it remains unknown how wide IL4I1 overexpression might reprogram the intratumoral immune microenvironment. Therefore, we comprehensively analyzed whether IL4I1‐overexpressing tumor cells orchestrate immune cells. Immunohistochemistry showed a significant reduction in CD8+ T‐cells in IL4I1‐overexpressing tumors (Figure 2A,B). Consistently, RT‐qPCR showed a decrease in CD8 mRNA in IL4I1‐overexpressing tumors (Figure 2C). We harvested tumor‐infiltrating lymphocytes (TILs) from control tumors and IL4I1‐overexpressing tumors, subjecting them to FACS analysis. In this analysis, we normalized the values as CD45+ cells per milligram of tumor. As a result, we confirmed that IL4I1 overexpression significantly reduced the infiltration of CD8+ T cells in line with the IHC results, while the infiltration of CD4+ T cells remained unchanged (Figure 2D). Overexpression of IL4I1 had no impact on the compartments of Δ3+19+ and B cells (Figure 2E). The presence of Treg subsets in the tumor was identified; however, their abundance was not high (Figure S1). Consistent with a previous finding that identified low expression of FoxP3 in B16‐F10 tumors, 16 our data suggest the low‐level infiltration of Tregs in this specific tumor model. These observations indicate that IL4I1 overexpression controls T cell infiltration, specifically suppressing the infiltration of CD8+ T‐cells.
FIGURE 2.
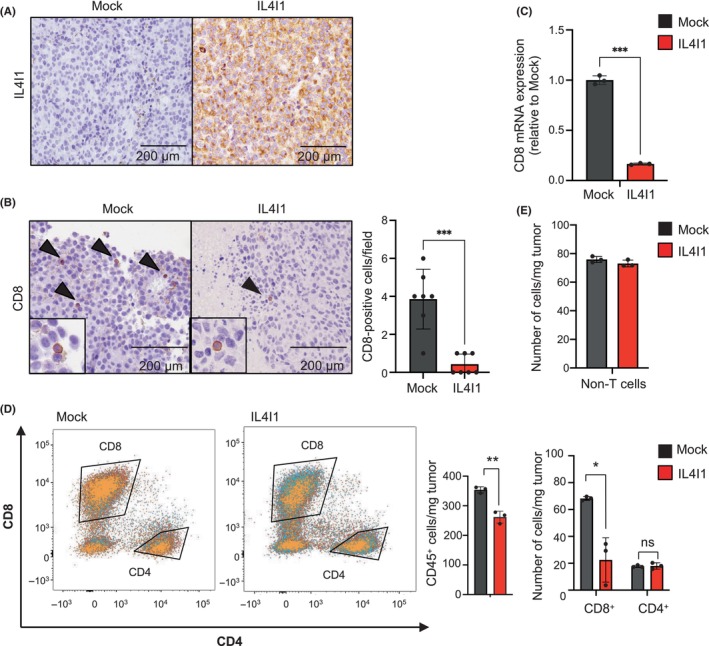
IL4I1‐overexpressing tumors restrict CD8+ T cell infiltration. (A, B) Immunohistochemistry of tumor sections demonstrating expression of IL4I1 (a; brown) and CD8 (b; arrowheads). All panels are at the same magnification. Scale bar, 200 μm. Tumors were harvested 17 days after transplantation. The graph at the right shows mean numbers of CD8+ cells per field (original magnification, 100×) within seven different areas for each tissue sample. (C) RT‐quantitative PCR of CD8 mRNA expression in tumors (n = 3). (D) Quantitation of CD8+/CD4+ T cells. Center and right graphs indicate absolute CD45+ cells/mg tumor and calculation of CD8+/CD4+ T cells per weight of the tumor, respectively. Values were normalized based on the absolute measurement of CD45+ cells/mg tumor. (E) Quantitation of non‐T cells (ΔCD3+) in tumors per weight of the tumor derived from mock‐infected and IL4I1‐overexpressing B16‐F10 cells using flow cytometry analysis (n = 3 mice per group). Values were normalized based on the absolute measurement of CD45+ cells/mg tumor. Data shown are representative of (A, B, D, E) two or (C) three independent experiments, with three mice per group, expressed as means ± SEM and analyzed by a two‐tailed Student's t‐test (B–E). *p < 0.05, **p < 0.01, ***p < 0.001.
3.3. Cells overexpressing IL4I1 render melanoma tumors resistant to anti‐PD‐L1 treatment
To examine the impact of IL4I1 overexpression on ICI's efficacy, we compared the response to anti‐PD‐L1 treatment between IL4I1‐overexpressing and control tumors (Figure 3A). Intraperitoneal administration of an anti‐PD‐L1 Ab significantly reduced control tumor growth at both 1.5 and 5 mg/kg concentrations (Figures 3B,C and S5). In contrast, in IL4I1‐overexpressing tumors, neither concentration of the anti‐PD‐L1 Ab significantly inhibited tumor growth. Importantly, among the mice treated with 5 mg/kg of anti‐PD‐L1 Ab, those with control tumors showed a significant increase in survival compared to those with IL4I1‐overexpressing tumors (Figure 3D). Because PD‐L1 expression is one of the predictive biomarkers of ICI's efficacy and anti‐PD‐L1 Abs have Ab‐dependent cellular cytotoxicity activity in mice, 16 we quantified PD‐L1 expression levels on melanoma cells. As shown in Figure 3E, IL4I1 overexpression did not affect PD‐L1 protein expression in B16‐F10 cells. These results indicate that IL4I1 overexpression confers tumor resistance to ICI treatment.
FIGURE 3.
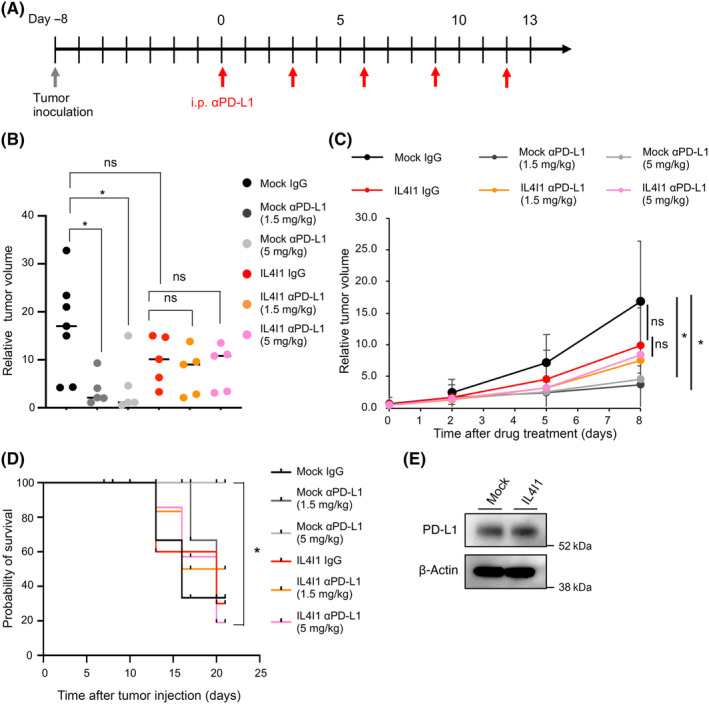
IL4I1 is sufficient to render B16‐F10 cells resistant to an anti‐programmed death‐ligand 1 (αPD‐L1). (A) Treatment schedule of C57BL/6J mice receiving inoculation of mock‐infected or IL4I1‐overexpressing B16‐F10 tumor cells followed by interperitoneal (i.p.) injections of IgG control (n = 7) or αPD‐L1 (1.5 or 5 mg/kg, n = 5 per group); satellite groups for interim analyses (n = 3). (B) Relative tumor volume at day 8 of Ab treatment in individual animals. Lines indicate median values. (C) Relative tumor volume curves (mean). (D) Kaplan–Meier curves for the six treatment groups; p values calculated from a log‐rank test for survival curve comparison. Cut‐off point for survival curves was 1500 mm3 of tumor volume. (E) Western blot analysis of PD‐L1 in B16‐F10 cells infected with IL4I1‐expressing retrovirus or empty vector (mock) (n = 3). Data expressed as means ± SEM and analyzed by one‐way ANOVA with Tukey's multiple comparisons (B) and Student's t test (C). *p < 0.05. ns, not statistically significant.
3.4. Overexpression of IL4I1 restricts CD8+ T cell accumulation in tumors
To decipher how IL4I1 alters the immune microenvironment to induce ICI resistance, we used FACS to study lymphoid subsets in tumors of mice treated with immunogloblin G (IgG) control or anti‐PD‐L1 Ab. Anti‐PD‐L1 Ab increased CD8+ T cell infiltration in control tumors in a concentration‐dependent manner (Figure 4A,B). Compared with the control group, the IL4I1‐overexpressing group showed lower numbers of CD8+ T cells in tumor tissue, as assessed by IHC and RT‐qPCR, although there was no statistical significance in the number of CD8+ T cells between the two groups treated with 5 mg/kg anti‐PD‐L1 Ab (Figure 4A,B). Consistently, in IL4I1‐overexpressing tumors, infiltration of CD8+ T cells was suppressed compared to that in control tumors treated with the control IgG Ab (Figure 4C). Furthermore, IL4I1‐overexpressing tumors treated with an equivalent dosage of anti‐PD‐L1 Ab significantly reduced CD8+ T cell infiltration compared with the control tumors treated with anti‐PD‐L1 Ab (Figure 4C). In contrast, the numbers and proportions of tumor‐infiltrating CD4+ T cells, B cells, and Δ3+19+ cells were not significantly altered by anti‐PD‐L1 Ab in either the control or IL4I1‐overexpressing tumors (Figure 4D).
FIGURE 4.
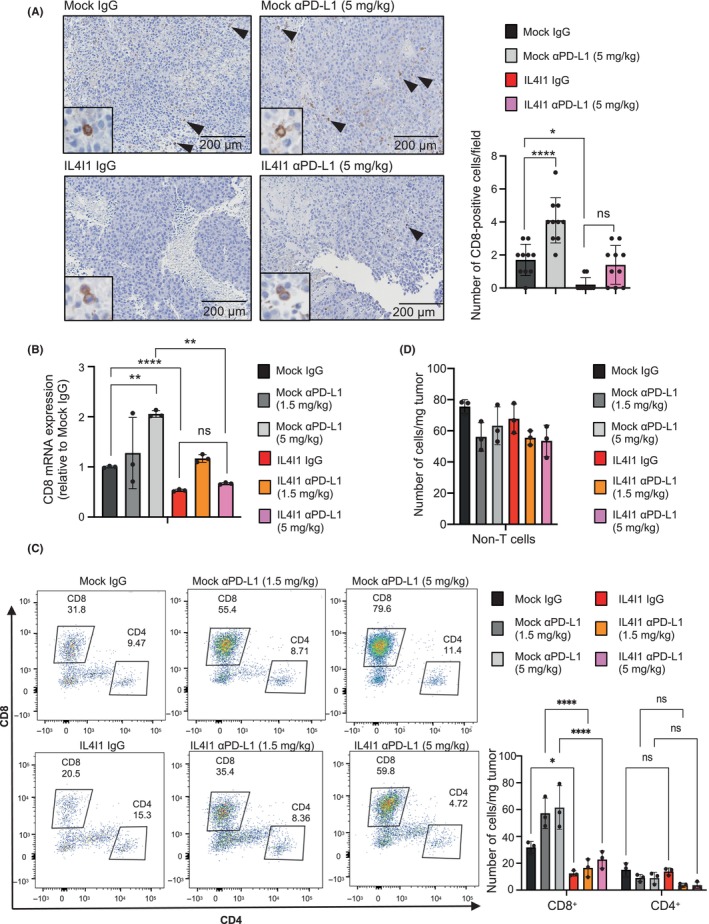
CD8+ T cell infiltration is inhibited in IL4I1‐overexpressing B16‐F10‐derived tumors. (A) CD8 immunohistochemistry in tumors collected 7 days after treatment. Scale bar, 200 μm. Arrowheads indicate CD8+ T cells. The graph shows mean numbers of CD8+ cells per field (original magnification, 100×) within 10 different areas for each tissue sample. (B) RT‐qPCR measurement of CD8 expression. (C, D) Quantitation of (C) CD8+/CD4+ T cells per weight of the tumor and (D) non‐T (ΔCD3+) cells per weight of the tumor treated with two different anti‐programmed death‐ligand 1 (αPD‐L1) concentrations using flow cytometry analysis (n = 3 mice per group). Values were normalized based on the absolute measurement of CD45+ cells/mg tumor. Data are representative of three independent experiments (A, C, D; n = 3 mice per group), expressed as means ± SEM, and analyzed by one‐way ANOVA with Tukey's multiple comparisons (A–D). *p < 0.05, **p < 0.01, ****p < 0.001. ns, not statistically significant.
This modification of the immune microenvironment, specifically the decrease in CD8+ T cells, could be responsible for tumor escape from immune surveillance and observed resistance to ICI treatment.
3.5. Tumors overexpressing IL4I1 upregulate immunosuppressive signature genes
To further investigate the role of IL4I1 in ICI resistance, we examined the relationship between IL4I1 and the AhR pathway genes. When IL4I1 was knocked down by siRNAs, none of the representative AhR target genes 9 , 17 decreased, except for Cyp1b1 (Figure S6A). Although AhR protein expression was detected in the B16‐F10 cell line, the protein level was not increased by the overexpression of IL4I1 (Figure S6B). Also, the expression levels of AhR target genes were not altered by IL4I1 overexpression (Figure S6C,D). Moreover, TCGA PanCancer analysis showed no association between AhR and IL4I1 mRNA expression in clinical samples of human skin cutaneous melanoma (Figure S6E). These observations suggest that the AhR pathway might not be the main downstream pathway targeted by IL4I1, at least in B16‐F10 cells.
To determine whether a genome‐wide change in cell signaling pathways occurred within IL4I1‐overexpressing tumors, a transcriptome analysis was undertaken. Overall, functional enrichment analysis by Metascape 18 revealed that the strongest differences, indicative of significant alterations in gene expression, were between control tumors and IL4I1‐overexpressing tumors, both treated with 5 mg/kg anti‐PD‐L1 Ab (Figure 5A). The identified gene ontology (GO) terms indicated that ICI‐treated IL4I1‐overexpressing tumors showed upregulation of immunosuppressive genes compared with ICI‐treated control tumors. These differences in gene expression were not observed in the IgG control treatment groups, suggesting that immunosuppressive gene expression was induced by the ICI treatment. STRING gene network analysis 19 revealed that among these GO terms, the immunosuppressive genes Wnt5a, Smad7, IDO1, and Arg1/2 were enriched in ICI‐treated IL4I1‐overexpressing tumors (Figure 5B). These observations suggested that an intratumor immunosuppressive environment was formed in IL4I1‐overexpressing tumor tissues.
FIGURE 5.
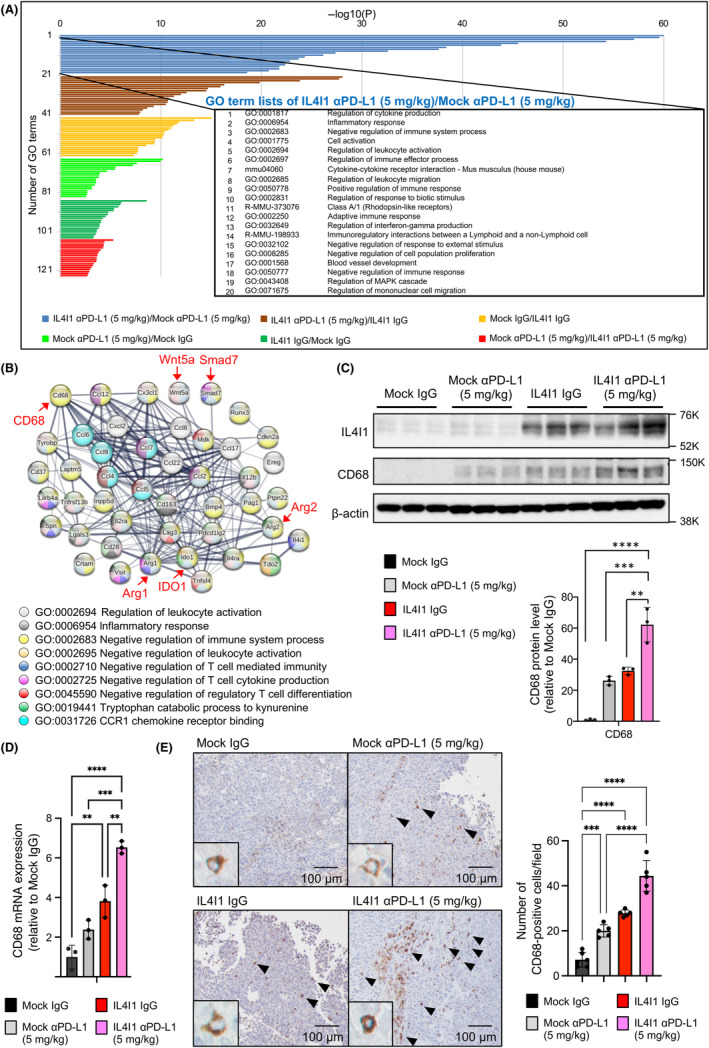
IL4I1‐overexpressing B16‐F10‐derived tumors constitute an immunosuppressive microenvironment. (A) Functional gene enrichment analysis by Metascape (cut‐offs: fold change >2.0 and p < 0.05) illustrated as a bar chart showing enriched ontology categories (GO and Kyoto Encyclopedia of Genes and Genomes [KEGG] terms) clustered by p values. (B) Gene interaction diagram by STRING gene network analysis. Genes were selected by GO terms’ top 10 lists of IL4I1‐overexpressing tumors treated with αPD‐L1 (5 mg/kg)/Mock tumors treated with αPD‐L1 (5 mg/kg). Genes mentioned in the text are highlighted in red for emphasis. (C) Western blot analysis (left) and ImageJ protein quantification (right) of tumors collected 7 days after Ab treatment (n = 3). Data expressed as means ± SEM and analyzed by one‐way ANOVA with Tukey's multiple comparisons. (D) mRNA levels of CD68 in mock‐infected and IL4I1‐overexpressing B16‐F10‐derived tumors in mice, using GAPDH as the internal control. (E) Immunohistochemistry of CD68 in tumors collected 7 days after Ab treatment. Panels show representative images among five different areas examined for each sample. The graph shows mean numbers of CD68+ cells per field (original magnification, 100×) within five different areas for each tissue sample. Scale bars, 50 μm or 100 μm. All panels are the same magnification. Data shown are representative of (C, D) three independent experiments. *p < 0.05, **p < 0.01, ***p < 0.001, ****p < 0.0001.
Among the enriched ontology‐categorized genes identified here, we focused on CD68. CD68 is a marker of tumor‐associated macrophages (TAMs), which are involved in tumor promotion and immunosuppression, and is correlated with an adverse prognosis in various cancer types. 20 IL4I1‐overexpressing tumors expressed higher levels of CD68 proteins than control tumors (Figure 5C). Under ICI treatment, IL4I1‐overexpressing tumors showed the highest CD68 protein expression. CD68 upregulation in IL4I1‐overexpressing tumors was also observed using RT‐qPCR and IHC (Figure 5D,E). To further investigate the mechanism by which IL4I1 regulates the infiltration of these immune cells, we evaluated gene expression levels of representative chemokines that recruit macrophages in IL4I1‐overexpressing tumor tissues. RT‐qPCR analysis indicated that the expression of CCL2 and CCL10 were markedly upregulated in IL4I1‐overexpressing tumors treated with anti‐PD‐L1 Ab (Figure 6A). To explore the functional involvement of macrophages on tumor growth and IL4I1‐mediated resistance to anti‐PD‐L1 Ab therapy, we used clodronate liposomes (CL), which efficiently depleted CD68+ TAMs in vivo (Figure 6B,C). Intriguingly, CL per se reduced the growth of both control and IL4I1‐overexpressing tumors (Figure 6D). Anti‐PD‐L1 therapy under these conditions revealed no additive effects on tumor growth. Although no significant difference was observed, a trend of increased CD8+ T cells was observed in the CL and anti‐PD‐L1 Ab‐treated group compared to the untreated group (Figure 6E). These observations suggest that treatment with anti‐PD‐L1 Abs in IL4I1‐overexpressing tumors could cause a TAM‐related immunosuppressive tumor microenvironment.
FIGURE 6.
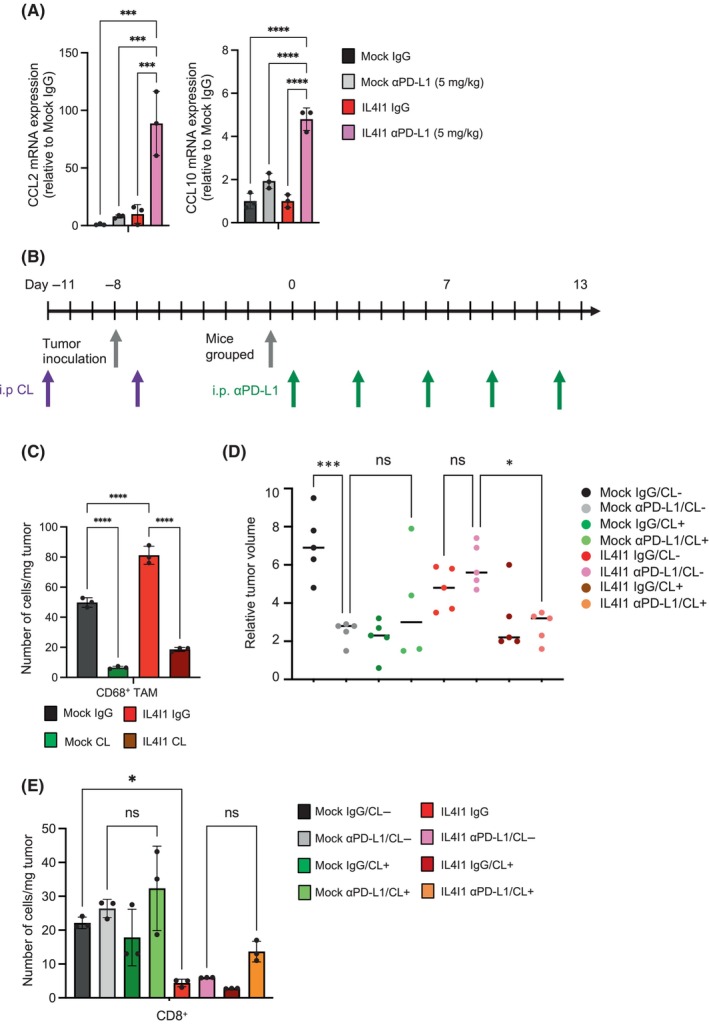
Removal of tumor‐associated macrophages (TAMs) by clodronate liposome (CL) cancels anti‐PD‐L1 Ab resistance in IL4I1‐overexpressing tumors. (A) RT‐qPCR measurement of CCL2 and CCL10 expression. (B) Treatment schedule. The CL‐treated group received the first CL administration before cell transplantation. Following grouping into CL administration (12.5 mg/kg) and control liposome groups, mice were transplanted with Mock or IL4I1‐overexpressing B16‐F10 tumor cells. Subsequently, the groups were divided into anti‐PD‐L1 Ab treatment (5 mg/kg) and IgG control groups. Tumor measurements were taken over time for a total of eight groups (n = 5). (C) Quantitation of CD68+ TAMs per weight of the tumor treated with CL (12.5 mg/kg) or control liposome using flow cytometry analysis at day 0 in (B) (n = 3 mice per group). (D) Dot plot showing the differences in tumor volume at day 6 of anti‐PD‐L1 Ab treatment in individual animals. Lines indicate median values. (E) Quantitation of CD8+ T cells per weight of the tumor using flow cytometry analysis at day 13 in (B) (n = 3 mice per group). Data are expressed as means ± SEM, and analyzed by one‐way ANOVA with Tukey's multiple comparisons (A, C–E). *p < 0.05, **p < 0.01, ***p < 0.001, ****p < 0.0001. ns, not statistically significant.
4. DISCUSSION
Elevated IL4I1 expression has been previously observed in patients with melanoma treated with an anti‐PD1 Ab, nivolumab. 9 Here, we have found that IL4I1 overexpression renders melanoma tumors resistant to ICI in a mouse allograft model. Mechanistically, IL4I1 suppressed CD8+ T cell infiltration and upregulated immunosuppressive signature genes in the tumors.
As one of the predictive biomarkers for ICI efficacy, tumor mutation burden is associated with drug response and patient's survival. However, this association is limited to a subset of patients. 1 Our present findings suggest that IL4I1 and its target genes can be used as predictive biomarkers for ICIs. A loss‐of‐function study using cancer cells that express high levels of endogenous IL4I1 could be useful to examine whether functional blockade of IL4I1 can cancel the ICI resistance. We undertook a preliminary study to compare endogenous IL4I1 expression in various mouse cancer cell lines (colorectal, glioma, and breast cancer). However, the expression levels of IL4I1 protein were too low to detect by WB (unpubl. data).
Both IDO and tryptophan 2,3‐dioxygenase (TDO) are amino acid‐metabolizing enzymes involved in ICI resistance. 9 A previous report showed that nivolumab induces IL4I1 and IDO1 expression in advanced melanoma. 9 In contrast, our RNA‐seq analysis showed that the expression levels of IDO and TDO, and those of downstream target genes of AhR, were not altered by the knockdown of IL4I1 or AhR, or by IL4I1 overexpression, with the exception of Cyp1b1 21 (Figure S6). These results suggest that the IDO, TDO, and AhR pathways might not be the primary pathways through which IL4I1‐dependent ICI resistance occurs in our mouse model.
It is unclear whether the involvement of IL4I1 in ICI resistance is limited to melanoma or could be applied to other cancer types. Because IL4I1 downregulation in gliomas is concomitant with decreased expression of IDO1, TDO2, and AhR, 9 it is possible that the mechanisms of ICI resistance vary among tumors.
We found that either IL4I1 overexpression or anti‐PD‐L1 Ab upregulates CD68 expression in the B16‐F10‐derived tumors. STRING gene network analysis revealed that immunosuppressive genes, Wnt5a, Smad7, IDO1 and Arg1/2, were enriched in ICI‐treated IL4I1‐overexpressing tumors (Figure 5B). Melanoma express Wnt5a within the tumor microenvironment and promote immune evasion. 22 Transforming growth factor‐β‐Smad7 promotes an immunosuppressive tumor microenvironment and provides a bypass mechanism to ICI. 23 IDO1/2 and arginases are known as ICI resistance factors, which inhibit T cell proliferation and differentiation. 24 CD68 is associated with TAMs, and the abundance of CD68+ TAMs in tumor nests is associated with poor prognosis of cutaneous melanoma. 25 Also, we found that CCL2 and CCL10 were significantly upregulated in IL4I1‐overexpressing tumors treated with anti‐PD‐L1 Ab. This suggest that increased expression of these chemokines could contribute to the induction of TAMs. Further studies will be required to determine whether CD68+ TAMs contribute to IL4I1‐mediated resistance to ICIs.
We also found that IL4I1 overexpression led to a dedifferentiated‐like state in B16‐F10 cells and the loss of melanin pigment in vivo (Figure 1). In IL4I1‐overexpressing GL261 glioblastoma cells, we observed increased expression of glioma stem cell markers and markers associated with malignancy, highlighting that IL4I1 overexpression might contribute to an increase in dedifferentiation and stem cell gene expression (Figure S4). Melanoma without melanin pigment is known as AMM and has a poor prognosis due to delayed diagnosis. 26 Together with increased mitotic cells and cytoplasmic regression as reported indicators of malignant melanoma, 27 IL4I1 overexpression could represent a pathological snapshot of increased malignancy. In a series of patients with stage I–III primary cutaneous melanoma, IL4I1‐positive tumors were associated with rapid relapse and shorter overall survival. 28 Thus, IL4I1 expression could be used as a diagnostic biomarker for amelanotic malignant melanoma (AMM) in clinical practice. 26 Melan‐A is expressed in differentiated melanocytes and is a diagnostic marker of melanoma. Melan‐A is also an antigen recognized by T cells, 29 which provides therapeutic relevance as a target for immunotherapy. Melan‐A‐reactive circulating T cells have a strong independent prognostic impact on survival in a study of advanced melanoma. 29 Based on these findings, our results suggest that the decrease in Melan‐A under IL4I1 overexpression (Figure 1) prevents T cells from recognizing the antigen, resulting in reduced T cell infiltration. Further studies are needed to confirm whether IL4I1‐induced white melanomas have an undifferentiated state, possibly through the detection of undifferentiated markers, such as SSEA‐1, Nanog, and Oct3/4. 27
Previous studies have shown that IL4I1 is mainly produced by infiltrating leukocytes, such as macrophages, 30 and ICI upregulates IL4I1 expression. 9 We used a mouse melanoma cell line to upregulate IL4I1 expression. The limitations of the current study include the possibility that it does not reflect the physiological role of IL4I1, as this would artificially distort the steps of increased IL4I1 expression by immunosuppressive leukocytes. In a previous study, elevated IL4I1 levels were observed in ICI‐treated melanoma patients using the tissues from tumor biopsies. 31 However, the study did not specify whether the IL4I1‐expressing cells were macrophages or cancer cells, a distinction crucial for understanding the role for each cell type in IL4I1 upregulation and its implication for ICI treatment.
In conclusion, we provide new findings on Il4I1‐mediated suppression of CD8+ T cell infiltration into tumors and resistance to ICI in a melanoma mouse model. Our observations indicated that IL4I1 is an immunosuppressive factor that confers ICI resistance in melanoma.
AUTHOR CONTRIBUTIONS
Shiho Hirose: Conceptualization; formal analysis; investigation; methodology; software; validation; visualization; writing – original draft; writing – review and editing. Tetsuo Mashima: Conceptualization; formal analysis; methodology; project administration; supervision; validation; visualization; writing – original draft; writing – review and editing. Xunmei Yuan: Investigation; validation; writing – review and editing. Makiko Yamashita: Investigation; methodology; software; validation; writing – review and editing. Shigehisa Kitano: Methodology; resources; writing – review and editing. Shinichi Torii: Conceptualization; methodology; resources; writing – review and editing. Toshiro Migita: Investigation; resources; validation; writing – review and editing. Hiroyuki Seimiya: Conceptualization; data curation; formal analysis; funding acquisition; project administration; resources; supervision; validation; visualization; writing – original draft; writing – review and editing.
FUNDING INFORMATION
This work was supported in part by research grants from the Nippon Foundation and Takeda Science Foundation to H.S.
CONFLICT OF INTEREST STATEMENT
H.S. received research grants from the Nippon Foundation and Takeda Science Foundation, and is Associate Editor of Cancer Science. S.T. is the Chief Executive Officer and President of Vermilion Therapeutics, Inc. The other authors have no conflict of interest to declare.
ETHICS STATEMENT
Approval of the research protocol by an institutional review board: N/A. This study was conducted in accordance with the principles of the Declaration of Helsinki.
Informed consent: N/A.
Registry and the registration no. of the study/trial: N/A
Animal studies: All animal experiments and animal care procedures were approved by the JFCR Animal Care and Use Committee, following national laws and policies (Guidelines for Proper Conduct of Animal Experiments, Science Council of Japan, 2006). The procedures were performed in the animal experiment room at the JFCR using protocols approved by the JFCR Animal Care and Use Committee.
Supporting information
Appendix S1
Figure S1
Table S1
ACKNOWLEDGMENTS
We thank Dr. Satoshi Takagi for technical advice on mouse experiments and the members of our laboratory for helpful discussions. We thank Dr. Atsushi Natsume at Nagoya University for the GL261 cell line.
Hirose S, Mashima T, Yuan X, et al. Interleukin‐4 induced 1‐mediated resistance to an immune checkpoint inhibitor through suppression of CD8 + T cell infiltration in melanoma. Cancer Sci. 2024;115:791‐803. doi: 10.1111/cas.16073
DATA AVAILABILITY STATEMENT
The RNA sequence data have been deposited in the DDBJ and are accessible through accession number PRJDB15826. Other data generated or analyzed during the study are available from the corresponding author on reasonable request.
REFERENCES
- 1. Johnson DB, Nebhan CA, Moslehi JJ, Balko JM. Immune‐checkpoint inhibitors: long‐term implications of toxicity. Nat Rev Clin Oncol. 2022;19:254‐267. [DOI] [PMC free article] [PubMed] [Google Scholar]
- 2. Castellano F, Frenkel VM. IL4I1: an emerging target to reinvigorate antitumor immune responses. Immunotherapy Open Access. 2017;3:1‐4. [Google Scholar]
- 3. Torii S, Yamane K, Mashima T, et al. Molecular cloning and functional analysis of apoxin I, a snake venom‐ derived apoptosis‐inducing factor with L‐amino acid oxidase activity. Biochemistry. 2000;39:3197‐3205. [DOI] [PubMed] [Google Scholar]
- 4. Mason JM, Naidu MD, Barcia M, Porti D, Chavan SS, Chu CC. IL‐4‐induced Gene‐1 is a leukocyte l ‐amino acid oxidase with an unusual acidic pH preference and lysosomal localization. J Immunol. 2004;173:4561‐4567. [DOI] [PubMed] [Google Scholar]
- 5. Chu CC, Paul WE. Fig1, an interleukin 4‐induced mouse B cell gene isolated by cDNA representational difference analysis [Internet]. 1997. 2507–2512. Available from: www.pnas.org [DOI] [PMC free article] [PubMed]
- 6. Torii S, Naito M, Tsuruo T, Apoxin I. A novel apoptosis‐inducing factor with L‐amino acid oxidase activity purified from western diamondback rattlesnake venom. J Biol Chem. 1997;272:9539‐9542. [DOI] [PubMed] [Google Scholar]
- 7. Castellano F, Correale J, Molinier‐Frenkel V. Editorial: immunosuppressive amino acid catabolizing enzymes in Heallth and disease. Front Immunol. 2021;12:689864. [DOI] [PMC free article] [PubMed] [Google Scholar]
- 8. Castellano F, Molinier‐Frenkel V. An overview of L‐amino acid oxidase functions from bacteria to mammals: focus on the immunoregulatory phenylalanine oxidase IL4I1. Molecules. 2017;22:2151. [DOI] [PMC free article] [PubMed] [Google Scholar]
- 9. Sadik A, Somarribas Patterson LF, Öztürk S, et al. IL4I1 is a metabolic immune checkpoint that activates the AHR and promotes tumor progression. Cell. 2020;182:1252‐1270.e34. [DOI] [PubMed] [Google Scholar]
- 10. Hirashima K, Migita T, Sato S, Muramatsu Y, Ishikawa Y, Seimiya H. Telomere length influences cancer cell differentiation in vivo. Mol Cell Biol. 2013;33:2988‐2995. [DOI] [PMC free article] [PubMed] [Google Scholar]
- 11. Mashima T, Iwasaki R, Kawata N, et al. In silico chemical screening identifies epidermal growth factor receptor as a therapeutic target of drug‐tolerant CD44v9‐positive gastric cancer cells. Br J Cancer. 2019;121:846‐856. [DOI] [PMC free article] [PubMed] [Google Scholar]
- 12. Mashima T, Wakatsuki T, Kawata N, et al. Neutralization of the induced VEGF‐A potentiates the therapeutic effect of an anti‐VEGFR2 antibody on gastric cancer in vivo. Sci Rep. 2021;11:15125. [DOI] [PMC free article] [PubMed] [Google Scholar]
- 13. Hanamura T, Kitano S, Kagamu H, et al. Immunological profiles of the breast cancer microenvironment represented by tumor‐infiltrating lymphocytes and PD‐L1 expression. Sci Rep. 2022;12:8098. [DOI] [PMC free article] [PubMed] [Google Scholar]
- 14. Matsumoto K, Okamoto K, Okabe S, et al. G‐quadruplex‐forming nucleic acids interact with splicing factor 3B subunit 2 and suppress innate immune gene expression. Genes Cells. 2021;26:65‐82. [DOI] [PMC free article] [PubMed] [Google Scholar]
- 15. Tang G, Cho M, Wang X. OncoDB: an interactive online database for analysis of gene expression and viral infection in cancer. Nucleic Acids Res. 2022;50:D1334‐D1339. [DOI] [PMC free article] [PubMed] [Google Scholar]
- 16. Ahn JH, Lee BH, Kim SE, et al. A novel anti‐pd‐l1 antibody exhibits antitumor effects on multiple myeloma in murine models via antibody‐dependent cellular cytotoxicity. Biomol Ther (Seoul). 2021;29:166‐174. [DOI] [PMC free article] [PubMed] [Google Scholar]
- 17. Zhu K, Meng Q, Zhang Z, et al. Aryl hydrocarbon receptor pathway: role, regulation and intervention in atherosclerosis therapy (review). Mol Med Rep. 2019;20:4763‐4773. [DOI] [PMC free article] [PubMed] [Google Scholar]
- 18. Zhou Y, Zhou B, Pache L, et al. Metascape provides a biologist‐oriented resource for the analysis of systems‐level datasets. Nat Commun. 2019;10:1523. [DOI] [PMC free article] [PubMed] [Google Scholar]
- 19. von Mering C, Huynen M, Jaeggi D, Schmidt S, Bork P, Snel B. STRING: a database of predicted functional associations between proteins. Nucleic Acids Res. 2003;31:258‐261. [DOI] [PMC free article] [PubMed] [Google Scholar]
- 20. Zhang J, Li S, Liu F, Yang K. Role of CD68 in tumor immunity and prognosis prediction in pan‐cancer. Sci Rep. 2022;12:12. [DOI] [PMC free article] [PubMed] [Google Scholar]
- 21. Kwon YJ, Baek HS, Ye DJ, Shin S, Kim D, Chun YJ. CYP1B1 enhances cell proliferation and metastasis through induction of EMT and activation of Wnt/β‐catenin signaling via Sp1 upregulation. PLoS One. 2016;11:e0151598. [DOI] [PMC free article] [PubMed] [Google Scholar]
- 22. Zhao F, Xiao C, Evans KS, et al. Paracrine Wnt5a‐β‐catenin signaling triggers a metabolic program that drives dendritic cell tolerization. Immunity. 2018;48:147‐160.e7. [DOI] [PMC free article] [PubMed] [Google Scholar]
- 23. Mortezaee K, Majidpoor J. Transforming growth factor‐β signalling in tumour resistance to the anti‐PD‐(L)1 therapy: updated. J Cell Mol Med. 2023;27:311‐321. [DOI] [PMC free article] [PubMed] [Google Scholar]
- 24. Horvath L, Thienpont B, Zhao L, Wolf D, Pircher A. Overcoming immunotherapy resistance in non‐small cell lung cancer (NSCLC) – novel approaches and future outlook. Mol Cancer. 2020;19:141. [DOI] [PMC free article] [PubMed] [Google Scholar]
- 25. Salmi S, Siiskonen H, Sironen R, et al. The number and localization of CD68+ and CD163+ macrophages in different stages of cutaneous melanoma. Melanoma Res. 2019;29:237‐247. [DOI] [PMC free article] [PubMed] [Google Scholar]
- 26. Ohnishi Y, Watanabe M, Fujii T, et al. A rare case of amelanotic malignant melanoma in the oral region: clinical investigation and immunohistochemical study. Oncol Lett. 2015;10:3761‐3764. [DOI] [PMC free article] [PubMed] [Google Scholar]
- 27. Belote RL, Le D, Maynard A, et al. Human melanocyte development and melanoma dedifferentiation at single‐cell resolution. Nat Cell Biol. 2021;23:1035‐1047. [DOI] [PubMed] [Google Scholar]
- 28. Ramspott JP, Bekkat F, Bod L, et al. Emerging role of IL‐4–induced gene 1 as a prognostic biomarker affecting the local T‐cell response in human cutaneous melanoma. J Investig Dermatol. 2018;138:2625‐2634. [DOI] [PubMed] [Google Scholar]
- 29. Weide B, Zelba H, Derhovanessian E, et al. Functional T cells targeting NY‐ESO‐1 or Melan‐a are predictive for survival of patients with distant melanoma metastasis. J Clin Oncol. 2012;30:1835‐1841. [DOI] [PubMed] [Google Scholar]
- 30. Yue Y, Huang W, Liang J, et al. IL4I1 is a novel regulator of M2 macrophage polarization that can inhibit t cell activation via L‐tryptophan and arginine depletion and IL‐10 production. PLoS One. 2015;10:e0142979. [DOI] [PMC free article] [PubMed] [Google Scholar]
- 31. Riaz N, Havel JJ, Makarov V, et al. Tumor and microenvironment evolution during immunotherapy with Nivolumab. Cell. 2017;171:934‐949.e15. [DOI] [PMC free article] [PubMed] [Google Scholar]
Associated Data
This section collects any data citations, data availability statements, or supplementary materials included in this article.
Supplementary Materials
Appendix S1
Figure S1
Table S1
Data Availability Statement
The RNA sequence data have been deposited in the DDBJ and are accessible through accession number PRJDB15826. Other data generated or analyzed during the study are available from the corresponding author on reasonable request.


