

Abstract
Background
The study explores whether frailty at midlife predicts mortality and levels of biomarkers associated with Alzheimer’s disease and related dementias (ADRD) and neurodegeneration by early old age. We also examine the heritability of frailty across this age period.
Methods
Participants were 1,286 community-dwelling men from the Vietnam Era Twin Study of Aging at average ages 56, 62 and 68, all without ADRD at baseline. The cumulative deficit frailty index (FI) comprised 37 items assessing multiple physiological systems. Plasma biomarkers at age 68 included beta-amyloid (Aβ40, Aβ42), total tau (t-tau) and neurofilament light chain (NfL).
Results
Being frail doubled the risk of all-cause mortality by age 68 (OR = 2.44). Age 56 FI significantly predicted age 68 NfL (P = 0.014), Aβ40 (P = 0.001) and Aβ42 (P = 0.023), but not t-tau. Age 62 FI predicted all biomarkers at age 68: NfL (P = 0.023), Aβ40 (P = 0.002), Aβ42 (P = 0.001) and t-tau (P = 0.001). Age 68 FI scores were associated with age 68 levels of NfL (P = 0.027), Aβ40 (P < 0.001), Aβ42 (P = 0.001) and t-tau (P = 0.003). Genetic influences accounted for 45–48% of the variance in frailty and significantly contributed to its stability across 11 years.
Conclusions
Frailty during one’s 50s doubled the risk of mortality by age 68. A mechanism linking frailty and ADRD may be through its associations with biomarkers related to neurodegeneration. Cumulative deficit frailty increases with age but remains moderately heritable across the age range studied. With environmental factors accounting for about half of its variance, early interventions aimed at reducing frailty may help to reduce risk for ADRD.
Keywords: cumulative deficit frailty, plasma biomarkers, plasma beta amyloid, plasma t-tau, neurofilament light chain, older people
Key Points
The cumulative deficit frailty index appears to be a sensitive and reliable indicator even in adults in their mid-50s.
Frailty at midlife predicted risk for higher levels of Alzheimer’s disease-related plasma biomarkers.
Results indicate that frailty comprises a modifiable risk factor that emerges relatively early in the life course.
Guidelines recommending frailty assessments at annual examinations in adults over age 65 may be too conservative.
Background
An estimated 11% of older adults experience frailty, representing considerable individual and societal burden [1, 2]. Frailty connotes weakness and loss of vitality associated with ageing-related physiological decline across multiple systems [3] and is associated with multiple adverse outcomes including disability, hospitalisation, mortality, cognitive impairment and Alzheimer’s disease and related dementias (ADRD) [4–12]. Biologically relevant pathways in frailty are understudied, especially in adults under 65 [13]. Such research would facilitate early identification of pre-morbid mechanisms linking frailty and ADRD [2].
Initially, frailty was conceptualised in terms of physical frailty and cumulative deficit frailty [14]. The unidimensional physical frailty model defined frailty in terms of signs and symptoms of reduced energy and weakness more common in elderly or chronically ill adults [3]. The multidimensional cumulative deficit frailty model defined frailty as reflecting ageing-related accumulation of multiple physical and mental health signs, symptoms, disabilities and diseases [3, 14–20]. Other forms of frailty have been examined (e.g. cognitive, oral, social, biopsychosocial, psychological, organ-specific [11, 21–25]), but examining these is beyond the scope of this manuscript. We focus here on expanding our understanding of persistence of cumulative deficit frailty and mechanisms underlying its association with ADRD.
Twin and family studies have shown that frailty is explained, in part, by significant genetic influences. In adults aged 40–99 years, heritability of cumulative deficit frailty ranged from 0.45 to 0.52 [26, 27]. Heritability of a ‘robustness index ratio’ in twins aged 75 and older was 0.43 [28]. Although some studies examine heritability of frailty in different age cohorts, we are aware of only one longitudinal genetic study [28–30]. Given the potential benefits of early detection of neurodegenerative disease risks, it is important to examine whether genetic and environmental influences on frailty are longitudinally stable versus age-specific [31–34].
In addition to the genetic aetiology of frailty, we also consider predictive validity. For instance, only a small number of studies examine mechanisms linking frailty with pathological ageing or ADRD-related risks. Most studies of frailty and ADRD-related biomarkers in older adults use positron emission tomography, cerebrospinal fluid (CSF) or autopsy data [35–42] and report no significant relationships between physical frailty and beta-amyloid (Aβ40 or Aβ42) [35, 40, 42] or neurofilament light chain (NfL) [35]. To our knowledge, no studies have examined associations between cumulative deficit frailty across midlife and biomarkers in early old age [43, 44].
Here we examined frailty in the Vietnam Era Twin Study of Aging (VETSA), a longitudinal study of middle-aged twins who were dementia-free at baseline. We first examined relationships between cumulative deficit frailty and mortality in order to validate the frailty index (FI) in this relatively young sample. We then explored liability for frailty over time by calculating genetic and environmental influences on frailty in genetically and developmentally informative twin models. Finally, we examined associations between frailty and plasma biomarkers, predicting that higher levels of midlife frailty would be predictive of more pathological levels of total tau (t-tau), Aβ40, Aβ42 and NfL in old age.
Methods
Participants
VETSA randomly recruited 1,291 participants from the Vietnam Era Twin Registry (VETR) [45], a nationally distributed registry of non-patient community-dwelling male–male twin pairs who all served in the US military at some time between 1965 and 1975 [46, 47]. VETSA wave 1 eligibility requirements included being between the ages of 51 and 59 at enrolment, and both members of a twin pair agreeing to participate in the baseline assessment. Details of ascertainment and data collection protocols are described elsewhere [48–50]. Wave 1 data collection occurred from 2003 to 2007, wave 2 from 2009 to 2014, wave 3 from 2016 to 2019 (see Supplementary Appendix 1). VETSA follow-ups included 82% of the original participants plus age-matched attrition replacement participants randomly recruited from the same VETR cohort.
Participants were age 56 years (range 51–61) at wave 1, 62 years (range 56–67) at wave 2 and 68 years (range 61–73) at wave 3 (Table 1). Henceforth, we refer to average age rather than wave. Average lifetime education was 13.88 (SD = 2.1) years. No participants had ADRD at age 56 or 62. The majority (90.8%) were non-Hispanic white. Most did not serve in Southeast Asia (~70%) and did not experience combat (~80%). Participants had comparable health, education and lifestyle characteristics to American men in their age cohort [51]. Ethnicity of the sample reflects the lack of diversity in the US military during the 1960s.
Table 1.
Descriptive characteristics.
| Wave 1 | Wave 2 | Wave 3 | |
|---|---|---|---|
| Years of data collection | 2002–07 | 2009–13 | 2016–19 |
| Participants with Frailty Index (FI) | 1,286 | 1,200 | 1,194 |
| Fraity Index | 0.15 (0.07) | 0.17 (0.08) | 0.19 (0.08) |
| Age (years) | 55.94 (2.43) | 61.72 (2.45) | 67.57 (2.53) |
| Age Range | 51–61 | 56–67 | 61–73 |
| Lifetime education (years) | 13.84 (2.09) | 13.83 (2.09) | 13.93 (2.09) |
| Ethnicity | |||
| White non-Hispanic | 91.68% | 91.08% | 90.54% |
| Other | 8.32% | 8.92% | 9.46% |
| Smoking pack years (if smoker) | 28.71 (23.14) | 30.03 (24.58) | 29.60 (25.69) |
| Smoking status | |||
| Current | 23.41% | 18.49% | 13.11% |
| Former | 45.10% | 47.36% | 51.51% |
| Never | 31.49% | 34.14% | 35.38% |
| Alcohol (drinks/14 days) | 12.30 (21.23) | 12.47 (24.87) | 11.75 (23.45) |
| Alcohol status | |||
| None | 34.27% | 37.86% | 39.46% |
| Light | 51.17% | 48.71% | 48.03% |
| Heavy | 14.56% | 13.43% | 12.51% |
Note. FI is the ratio of number of items divided by total items on scale (37). FI values are reported before any transformations were applied. Table values are presented as mean (SD) or %.
Procedures
Participants travelled to the University of California San Diego or Boston University to complete a day-long assessment. Institutional Review Boards at each university approved the study protocols that were performed in accordance with ethical standards laid down in the 1964 Declaration of Helsinki. Participants provided written informed consent. At all timepoints, assessments involved self-report psychosocial questionnaires, in-person medical history interviews, neuropsychological testing and functional tests. Blood specimens for biomarker assays were obtained at wave 3.
Measures
Cumulative deficit FI
The FI comprised 37 standard items based on previously established standards [52] and other cumulative deficit frailty indices (Supplementary Appendix 2) [17–19, 53]. We recoded each item using previously developed criteria so that 0 indicates no deficit and higher scores indicate that a deficit was present (Supplementary Appendix 3) [17–19]. Individuals with more than seven (20%) missing items were excluded from analysis (ns = 5, 7 and 2 at ages 56, 62 and 68, respectively) [19]. The final FI score was calculated as the ratio of total deficits to total items. For descriptive purposes (see Supplementary Appendix 4), we converted FI ratio scores to categories using previously developed criteria: non-frail (FI ≤ 0.1), pre-frail/vulnerable (0.1 < FI ≤ 0.21), frail (>0.21 ≤ 0.45) and most frail (FI > 0.45) [54]. Mean FI was not significantly different between follow-up participants and attrition replacements at wave 2 [0.19 vs 0.17; t (1,198) = 1.3047, P = 0.192] or wave 3 [0.20 vs 0.19; t (1,192) = 1.0844, P = 0.278].
Plasma biomarkers
Fasting began by 9:00 PM the night before the test day; phlebotomy occurred on the day of testing between 8:00 and 8:30 AM. Technicians aliquoted plasma immediately and placed specimens in −80°C degree freezers. At the end of wave 3 data collection (2019), we conducted biomarker assays for all participants using clinical trial standard operating procedures for sample handling and analysis [55–58]. The Alzheimer's Therapeutic Research Institute Biomarker Core at University of Southern California assayed NfL on a single-plex plate using the ultra-sensitive Simoa technology platform HD-1 (Simoa NFL Advantage Kit; Quanterix Corporation) [55] and t-tau, Aβ40 and Aβ42 with the high-throughput Simoa Human Neurology 3-plex A Quanterix HDX platform. Standard exclusion criteria included hemolysis and a coefficient of variance for plasma concentrations > 0.20, or mean t-tau > 80. We adjusted plasma biomarker values for site and storage time [59].
Other measures and covariates
All-cause mortality was determined by the National Death Index to 31 December 2017; 104 participants died between 2003 and 2017. Race/ethnicity was coded as White non-Hispanic versus other. Education reflected years of lifetime formal education completed. Pack-years equalled the number of cigarette packs smoked per day divided by number of years smoked. Alcohol consumption was total of self-reported number of days drank in past 14 days*number of drinks of wine, beer and/or hard alcohol per day.
Data analysis
Appropriate transformations were applied to normalise distributions. FI scores were cube-root transformed; pack-years were square-root transformed; NfL and t-tau were log-transformed. FI-biomarker analyses z-scored both variables. Fixed effects models were used to predict attrition and mortality. Non-twin analyses included age, race/ethnicity, education, smoking and alcohol consumption as covariates, and controlled for the random effect of family relatedness.
Twin analyses
We used OpenMx2.20.6.1 software [60] in R3.41 and R4.0 [61] to fit multivariate twin models to measure the contribution of genetic and environmental influences [62]. To examine the effects of age in the twin models, we created four age intervals (50–55; 56–60; 61–65; 66–73). In the univariate ‘ACE’ variance component model, total variation in FI in each age group was decomposed into additive genetic (A), common environmental (C) and unique environmental (E) variance components (Supplementary Appendix 5). Since monozygotic (MZ) twin pairs are genetically identical, whereas dizygotic (DZ) pairs share on average half of their genes, the expected MZ and DZ cross-twin covariances for additive genetic effects are fixed to 1.0 and 0.5, respectively. Assuming that C effects are the same across zygosity, MZ and DZ twin pair correlations for C are fixed to 1.0. By definition, E effects also include measurement error and are uncorrelated between twin pairs.
Univariate twin models were extended to multivariate models. We compared the fit of four developmentally meaningful multivariate models (Supplementary Appendix 6). The multivariate ACE ‘correlated factors’ model (a), served as a reference for choosing between the competing models. The autoregression model (b) examines whether time-specific random genetic or environmental effects persist over time and assumes that a trait measured at time t is a function of the same trait measured at a prior timepoint t-1, and of variation reflecting time-specific genetic or environmental influences. The common pathway model (c) predicts that covariance structure between FI in all four age groups is explained by a common liability, which can be decomposed into A, C and E influences. Finally, the independent pathway model (d) predicts that latent genetic and environmental risk factors operate independently to generate covariance between the frailty scores.
Determination of the best-fitting model was based on the optimal balance of complexity and explanatory power using Akaike’s information criterion (AIC) [63]. The significance of the A, C and E parameters was determined using the change in the −2 Log-Likelihood (Δ-2LL) between the competing models and the saturated correlated factors model, and the model with lowest AIC. For each best-fitting multivariate model, model parameters were successively fixed to zero and their significance determined using a likelihood ratio chi-square test.
Results
Descriptive data
FI scores correlated across the three timepoints, with phenotypic correlations ranging from r = 0.68 to 0.76 (all Ps < 0.001). FI scores increased significantly from age 56 to age 68 (t (2,464) = 12.17, P < 0.001). The number of frail participants increased over time (χ2 (1) = 76.39, P < 0.001). Greater FI at age 56 was associated with lower education (B = −0.003; P = 0.01) and more smoking (B = 0.0047; P < 0.001) but not with age, race/ethnicity or alcohol consumption (see Supplementary Appendix 7).
Age 56 FI significantly predicted any-cause attrition [B = 1.62 (0.79), z = 2.04, P = 0.04] and all-cause mortality [B = 4.28 (1.34), z = 3.20, P = 0.001] across 11 years. Compared with non-frail and pre-frail groups (collectively ‘not frail’), the frailty group had double the risk for mortality (OR = 2.44).
General versus age-specific liability of frailty
In multivariate twin analyses the autoregression model was the best-fitting longitudinal model based on the non-significant change in chi-square and lowest AIC (Supplementary Appendix 8). All C influences could be dropped without any significant deterioration in model fit, yielding a best-fitting AE model.
Heritability of FI ranged from 45 to 48% for the four age intervals (Figure 1) indicating a general liability for frailty that did not change substantively with increasing age. Most of the genetic variation in FI scores across time was present at the first age interval (A1, Figure 1). As shown by the high transmission coefficients (β = 0.93) from one time interval to the next, genetic variance at the first age interval was enduring and accounted for large portions of genetic variance at all three later intervals. Inspection of the 95% confidence intervals, however, revealed a small but significant dynamic or time-specific source of genetic variance at ages 61–65 (A3). Most of the environmental variation in FI was also present at the first time interval (E1, Figure 1) and accounted for environmental variance at the three later intervals. There was also a small but significant age-dependent source of environmental variance that emerged at ages 56–60 (E2, Figure 1). High genetic correlations across the four age groups (rg = 0.83–0.96; Supplementary Appendix 9) demonstrate that the same genes were largely influencing FI across time. In contrast, environmental correlations were moderate, ranging from re = 0.51 to 0.63, suggesting that environmental influences were unique to each age interval.
Figure 1.
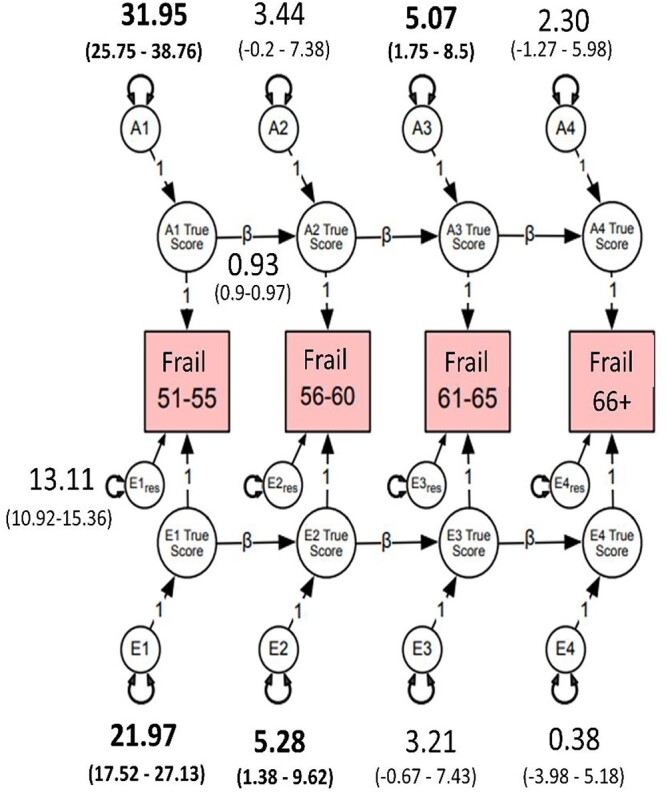
Autoregressive best-fitting model. Frail = cumulative deficit FI, cube-root transformed. A1–A4 estimate the cumulative additive genetic influences at each age group; E1–E4 estimate the cumulative unshared environmental influences at each age group; Ai1 estimates the additive influences at age 51–55, whereas Ai2–Ai4 represent the magnitude of new genetic information at ages 56–60, 61–65 and 66–73; Ei1 estimates the magnitude of unshared environmental influences at age 51–55; Ei2–Ei4 represent unshared environmental influences at ages 56–60, 61–65 and 66–73; res represents residuals or unexplained variance. Estimates on the directional paths between A1 and A4 and E1 and E4 represent βs for autoregressive relationships. Residuals and betas for all age groups were set to be equal without significant loss in model fit (Ps > 0.05). β (e.g. 0.93) for A and E pathways was set to be equal. Bolded numbers indicate statistical significance at 95% CI.
To explore qualitatively the observed genetic stability from age 51 to age 73, we calculated the frequency of frailty items at each age interval (Supplementary Appendix 10). Consistent with the heritability, stability and genetic correlations, the most frequently endorsed items remained consistently represented across age intervals (Table 2). However, frequencies for hypertension and joint pain increased substantially from the 56–60 to the 61–65 age interval. These changes may be related to activation of different genes that predispose individuals to frailty and suggest genetic control of sensitivity to the environment.
Table 2.
Most frequently endorsed cumulative FI items in each age interval.

|
FI and plasma biomarkers
Age 56 FI predicted age 68 Aβ40 (β = 0.13, P = 0.001, 95%CI 0.06, 0.21), Aβ42 (β = 0.09, P = 0.023, 95%CI 0.01, 0.16) and NfL (β = 0.09, P = 0.014, 95%CI 0.02, 0.09), but not t-tau (Table 3; Figure 2). Age 62 FI predicted all age 68 biomarkers: Aβ40 (β = 0.11, P = 0.002, 95%CI 0.04, 0.18), Aβ42 (β = 0.12, P = 0.001, 95%CI 0.05, 0.19), t-tau (β = 0.12, P = 0.001, 95%CI 0.05, 0.19), NfL (β = 0.08, P = 0.023, 95%CI 0.01, 0.15) (Table 3; Supplementary Appendix 11). Age 68 FI scores were associated with age 68 levels of Aβ40 (β = 0.12, P < 0.001, 95%CI 0.06, 0.18), Aβ42 (β = 0.11, P = 0.001, 95%CI 0.04, 0.17), t-tau (β = 0.10, P = 0.003, 95%CI 0.03, 0.16), NfL (β = 0.07, P = 0.027, 95%CI 0.01, 0.13). Higher FI scores were associated with higher biomarker levels. Associations between FI and the Aβ42/Aβ40 ratio were not significant. We re-ran these biomarker analyses including only participants who participated at all three waves (N = 814). Results were consistent with the above results (Supplementary Appendix 12).
Table 3.
Associations between cumulative deficit FI at each wave and age 68 plasma biomarkers.
| Parameter estimate | 95% CI | SE | df | t-value | P-value | |
|---|---|---|---|---|---|---|
| (a) FI wave 1 (age 56) with wave 3 plasma biomarkers (age 68) | ||||||
| NfL | 0.09 | [0.02, 0.17] | 0.04 | 317 | 2.48 | 0.014 |
| t-tau | 0.06 | [−0.02, 0.14] | 0.04 | 265 | 1.56 | 0.121 |
| Aβ40 | 0.13 | [0.06, 0.21] | 0.04 | 299 | 3.47 | 0.001 |
| Aβ42 | 0.09 | [0.01, 0.16] | 0.04 | 295 | 2.28 | 0.023 |
| Aβ42/40 ratio | 0.02 | [−0.04, 0.09] | 0.03 | 295 | 0.68 | 0.498 |
| (b) FI wave 2 (age 62) with wave 3 plasma biomarkers (age 68) | ||||||
| NfL | 0.08 | [0.01, 0.15] | 0.03 | 341 | 2.29 | 0.023 |
| t-tau | 0.12 | [0.05, 0.19] | 0.04 | 289 | 3.32 | 0.001 |
| Aβ40 | 0.11 | [0.04, 0.18] | 0.04 | 322 | 3.12 | 0.002 |
| Aβ42 | 0.12 | [0.05, 0.19] | 0.04 | 319 | 3.37 | 0.001 |
| Aβ42/40 ratio | 0.04 | [−0.02, 0.11] | 0.03 | 319 | 1.36 | 0.174 |
| (c) FI wave 3 (age 68) with wave 3 plasma biomarkers (age 68) | ||||||
| NfL | 0.07 | [0.01, 0.13] | 0.03 | 422 | 2.22 | 0.027 |
| t-tau | 0.10 | [0.03, 0.16] | 0.03 | 351 | 2.97 | 0.003 |
| Aβ40 | 0.12 | [0.06, 0.18] | 0.03 | 394 | 3.93 | 0.000 |
| Aβ42 | 0.11 | [0.04, 0.17] | 0.03 | 389 | 3.36 | 0.001 |
| Aβ42/40 ratio | 0.00 | [−0.06, 0.06] | 0.03 | 389 | −0.05 | 0.963 |
Note. Shown are standardised parameter estimates. FI = Frailty Index. FI was cube-root transformed. Values for NfL and t-tau were log-transformed first to address skewness. Biomarkers were then residualized for site and storage time. Finally, FI and plasma biomarker measures were z-scored. Plasma biomarkers: NfL = neurofilament light; t-tau = total tau; Aβ = beta amyloid. Models adjusted for fixed effects of age, White non-Hispanic versus other (race/ethnicity) and education, but used family as a random effect. Biomarker Ns range from (a) n = 725–791 and (b) n = 784–852 to (c) n = 960–1,048.
Figure 2.
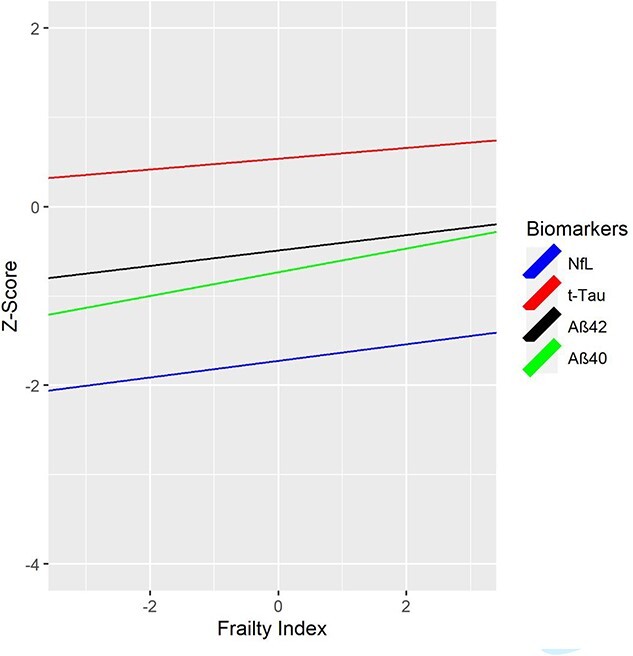
Cumulative deficit FI at age 56 and AD-related plasma biomarkers at age 68. FI = Frailty Index. FI was cube-root transformed; NfL and t-tau were log-transformed. Values for NfL and t-tau were log-transformed first to address skewness. Biomarkers were then residualized for site and storage time. Finally, both FI and plasma biomarker measures were z-scored. NfL = Neurofilament light chain; t-tau = total tau; Aβ40 = beta amyloid 40; Aβ42 = beta amyloid 42. Biomarker measures are z-scored for comparability; descriptive statistics for biomarker measures provided in Supplementary Appendix 16 and boxplots are shown in Supplementary Appendix 17. Higher FI scores are associated with higher biomarker levels. FI scores at age 56 significantly predicted age 68 plasma NfL (P = 0.014), Aβ40 (P = 0.001) and Aβ42 (P = 0.023), but not t-tau.
We conducted sensitivity analyses excluding participants with stroke at wave 1 or wave 2 (see Supplementary Appendix 13). Biomarker results predicting from wave 1 frailty to wave 3 biomarkers remained consistent after excluding participants with stroke at wave 1 (n = 11–12). For wave 2 frailty predicting wave 3 biomarkers, NfL was no longer significant (P = 0.0762) once participants with stroke by wave 2 (n = 27–29) were excluded (Supplementary Appendix 14). When all participants with stroke or ADRD at any time point were excluded (n = 64–70), associations between FI and NfL were no longer significant (Supplementary Appendix 15).
Discussion
In this community-dwelling sample of men without ADRD at baseline (99% of whom were in their 50s at baseline), cumulative deficit frailty doubled the risk of mortality by age 68. Nearly one-half of the variance in frailty was accounted for by genetic influences that were mostly stable with increasing age. Greater cumulative deficit frailty at average age 56 predicted higher levels of ADRD-related plasma biomarkers Aβ42 and t-tau (but not the Aβ42/Aβ40 ratio), and more pathological levels of Aβ40 and NfL by average age 68. These associations of frailty with mortality as well with multiple plasma biomarkers suggest that frailty at midlife is related to advanced ageing and possibly to increased risk for ADRD.
Whilst lower CSF Aβ42 is generally associated with higher brain amyloid deposition [64], in four independent samples as tau increased CSF Aβ increased and then later decreased, presumably reflecting early increases in production and later sequestration in amyloid plaques [65, 66]. In three studies, adults aged 45–70 showed a positive CSF Aβ-tau association, whereas adults aged 71–90 showed a negative association [60]. Based on their age, VETSA participants may still be within this first, positive association phase. The Aβ42/Aβ40 ratio was not significant, but this has not been consistently observed in CSF or plasma in younger adults [40, 67, 68]. Given the aforementioned inverted-U pattern, it may be that frailty will predict lower Aβ42 and a lower Aβ42/Aβ40 ratio at later ages. Identification of frailty in midlife may be important for understanding ageing processes prior to old age and for developing early interventions to reduce frailty that could possibly delay onset of dementia [69–71]. The results predicting mortality and attrition by age 68 also highlight the issue of selection bias and selective survival in studies that begin in old age, especially if exclusion criteria are based on health indices and may also account for mixed results in prior studies of frailty and biomarkers since those studies were all in older adults.
We also capitalised on our genetically informative twin sample. Heritability of frailty ranging from 0.45 to 0.48 suggests a general liability to become frail, representing a measure of biological age involving dysregulation of multiple interacting physiological systems [2]. Notably, frailty was longitudinally stable; this is consistent with the one previous study [27] with a broader age range. Small but significant new genetic influences emerged in the age 61–65 interval, consistent with one study showing significant change in frailty trajectories around age 65 [72]. The emergence of quantitatively distinct genetic and environmental risks appeared to coincide with the emergence of hypertension and joint pain.
Limitations
When our plasma biomarkers were assayed, plasma p-tau 181 or 217 was not obtained, which may provide better indicators of brain amyloid related to ADRD [73–75]. Our study comprised approximately 90% non-Hispanic White men. Future studies should evaluate women and diverse racial/ethnic groups. Mortality data from the National Death Index were only available to the end of 2017, thus, our mortality findings may provide conservative estimates. The FI comprised 20 diseases, 11 symptoms/signs, one laboratory abnormality and five functional impairments, a distribution consistent with other cumulative deficit frailty measures. Although this is imbalanced it does meet most criteria established by Searle et al. [52]. However, if the imbalance between symptoms, signs, diseases, functional impairments and laboratory abnormalities across time was significant or indicative of heterogenous syndromes, this would be inconsistent with our best-fitting multivariate twin model with the large beta causal coefficients (β = 0.93) between age intervals. Finally, we were unable to calculate the Fried physical FI. Therefore, we are unable to ascertain if our results are generalizable to physical frailty.
Conclusion
Cumulative deficit frailty—even in adults in their mid-50s—appears to be a sensitive and reliable indicator of multiple adverse outcomes in these community dwelling adults. Frailty at midlife predicted mortality by age 68, attrition and a tendency towards more pathological levels of plasma biomarkers across 11 years—signalling more advanced biological ageing. Taken together, the results indicate that frailty is a modifiable risk factor with potential ties to risk for ADRD and emerges relatively early in the life course. Guidelines recommending frailty assessments at annual examinations in adults over age 65 thus may be too conservative [1]. Greater attention needs to be paid to early interventions to reduce or prevent frailty well before old age [1, 2, 44].
Supplementary Material
Acknowledgements
The US Department of Veterans Affairs, Department of Defence; National Personnel Records Center, National Archives and Records Administration; National Opinion Research Center; National Research Council, National Academy of Sciences; and the Institute for Survey Research, Temple University provided invaluable assistance in the creation of the VETR. The Cooperative Studies Program of the US Department of Veterans Affairs provided financial support for development and maintenance of the VETR. We would also like to acknowledge the continued cooperation and participation of the members of the VETR and their families. Investigators within the Vietnam Era Twin Study of Aging (VETSA) contributed to the design and implementation of VETSA and/or data collection but did not participate in analysis or writing of this report.
Contributor Information
Erik Buchholz, Department of Psychiatry, University of California San Diego, La Jolla, CA 92093, USA; Center for Behavior Genetics of Aging, University of California, La Jolla, San Diego, CA 92093, USA; Department of Information Science, University of Arkansas at Little Rock, Little Rock, AR 72204 USA.
Nathan A Gillespie, Virginia Institute for Psychiatric and Behavior Genetics, Virginia Commonwealth University, VA 23298, USA.
Jack F Hunt, Department of Psychiatry, University of California San Diego, La Jolla, CA 92093, USA; Center for Behavior Genetics of Aging, University of California, La Jolla, San Diego, CA 92093, USA.
Chandra A Reynolds, Department of Psychology, University of California Riverside, Riverside, CA 92521, USA.
Robert A Rissman, Department of Neurosciences, University of California, San Diego and VA San Diego Healthcare System, La Jolla, CA 92093, USA; Alzheimer’s Therapeutic Research Institute, University of Southern California, San Diego, CA 92121, USA.
Angelica Schroeder, Department of Psychiatry, University of California San Diego, La Jolla, CA 92093, USA; Center for Behavior Genetics of Aging, University of California, La Jolla, San Diego, CA 92093, USA.
Isaac Cortes, Department of Psychiatry, University of California San Diego, La Jolla, CA 92093, USA; Center for Behavior Genetics of Aging, University of California, La Jolla, San Diego, CA 92093, USA.
Tyler Bell, Department of Psychiatry, University of California San Diego, La Jolla, CA 92093, USA; Center for Behavior Genetics of Aging, University of California, La Jolla, San Diego, CA 92093, USA.
Michael J Lyons, Department of Psychological and Brain Sciences, Boston University, Boston, MA 02215, USA.
William S Kremen, Department of Psychiatry, University of California San Diego, La Jolla, CA 92093, USA; Center for Behavior Genetics of Aging, University of California, La Jolla, San Diego, CA 92093, USA.
Carol E Franz, Department of Psychiatry, University of California San Diego, La Jolla, CA 92093, USA; Center for Behavior Genetics of Aging, University of California, La Jolla, San Diego, CA 92093, USA.
Declaration of Conflicts of Interest
None.
Declaration of Sources of Funding
The content is the sole responsibility of the authors and does not necessarily represent official views of the National Institute on Aging, National Institutes of Health or the Veteran’s Administration. This work was supported by grants from the National Institute on Aging at the National Institutes of Health: R01 AG050595, ROI AG022381, ROI AG076838, ROI AG037985, ROI AG064955 and P01 AG055367.
Data availability
The data supporting the findings of this study are available on request from the corresponding author. Data are not downloadable from a public website because of privacy or ethical restrictions established by the Vietnam Era Twin Registry (VETR) at the Seattle, VA. VETSA data are available through a data request form available on the VETSA website: https://psychiatry.ucsd.edu/research/programs-centers/vetsa/index.html. Data request for VET Registry and VETSA data can also be made at the VETR; the access process is described at: https://www.seattle.eric.research.va.gov/VETR/Investigator_Access.asp.
References
- 1. Allison R 2nd, Assadzandi S, Adelman M. Frailty: evaluation and management. Am Fam Physician 2021; 103: 219–26. [PubMed] [Google Scholar]
- 2. Hoogendijk EO, Afilalo J, Ensrud KE, Kowal P, onder G, Fried LP. Frailty: implications for clinical practice and public health. Lancet 2019; 394: 1365–75. [DOI] [PubMed] [Google Scholar]
- 3. Fried LP, Tangen CM, Walston Jet al. Frailty in older adults: evidence for a phenotype. J Gerontol A Biol Sci Med Sci 2001; 56: M146–57. [DOI] [PubMed] [Google Scholar]
- 4. Kojima G. Frailty as a predictor of disabilities among community-dwelling older people: a systematic review and meta-analysis. Disabil Rehabil 2017; 39: 1897–908. [DOI] [PubMed] [Google Scholar]
- 5. Kojima G, Liljas A, Iliffe S, Walters K. Prevalence of frailty in mild to moderate Alzheimer's disease: a systematic review and meta-analysis. Curr Alzheimer Res 2017; 14: 1256–63. [DOI] [PubMed] [Google Scholar]
- 6. Wallace LMK, Theou O, Darvesh Set al. Neuropathologic burden and the degree of frailty in relation to global cognition and dementia. Neurology 2020; 95: e3269–79. [DOI] [PMC free article] [PubMed] [Google Scholar]
- 7. Ensrud KE, Ewing SK, Cawthon PMet al. A comparison of frailty indexes for the prediction of falls, disability, fractures, and mortality in older men. J Am Geriatr Soc 2009; 57: 492–8. [DOI] [PMC free article] [PubMed] [Google Scholar]
- 8. Robertson DA, Savva GM, Kenny RA. Frailty and cognitive impairment--a review of the evidence and causal mechanisms. Ageing Res Rev 2013; 12: 840–51. [DOI] [PubMed] [Google Scholar]
- 9. O'Halloran AM, Finucane C, Savva GM, Robertson IH, Kenny RA. Sustained attention and frailty in the older adult population. J Gerontol B Psychol Sci Soc Sci 2014; 69: 147–56. [DOI] [PubMed] [Google Scholar]
- 10. Ward DD, Ranson JM, Wallace LMK, Llewellyn DJ, Rockwood K. Frailty, lifestyle, genetics and dementia risk. J Neurol Neurosurg Psychiatry 2022; 93: 343–50. [DOI] [PMC free article] [PubMed] [Google Scholar]
- 11. Solfrizzi V, Scafato E, Custodero Cet al. Biopsychosocial frailty and mild cognitive impairment subtypes: findings from the Italian project on the epidemiology of Alzheimer's disease (IPREA). Alzheimers Dement 2023; 19: 3306–15. [DOI] [PubMed] [Google Scholar]
- 12. Rogers NT, Steptoe A, Cadar D. Frailty is an independent predictor of incident dementia: evidence from the English longitudinal study of ageing. Sci Rep 2017; 7: 15746. [DOI] [PMC free article] [PubMed] [Google Scholar]
- 13. Ho YY, Matteini AM, Beamer Bet al. Exploring biologically relevant pathways in frailty. J Gerontol A Biol Sci Med Sci 2011; 66: 975–9. [DOI] [PMC free article] [PubMed] [Google Scholar]
- 14. Rockwood K, Andrew M, Mitnitski A. A comparison of two approaches to measuring frailty in elderly people. J Gerontol A Biol Sci Med Sci 2007; 62: 738–43. [DOI] [PubMed] [Google Scholar]
- 15. Walston JD, Bandeen-Roche K. Frailty: a tale of two concepts. BMC Med 2015; 13: 185. [DOI] [PMC free article] [PubMed] [Google Scholar]
- 16. Rockwood K, Mitnitski A. Frailty in relation to the accumulation of deficits. J Gerontol A Biol Sci Med Sci 2007; 62: 722–7. [DOI] [PubMed] [Google Scholar]
- 17. Williams DM, Jylhava J, Pedersen NLet al. A frailty index for UK biobank participants. J Gerontol A Biol Sci Med Sci 2019; 74: 582–7. [DOI] [PMC free article] [PubMed] [Google Scholar]
- 18. Jiang M, Foebel AD, Kuja-Halkola Ret al. Frailty index as a predictor of all-cause and cause-specific mortality in a Swedish population-based cohort. Aging (Albany NY) 2017; 9: 2629–46. [DOI] [PMC free article] [PubMed] [Google Scholar]
- 19. Li X, Ploner A, Wang Yet al. Longitudinal trajectories, correlations and mortality associations of nine biological ages across 20-years follow-up. Elife 2020; 9: 9. [DOI] [PMC free article] [PubMed] [Google Scholar]
- 20. Li X, Ploner A, Karlsson IKet al. The frailty index is a predictor of cause-specific mortality independent of familial effects from midlife onwards: a large cohort study. BMC Med 2019; 17: 94. [DOI] [PMC free article] [PubMed] [Google Scholar]
- 21. Dibello V, Zupo R, Sardone Ret al. Oral frailty and its determinants in older age: a systematic review. Lancet Healthy Longev 2021; 2: e507–20. [DOI] [PubMed] [Google Scholar]
- 22. Kelaiditi E, Cesari M, Canevelli Met al. Cognitive frailty: rational and definition from an (I.A.N.A./I.A.G.G.) international consensus group. J Nutr Health Aging 2013; 17: 726–34. [DOI] [PubMed] [Google Scholar]
- 23. Panza F, Solfrizzi V, Sardone Ret al. Depressive and biopsychosocial frailty phenotypes: impact on late-life cognitive disorders. J Alzheimers Dis 2023; 94: 879–98. [DOI] [PubMed] [Google Scholar]
- 24. Tsutsumimoto K, Doi T, Makizako Het al. Association of social frailty with both cognitive and physical deficits among older people. J Am Med Dir Assoc 2017; 18: 603–7. [DOI] [PubMed] [Google Scholar]
- 25. Zupo R, Castellana F, Guerra Vet al. Associations between nutritional frailty and 8-year all-cause mortality in older adults: the Salus in Apulia study. J Intern Med 2021; 290: 1071–82. [DOI] [PubMed] [Google Scholar]
- 26. Young AC, Glaser K, Spector TD, Steves CJ. The identification of hereditary and environmental determinants of frailty in a cohort of UK twins. Twin Res Hum Genet 2016; 19: 600–9. [DOI] [PubMed] [Google Scholar]
- 27. Mak JKL, Reynolds CA, Hagg Set al. Sex differences in genetic and environmental influences on frailty and its relation to body mass index and education. Aging (Albany NY) 2021; 13: 16990–7023. [DOI] [PMC free article] [PubMed] [Google Scholar]
- 28. Dato S, Montesanto A, Lagani V, Jeune B, Christensen K, Passarino G. Frailty phenotypes in the elderly based on cluster analysis: a longitudinal study of two Danish cohorts. Evidence for a genetic influence on frailty. Age (Dordr) 2012; 34: 571–82. [DOI] [PMC free article] [PubMed] [Google Scholar]
- 29. Livshits G, Ni Lochlainn M, Malkin Iet al. Shared genetic influence on frailty and chronic widespread pain: a study from Twins UK. Age Ageing 2018; 47: 119–25. [DOI] [PMC free article] [PubMed] [Google Scholar]
- 30. Mak JKL, Kuja-Halkola R, Bai Get al. Genetic and environmental influences on longitudinal frailty trajectories from adulthood into old age. J Gerontol A Biol Sci Med Sci 2022; 78: 333–41. [DOI] [PMC free article] [PubMed] [Google Scholar]
- 31. Boomsma DI, Martin NG, Molenaar PC. Factor and simplex models for repeated measures: application to two psychomotor measures of alcohol sensitivity in twins. Behav Genet 1989; 19: 79–96. [DOI] [PubMed] [Google Scholar]
- 32. Boomsma DI, Molenaar PC. The genetic analysis of repeated measures. I. Simplex models. Behav Genet 1987; 17: 111–23. [DOI] [PubMed] [Google Scholar]
- 33. Eaves LJ, Long J, Heath AC. A theory of developmental change in quantitative phenotypes applied to cognitive development. Behav Genet 1986; 16: 143–62. [DOI] [PubMed] [Google Scholar]
- 34. Guttman L. A New Approach to Factor Analysis. Glencoe, IL: The Free Press, 1954. [Google Scholar]
- 35. Angioni D, Lu WH, Sourdet Set al. Biomarkers of age-related frailty and frailty related to diseases: an exploratory, cross-sectional analysis from the MAPT study. J Nutr Health Aging 2022; 26: 545–51. [DOI] [PubMed] [Google Scholar]
- 36. Canevelli M, Arisi I, Bacigalupo Iet al. Biomarkers and phenotypic expression in Alzheimer's disease: exploring the contribution of frailty in the Alzheimer's disease neuroimaging initiative. Geroscience 2021; 43: 1039–51. [DOI] [PMC free article] [PubMed] [Google Scholar]
- 37. Maltais M, De Souto BP, Hooper Cet al. Association between brain beta-amyloid and frailty in older adults. J Gerontol A Biol Sci Med Sci 2019; 74: 1747–52. [DOI] [PubMed] [Google Scholar]
- 38. Yoon DH, Lee JY, Shin SA, Kim Y, Song W. Physical frailty and amyloid-beta deposits in the brains of older adults with cognitive frailty. J Clin Med 2018; 7. 10.3390/jcm7070169. [DOI] [PMC free article] [PubMed] [Google Scholar]
- 39. Lu WH, Souto BP, Rolland Yet al. Biological and neuroimaging markers as predictors of 5-year incident frailty in older adults: a secondary analysis of the MAPT study. J Gerontol A Biol Sci Med Sci 2021; 76: e361–9. [DOI] [PubMed] [Google Scholar]
- 40. Lu WH, Giudici KV, Rolland Yet al. Prospective associations between plasma amyloid-Beta 42/40 and frailty in community-dwelling older adults. J Prev Alzheimers Dis 2021; 8: 1–47. [DOI] [PMC free article] [PubMed] [Google Scholar]
- 41. Buchman AS, Schneider JA, Leurgans S, Bennett DA. Physical frailty in older persons is associated with Alzheimer disease pathology. Neurology 2008; 71: 499–504. [DOI] [PMC free article] [PubMed] [Google Scholar]
- 42. Gabelle A, Schraen S, Gutierrez LAet al. Plasma beta-amyloid 40 levels are positively associated with mortality risks in the elderly. Alzheimers Dement 2015; 11: 672–80. [DOI] [PubMed] [Google Scholar]
- 43. Wallace L, Theou O, Rockwood K, Andrew MK. Relationship between frailty and Alzheimer's disease biomarkers: a scoping review. Alzheimers Dement (Amst) 2018; 10: 394–401. [DOI] [PMC free article] [PubMed] [Google Scholar]
- 44. Livingston G, Huntley J, Sommerlad Aet al. Dementia prevention, intervention, and care: 2020 report of the lancet commission. Lancet 2020; 396: 413–46. [DOI] [PMC free article] [PubMed] [Google Scholar]
- 45. Tsuang MT, Bar JL, Harley RM, Lyons MJ. The Harvard twin study of substance abuse: what we have learned. Harv Rev Psychiatry 2001; 9: 267–79. [PubMed] [Google Scholar]
- 46. Henderson WG, Eisen SE, Goldberg J, True WR, Barnes JE, Vitek ME. The Vietnam era twin registry: a resource for medical research. Public Health Rep 1990; 105: 368–73. [PMC free article] [PubMed] [Google Scholar]
- 47. Goldberg J, Curran B, Vitek ME, Henderson WG, Boyko EJ. The Vietnam Era Twin Registry. Twin Res 2002; 5: 476–81. [DOI] [PubMed] [Google Scholar]
- 48. Kremen WS, Franz CE, Lyons MJ. VETSA: the Vietnam Era Twin Study of Aging. Twin Res Hum Genet 2013; 16: 399–402. [DOI] [PMC free article] [PubMed] [Google Scholar]
- 49. Kremen WS, Franz CE, Lyons MJ. Current status of the Vietnam Era Twin Study of Aging (VETSA). Twin Res Hum Genet 2019; 22: 783–7. [DOI] [PubMed] [Google Scholar]
- 50. Kremen WS, Thompson-Brenner H, Leung YMet al. Genes, environment, and time: the Vietnam Era Twin Study of Aging (VETSA). Twin Res Hum Genet 2006; 9: 1009–22. [DOI] [PubMed] [Google Scholar]
- 51. Schoenborn CA, Heyman KM. Health characteristics of adults aged 55 years and over: United States, 2004-2007. Natl Health Stat Report 2009; 16: 1–31. PMID: 19697804. [PubMed] [Google Scholar]
- 52. Searle SD, Mitnitski A, Gahbauer EA, Gill TM, Rockwood K. A standard procedure for creating a frailty index. BMC Geriatr 2008; 8: 24. [DOI] [PMC free article] [PubMed] [Google Scholar]
- 53. Finkel D, Sternang O, Jylhava Jet al. Functional aging index complements frailty in prediction of entry into care and mortality. J Gerontol A Biol Sci Med Sci 2019; 74: 1980–6. [DOI] [PMC free article] [PubMed] [Google Scholar]
- 54. Blodgett J, Theou O, Kirkland S, Andreou P, Rockwood K. Frailty in NHANES: comparing the frailty index and phenotype. Arch Gerontol Geriatr 2015; 60: 464–70. [DOI] [PubMed] [Google Scholar]
- 55. O'Bryant S, Petersen M, Hall Jet al. Characterizing plasma NfL in a community-dwelling multi-ethnic cohort: results from the HABLE study. Alzheimers Dement 2022; 18: 240–50. [DOI] [PMC free article] [PubMed] [Google Scholar]
- 56. Smirnov DS, Ashton NJ, Blennow Ket al. Plasma biomarkers for Alzheimer's disease in relation to neuropathology and cognitive change. Acta Neuropathol 2022; 143: 487–503. [DOI] [PMC free article] [PubMed] [Google Scholar]
- 57. Winston CN, Goetzl EJ, Schwartz JB, Elahi FM, Rissman RA. Complement protein levels in plasma astrocyte-derived exosomes are abnormal in conversion from mild cognitive impairment to Alzheimer's disease dementia. Alzheimers Dement (Amst) 2019; 11: 61–6. [DOI] [PMC free article] [PubMed] [Google Scholar]
- 58. Winston CN, Goetzl EJ, Akers JCet al. Prediction of conversion from mild cognitive impairment to dementia with neuronally derived blood exosome protein profile. Alzheimers Dement (Amst) 2016; 3: 63–72. [DOI] [PMC free article] [PubMed] [Google Scholar]
- 59. Gillespie NA, Elman JA, McKenzie Ret al. The heritability of blood-based biomarkers related to risk of Alzheimer’s disease in a population-based sample of early old-age men. Alzheimers Dement 2024; 20: 356–65. [DOI] [PMC free article] [PubMed] [Google Scholar]
- 60. Boker S, Neale M, Maes Het al. OpenMx: an open source extended structural equation modeling framework. Psychometrika 2011; 76: 306–17. [DOI] [PMC free article] [PubMed] [Google Scholar]
- 61. R Development Core Team . R: A Language and Environment for Statistical Computing. Vienna, Austria: R Foundation for Statistical Computing, 2018. [Google Scholar]
- 62. Neale MC, Cardon LR. Methodology for Genetic Studies of Twins and Families .Dordrecht, The Netherlands: Kluwer Academic Publishers, 1992. [Google Scholar]
- 63. Akaike H. Factor-analysis and Aic. Psychometrika 1987; 52: 317–32. [Google Scholar]
- 64. Fagan AM, Mintun MA, Mach RHet al. Inverse relation between in vivo amyloid imaging load and cerebrospinal fluid Abeta42 in humans. Ann Neurol 2006; 59: 512–9. [DOI] [PubMed] [Google Scholar]
- 65. Leon MJ, Pirraglia E, Osorio RSet al. The nonlinear relationship between cerebrospinal fluid Abeta42 and tau in preclinical Alzheimer's disease. PLoS One 2018; 13: e0191240. [DOI] [PMC free article] [PubMed] [Google Scholar]
- 66. Lafirdeen ASM, Cognat E, Sabia Set al. Biomarker profiles of Alzheimer's disease and dynamic of the association between cerebrospinal fluid levels of beta-amyloid peptide and tau. PloS One 2019; 14: e0217026. [DOI] [PMC free article] [PubMed] [Google Scholar]
- 67. Doecke JD, Perez-Grijalba V, Fandos Net al. Total Abeta(42)/Abeta(40) ratio in plasma predicts amyloid-PET status, independent of clinical AD diagnosis. Neurology 2020; 94: e1580–91. [DOI] [PMC free article] [PubMed] [Google Scholar]
- 68. Burnham SC, Fandos N, Fowler Cet al. Longitudinal evaluation of the natural history of amyloid-beta in plasma and brain. Brain Commun 2020; 2: fcaa041. [DOI] [PMC free article] [PubMed] [Google Scholar]
- 69. Mitnitski AB, Mogilner AJ, Rockwood K. Accumulation of deficits as a proxy measure of aging. ScientificWorldJournal 2001; 1: 323–36. [DOI] [PMC free article] [PubMed] [Google Scholar]
- 70. Ukraintseva S, Arbeev K, Duan Met al. Decline in biological resilience as key manifestation of aging: potential mechanisms and role in health and longevity. Mech Ageing Dev 2021; 194: 111418. [DOI] [PMC free article] [PubMed] [Google Scholar]
- 71. Zampino M, Polidori MC, Ferrucci Let al. Biomarkers of aging in real life: three questions on aging and the comprehensive geriatric assessment. Geroscience 2022; 44: 2611–22. [DOI] [PMC free article] [PubMed] [Google Scholar]
- 72. Raymond E, Reynolds CA, Dahl Aslan AKet al. Drivers of frailty from adulthood into old age: results from a 27-year longitudinal population-based study in Sweden. J Gerontol A Biol Sci Med Sci 2020; 75: 1943–50. [DOI] [PMC free article] [PubMed] [Google Scholar]
- 73. Janelidze S, Mattsson N, Palmqvist Set al. Plasma P-tau181 in Alzheimer's disease: relationship to other biomarkers, differential diagnosis, neuropathology and longitudinal progression to Alzheimer's dementia. Nat Med 2020; 26: 379–86. [DOI] [PubMed] [Google Scholar]
- 74. Janelidze S, Stomrud E, Smith Ret al. Cerebrospinal fluid p-tau217 performs better than p-tau181 as a biomarker of Alzheimer's disease. Nat Commun 2020; 11: 1683. [DOI] [PMC free article] [PubMed] [Google Scholar]
- 75. Tissot C, Therriault J, Kunach Pet al. Comparing tau status determined via plasma pTau181, pTau231 and [(18)F]MK6240 tau-PET. EBioMedicine 2022; 76: 103837. [DOI] [PMC free article] [PubMed] [Google Scholar]
Associated Data
This section collects any data citations, data availability statements, or supplementary materials included in this article.
Supplementary Materials
Data Availability Statement
The data supporting the findings of this study are available on request from the corresponding author. Data are not downloadable from a public website because of privacy or ethical restrictions established by the Vietnam Era Twin Registry (VETR) at the Seattle, VA. VETSA data are available through a data request form available on the VETSA website: https://psychiatry.ucsd.edu/research/programs-centers/vetsa/index.html. Data request for VET Registry and VETSA data can also be made at the VETR; the access process is described at: https://www.seattle.eric.research.va.gov/VETR/Investigator_Access.asp.