

Abstract
Circulating extracellular matrix (ECM) proteins are serological biomarkers of interest due to their association with pathologies involving disease processes such as fibrosis and cancers. In this study, we investigate the potential for serum biomarker research using differential protease specificity (DPS), leveraging alternate protease specificity as a targeting mechanism to selectively digest circulating ECM protein serum proteins. A proof-of-concept study is presented using serum from patients with cirrhotic liver or hepatocellular carcinoma. The approach uses collagenase DPS for digestion of deglycosylated serum and liquid-chromatography-trapped ion mobility-tandem mass spectrometry (LC-TIMS-MS/MS) to enhance the detection of ECM proteins in serum. It requires no sample enrichment and minimizes the albumin average precursor intensity readout to less than 1.2%. We further demonstrate the capabilities for using the method as a high-throughput matrix-assisted laser/desorption ionization mass spectrometry (MALDI-MS) assay coupled with reference library searching. A goal is to improve the depth and breadth of biofluid proteomics for noninvasive assays.
Keywords: serum, extracellular matrix, collagen, proteomics, trapped ion mobility
Introduction
The extracellular matrix (ECM) forms a uniquely proteinaceous composition of collagens, glycoproteins, and proteoglycans that surrounds cells to comprise the functional tissue.1−3 Significant post-translational modifications fine-tune the structure–function relationships of ECM suprastructures and their cell–ECM interactions, providing sites for cell binding or controlling gradient diffusion throughout the tissue.3 Pathological remodeling of the ECM by proteases and cellular deposition alters recruitment of specific immune cells, influences cellular differentiation, and diverts homeostatic molecular gradients.4,5 Adverse tissue remodeling results in shedding of ECM composition into the circulation system and is a target for early disease detection. Serological detection of ECM remodeling has been reported for diseases like liver cirrhosis and cancers, such as breast, ovarian, pancreatic, and colorectal cancer.6−12
Serological detection of ECM protein fragments encompasses ECM heterogeneity of pathological microenvironments, providing an overall assessment of patient health that can be monitored longitudinally.13,14 As a result, research has been directed toward developing novel techniques to detect and quantify circulating ECM for clinical application; however, much optimization is needed.15 Most techniques rely on analyte-specific methods, such as the Clauss clotting method for fibrinogen detection,16 or immunoassays, like enzyme-linked immunosorbent assay (ELISA)17−25 or electrochemiluminescence immunoassay (ECLIA).26 Analyte-specific assays are limited to analytes with quantifiable biophysical properties, and immunoassays require validated antibodies.27 Both require prior information on the targeted ECM protein, making them less practical for novel biomarker screening. Proteomics provides a comprehensive platform, however, prior proteomic techniques to detect circulating ECM amidst abundant serum proteins involve additional isolation techniques that require larger sample volumes.28,29 Current proteomic sample preparation requires large starting volumes for downstream ECM enrichment, or liquid chromatography separation involving multiple steps and specialized columns.30−33 High-throughput detection of ECM components in serum or other complex biofluids by mass spectrometry remains an ongoing challenge.
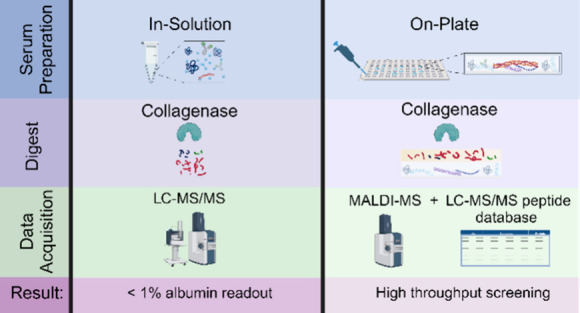
The use of collagenase to interrogate the ECM proteome of formalin-fixed tissues by imaging mass spectrometry methods has proven to be a powerful approach to spatially map trypsin resistant collagens and other stromal proteins.34 Collagenase does not have a highly specific primary sequence cleavage site, but instead has been shown to bind to triple helical regions to cleave individual strands.35 Here, we report a novel preparation method for serological ECM proteomics using collagenase digestion followed by chromatography that results in a direct readout of a subset of ECM proteins within 2 days. The method requires no fractionation and uses a minimal amount of serum. We further propose a higher throughput workflow that immobilizes serum proteins, specifically digests immobilized ECM and collagen proteins, and scans resulting digested peptides by mass spectrometry imaging. Reproducibility and quantification of collagen and serum peptides is demonstrated. LC-MS/MS data may be used as a reference library to rapidly assess the ECM variation in biofluids. These workflows are demonstrated on serum from normal individuals, as well as cirrhotic liver and hepatocellular carcinoma patients. An overall goal is to produce rapid workflows targeting the ECM as an early indicator of disease.
Experimental Section
Materials
Ammonium bicarbonate (A6141-25G), calcium chloride (C1016-100G), trifluoroacetic acid (T6508-100ML), Trizma base (T6791-100G), sodium bicarbonate (S-6014), ammonium phosphate (467782-50G), α-cyano-4-hydroxycinnamic acid (70990-1G), normal serum (H5667-20 ML, Lot # SLCJ3634), C18 ZipTip’s (ZTC18M096), and [Glu]-fibrinopeptide B (F3261-1MG) were purchased from Sigma-Aldrich (St. Louis, MO). HPLC grade acetonitrile (A998-4), HPLC grade water (W5-4), 0.1% formic acid in HPLC grade acetonitrile (LS118-500), 0.1% formic acid in HPLC water (LS120-500), HPLC grade chloroform (C606SK-1), ammonium hydroxide (A669S-500), glacial acetic acid (A385-500), hydrochloric acid (A14451-212), and HPLC-grade methanol (A452SK-4) were all purchased from Fisher Chemical (Fair Lawn, NJ). C18 StageTips (SP301) were purchased from ThermoFisher Scientific (Waltham, MA). Ethanol (2701) was purchased from Decon Laboratories (King of Prussia, PA). Collagenase Type 3 (LS004180) was purchased from Worthington Biochemical Corporation (Lakewood, NJ). MTP384 ground steel target plate with adapter (Part No. 8280784) was purchased from Bruker Daltonics (Bremen, Germany). Collagen peptides were purchased from Peptide 2.0 Inc. (Chantilly, VA). PNGase F Prime was purchased from N-Zyme Scientifics (Doylestown, PA).
Serum Preparation for LC-MS/MS Analysis
Serum from patients (n = 20) detailed in Table 1 was pooled and used with IRB approval as the exemption 4 status. Samples used were from a cohort from the University of California San Diego (UCSD) as previously described.36 Pooled serum aliquots of 3 mL were saved for evaluation of rapid scanning approaches. Pooled serum from cirrhotic liver (n = 20), hepatocellular carcinoma (n = 20), or normal sera (Sigma-Aldrich) was aliquoted into 8 μL aliquots, dried down, and resuspended in 50 μL of 10 mM ammonium bicarbonate, pH 7.4. Proteins were deglycosylated to improve steric access for enzymatic digest.37 To deglycosylate proteins, a total of 2 μg of PNGase F (PNGase F Prime, N-zyme Scientifics) was added to each aliquot and incubated in an Eppendorf ThermoMixer Compact 5350 for 2 h at 38 °C shaking at 450 rpm. Sample buffer was adjusted to include 1 mM CaCl2 and a total of 4 μg of collagenase Type 3 in 10 mM ammonium bicarbonate (pH 7.35) was added to the sample. Beyond the manufacturer’s characterization of collagenase activity, collagenase activity assays were previously performed using activity assay kits directed at collagen (Abcam ab196999) and further to ensure there is no trypsin activity using Trypsin Activity Assay Kit (Colorimetric) (Abcam ab102531). Samples were digested overnight at 38 °C with shaking at 450 rpm. An additional aliquot of collagenase Type 3 (4 μg) was added to the sample to further digest peptides for 5 h at 38 °C and 450 rpm.34 Enzyme, salts, and undigested proteins were removed using a C18 StageTip with a capacity of 10 μg. Samples were dried down, and an additional solid-phase extraction step was performed using a C18 ZipTip with a 2 μg to ensure removal of salts and undigested proteins and to standardize the amount of protein loaded on the LC column. Samples eluted from the ziptip were resuspended in 10 μL of 0.1% formic acid for LC-MS/MS experiments.
Table 1. Clinical Information of Cirrhotic and Hepatocellular Carcinoma Patient Groupsa.
| Clinical information | Cirrhosis | HCC |
|---|---|---|
| Subjects (n) | 20 | 20 |
| Hepatitis C (n) | 8 | 13 |
| Hepatitis B (n) | 1 | 3 |
| Alcohol related (n) | 8 | 8 |
| Fatty liver (n) | 5 | 2 |
| Portal hypertension (n) | 3 | 0 |
| Diabetes (n) | 6 | 6 |
| Hypertension (n) | 5 | 7 |
| Cirrhosis present (n) | 20 | 16 |
| Age (years) | 56 ± 13 | 67 ± 11 |
| Alkaline phosphatase (IU/L) | 98 ± 42 | 144 ± 51 |
| Alanine aminotransferase (IU/L) | 30 ± 22 | 59 ± 68 |
| Aspartate aminotransferase (IU/L) | 39 ± 17 | 91 ± 68 |
| Bilirubin (mg/dL) | 1.56 ± 2.18 | 1.81 ± 1.45 |
| Albumin (g/dL) | 3.9 ± 0.5 | 3.5 ± 0.7 |
| Total protein (g/dL) | 7.1 ± 0.7 | 7.3 ± 0.8 |
| International normalized ratio | 1.2 ± 0.2 | 1.2 ± 0.3 |
| Platelet count (platelets/nL) | 100 ± 40 | 141 ± 99 |
| Creatinine (mg/dL) | 0.78 ± 0.24 | 0.84 ± 0.19 |
| AFP average (ng/mL) | 17 ± 41 | 327.25 ± 1150 |
| Female (n) | 10 | 7 |
| Male (n) | 10 | 13 |
Values represent either number of patients (n) or averaged clinical values plus or minus one standard deviation.
LC-MS/MS Data Acquisition
One microliter (200 ng) of sample was injected in hexaplicates through a nanoElute (Bruker Daltonics, Bremen, Germany) LC system complexed to a 25 cm Aurora C18 nanoUHPLC separation column (IonOpticks, Fitzroy, Austrailia) before MS analysis on a timsTOF Flex (Bruker Daltonics, Bremen, Germany). A 40 min gradient from 2% acetonitrile (0.1% formic acid) to 30% acetonitrile (0.1% formic acid) was used to elute peptides. For MS data acquisition, a mass range of 100–1700 m/z and a mobility range of 0.85–1.45 Vs/cm2 was used in positive ion mode. A transfer time of 60 μs and prepulse storage of 12 μs was used. MS/MS settings included data-dependent acquisition with a 0.96 s cycle time and 8 PASEF ramps per cycle.
Data is available: https://massive.ucsd.edu/ProteoSAFe/dataset.jsp?task=50dfca8f9f6f4544ad342e398dad1441.
LC-MS/MS Data Analysis
Raw data was searched using MSFragger 3.5 and Fragpipe 18 against a curated database with the false discovery rate set to 1% and the digestion method set to unspecific. The database was curated from UniProt on July third, 2023, with entries that contain at least one the following words in the “ALL” category: extracellular space (GO:0005615), extracellular matrix, extracellular matrix remodeling, collagen, triple helix, triple helical, serum, cirrhosis, or hepatocellular carcinoma. Duplicates were removed, and results were filtered to only contain Swiss-Prot reviewed human proteins. The resulting database contained 4,432 unique entries. Post-translational modifications included in the search parameters were arginine and glutamine deamidation as well as methionine and proline hydroxylation. MS1 quantification for label free quantification and PTM Shephard for post-translational modification detection were used with default settings. Search results were uploaded to Scaffold v5.2.0 with a protein threshold of 99%, a peptide threshold of 99%, and a minimum of two peptides per protein. Peptide and protein probabilities were determined by the Peptide Prophet algorithm38 and Protein Prophet algorithm,39 respectively. Proteins were manually filtered with a nonzero average precursor intensity quantitative value in at least five out of six technical replicates. Proteins that met the 5/6 threshold were placed into categories based on protein family (complement proteins, apolipoproteins, and immunoglobulins) or cellular component Gene Ontology categories listed for each protein (ECM, other blood proteins, other secreted proteins, other matrix) (Table 2). Each protein was assigned to one protein category to avoid over-representation of proteins affiliated with multiple GO codes. ANOVA tests, Fisher’s exact tests, and heatmaps were also performed and created using log base 10 transformed average precursor intensities in MetaboAnalyast. To create a peptide reference library, raw data was loaded into MaxQuant where a curated database of secreted proteins was used to identify peptides (score >70) with a false discovery rate of 1%.
Table 2. Protein Categories of LC-TIMS-MS/MS-Identified Proteins and Affiliated Cellular Location-Based Gene Ontology Codesa.
| Category | Identification method |
|---|---|
| Extracellular Matrix | GO:0005581: Collagen Trimer |
| GO:0005584: Collagen Type I Trimer | |
| GO:0005589: Collagen Type VI Trimer | |
| GO:0005604: Basement Membrane | |
| GO:0031012: Extracellular Matrix | |
| GO:0062023: Collagen-Containing Extracellular Matrix | |
| Other Matrix | GO:0005178: Integrin Binding |
| GO:0005912: Adherens junction | |
| GO:0015629: Actin Cytoskeleton | |
| GO:0030478: Actin Cap | |
| GO:0043296: Apical Junction Comple) | |
| GO:0071065: alpha9-beta 1 integrin-vascular cell adhesion molecule-1 complex | |
| Immunoglobulins | Protein Group |
| Apolipoproteins Chylomicrons | Protein Group |
| GO: 0042627: Chylomicron | |
| Complement Proteins | Protein Group |
| Other Blood Microparticle | GO: 0072562: Blood Microparticle |
| Other Secreted Proteins | GO:0005615: Extracellular Space |
| GO:0005576: Extracellular Region | |
| GO:0070062: Extracellular Exosome |
Protein categories of LC-TIMS-MS/MS-identified proteins and corresponding cellular location-based Gene Ontology codes used to assign proteins to categories. Immunoglobulins, apolipoproteins, and complement proteins were assigned based on protein group.
Matrix-Assisted Laser/Desorption Ionization (MALDI) Mass Spectrometry Target Plate Preparation
To prepare for serum immobilization, an MTP384 ground steel target plate (Bruker Daltonics, Bremen, Germany) was rocked in methanol (3×, 5 min), wiped down with 5% ammonium hydroxide (2×), dipped in Carnoy’s solution (3×, 3 min dry), and rinsed with methanol (2×).
Collagen Peptide Standards Preparation
Stock solutions of peptide standards were suspended in a 2% acetonitrile and 0.1% formic acid aqueous solution at 1 μg/μL concentration and combined to produce a master mix of all standards at a concentration of 100 pmol/μL. A dilution series was then performed from the master mix to produce standards at concentrations of 2 pmol/μL, 1 pmol/μL, 750 fmol/μL, 500 fmol/μL, 250 fmol/μL, 100 fmol/μL, and 50 fmol/μL. Half of a microliter of each concentration was then administered neat or on 5× diluted, dried, and delipidated normal serum on MTP384 ground steel or amine reactive slides in quadruplicates.
Serum Dilution Preparation
Serum was pooled and frozen in 3 μL aliquots. Aliquots were thawed and diluted either 2, 3, 5, 10, 15, or 20× with 50 mM sodium bicarbonate (pH = 8.55). Samples were spotted in 0.5 μL quadruplicate on a washed ground steel MALDI target plate and dried overnight in a desiccator. Samples were delipidated with Carnoy’s solution by soaking the plate for 1.5 min and air-drying for 3 min five times. The direction of dipping was alternated to ensure uniform drying dynamics.
On-Plate Enzymatic Digestion
Activity-characterized collagenase (0.1 mg/mL) was resuspended in ammonium bicarbonate (10 mM) and calcium chloride (1 mM) buffer solution (pH 7.35) and applied using an HTX M5 Sprayer (HTX Technologies, LLC) with the following parameters: 40 °C nozzle temperature, 15 passes, 0.1 mg/mL concentration, 0.025 mL/min flow rate, 3 mm track spacing, CC pattern, 10 psi nitrogen pressure, 3 l/min gas flow rate, 0 drying, 40 mm Nozzle height. The target plate was transferred to a humidity chamber where collagen fragments were digested at 37 °C for 5 h.
Matrix Application
After enzymatic digestion, samples were dried and alpha-Cyano-4-hydroxycinnamic acid (7 mg/mL in 50% acetonitrile and 1% trifluoroacetic acid) spiked with a 1.67 μg/mL [Glu]-Fibrinopeptide B internal standard was applied using an HTX M5 Sprayer (HTX Technologies, LLC) with the following parameters: 79 °C nozzle temperature, 10 passes, 7 mg/mL concentration, 1300 velocity, 0.07 mL/min flow rate, 2.5 mm track spacing, CC pattern, 10 psi nitrogen pressure, 3 L/min gas flow rate, 0 drying, 40 mm Nozzle height. The target plate was dried and subsequently dipped twice in cold (4 °C) aqueous 5 mM ammonium phosphate and dried in a desiccator until mass spectrometry data acquisition.40,41
Matrix-Assisted Laser Desorption/Ionization Mass Spectrometry Data Acquisition and Data Analysis
MALDI-MS was performed using a timsTOF-Flex (Bruker Daltonics, Bremen Germany) in positive ion mode with a m/z range of 700–2500, transfer time of 80 μs, and prepulse storage of 22 μs. Data was collected using Flex Imaging 5.0 with a 60 μm raster width using 300 laser shots per pixel. Additional validation was done using Fourier transform ion cyclotron resonance mass spectrometry (Scimax, Bruker Daltonics, Bremen, Germany) in positive ion mode with m/z range of 687 to 2500, transient length of 0.8389, 120 μm raster, and 100 laser shots per pixel. Image data were visualized in SCiLS Lab 2022b (Bruker Daltonics, Bremen Germany), normalized to total ion count (TIC), and intensities were exported with an ±20 ppm peak width using the peak area interval processing mode and maximum peak intensity mean spectrum statistics. Peak matching was done using the LC-MS/MS peptide data as a reference library matching ±5 ppm. For serum dilutions, the limit of quantification (9x noise) was used to identify peptides with robust signal. Statistical analyses for experiments were performed in GraphPad Prism 9.
Results and Discussion
Differential Protease Specificity Enriches Low Abundant Serum Protein Readout without Additional Sample Preparation
Initial work leveraged differential protease specificity (DPS) to investigate serum proteins identified by LC-MS/MS. The workflow involved deglycosylating the serum with peptide N-glycosidase F, followed by digestion with collagenase, and chromatographic separation coupled to trapped ion mobility tandem mass spectrometry (LC-TIMS-MS/MS) (Figure 1A).42−44 The workflow was developed and used to analyze six technical replicates of pooled serum from patients with hepatocellular carcinoma (HCC) or cirrhosis (CIRR) or commercial normal human serum. A total of 224 proteins were identified with a 99.0% protein threshold, 99.0% peptide threshold, and a 2-peptide minimum in normal, cirrhosis, or HCC patient sera. Of these, 170 proteins were shared between all patient groups, 46 were shared between cirrhotic and HCC patients, 26 were seen only in normal patients, 17 were seen only in HCC patients, and 6 were seen only in cirrhotic liver patients (Figure 1B).
Figure 1.

Differential protease specificity profiles extracellular matrix and other lesser abundant proteins in serum without extensive sample preparation. (A) Schematic of differential protease specificity serum preparation followed by liquid chromatography coupled to trapped ion mobility tandem mass spectrometry. (B) Venn diagram of the absence or presence of 224 proteins in normal, cirrhosis, or HCC patient sera produced in Scaffold 5.0. (C) Pie charts show distribution of average precursor intensity across different protein categories for Normal (top), Cirrhosis (left), and HCC (right) patient sera. Details of protein categories and protein assignments are in Table S2. (D) Heatmap of log(10)-transformed, average precursor intensities depict average intensity distribution of the top 50 most significantly different proteins across Normal (blue), Cirrhosis (green), and HCC (red) patient sera. Significance was determined by the multiple test-corrected p-value of an ANOVA test performed on log base 10 transformed average precursor intensities. (E) Heatmap of log-transformed average precursor intensities show average intensity distribution of extracellular matrix proteins across Normal (blue), Cirrhosis (green), and HCC (red) patient sera. Heatmaps were autoscaled and clustered using the Ward method and Euclidean distance in MetaboAnalyst.
Proteins were further filtered to include proteins with a nonzero quantitative value (average precursor intensity) in at least five out of six replicates, resulting in 166 proteins (Tables S1 and S2). Protein average precursor intensity readout was evaluated using Gene Ontology (GO)-based cellular component categories (Table 2, Figure 1C, Table S1). For all patient groups, “blood microparticle proteins”, or proteins from any of several cell types that are released into the blood in microvesicles, were the highest readout (24%–28%). Overall abundance of “other secreted proteins” and “apolipoproteins” was similar among normal (17%, 13%, respectively), cirrhotic (17%, 14%), and HCC (16%, 12%) patient serum. ECM protein readout demonstrated the largest variation between normal, cirrhotic, and HCC patients (8%, 15%, and 16%, respectively) (Figure 1C). The higher proportion of ECM protein intensity in diseased patients suggests detection of disease-related ECM remodeling.22 Increases in circulating collagen in cirrhotic (703,495 average precursor intensity; 2.3% of total readout) and HCC (954,895; 2.7%) patient sera when compared to normal patient sera (179,475; 0.9%) further support ECM remodeling detection (Table S1). Other protein categories that differed between groups were immunoglobulins (17% normal, 13% cirrhosis, and 19% HCC), complement proteins (14% normal, 10% cirrhosis, and 9% HCC), and other matrix proteins (2% normal, 4% cirrhosis, and 3% HCC). Individual immunoglobulin heavy chains were detected, but with significant homologies (Tables S1 and S2). Most importantly, albumin, which accounts for 50–60% of serum protein by concentration, accounted for less than 1.2% of total average precursor intensity for all groups (1.1% normal, 0.9% cirrhosis, 0.7% HCC) (Figure S1).45
ANOVA tests were performed to detect significant variations in protein intensity across patient groups (Table S1). The top 50 most significantly different proteins (p-value < 1 × 10⁻⁸) and their intensity distribution across patient groups is depicted in a heatmap (Figure 1D). Many significantly differentially enriched proteins identified were validated by literature. For instance, the current study showed that serum amyloid A1 (SAA1) was only detected in HCC serum, while SAA2 was elevated in cirrhosis and HCC serum. In a study comparing SAA1 and SAA2 (SAA) serum levels between patients with hepatitis (n = 40), liver cirrhosis (n = 30), and HCC (n = 96), significant elevation of SAA was detected in HCC patients.46 Other studies confirm this result when comparing normal and HCC patient SAA1 serum concentration.47 This study also detected Cathepsin D (CTSD) exclusively in HCC patient serum. A previous study comparing CTSD serum levels between healthy (n = 30) patients, and patients with HBV-related cirrhosis (n = 50) HBV-related HCC (n = 80) showed elevated CTSD serum levels in HCC patients that correlated with tumor size and stage.48 Differentially abundant ECM proteins were also validated in the literature (Figure 1E). For example, vasorin (VASN), found increased in normal serum in the current study, is a negative regulator of TGF-beta pathways.49 Additionally, its deletion correlates with reduced survival, induces hepatocyte autophagy,50 and cardiac hypertrophy.51 Glycosylphosphatidylinositol-specific phospholipase D (GPDL1) is highly produced by liver tissue52 and overexpressed in chronic NAFLD53 and other chronic liver injuries.54 Circulating GPLD1 is decreased variably in HCC dependent on etiology.55 Lumican (LUM) has been marked as a prerequisite for hepatic fibrosis,56 and annotates increased risk of prediabetes in subjects with NAFLD.57 Furthermore, novel work on a highly characterized NASH cohort (n = 21) showed increases in lumican in serum correlating with hepatic fibrogenesis.58 Overall, these data show that using DPS demonstrated here with collagenase can relatively quantify differences in multiple potential HCC biomarkers, ECM proteins, and other low abundant serum across diseased states without sample enrichment.
MALDI-MS Coupled with an LC-MS/MS-Identified Peptide Reference Library Detects Biologically Relevant Serum Proteins in a High Throughput Manner
The previous method provided evidence that a DPS-collagenase digest followed by reverse phase LC-MS/MS selectively digests, identifies, and quantifies lower abundant serum proteins without the need for enrichment. However, scaling this method leads to lengthy LC-MS/MS run times. Recent work has demonstrated that high-throughput profiling of serum proteins can be accomplished, leveraging the rapid scanning of imaging mass spectrometers.42,43,59−61 Here, we used matrix-assisted laser/desorption ionization mass spectrometry imaging (MALDI-MSI) coupled with collagenase digestion to develop a high-throughput screening technique aimed at detecting circulating ECM peptides and low abundant serum proteins.
To assess this method’s ability to profile serum peptides, commercial normal serum and pooled cirrhosis or HCC patient serum were either spotted neat or diluted, then spotted on a ground steel plate prior to MALDI-MS data acquisition (Figure 2). MALDI-MS image heatmaps of 2x diluted spotted sera depict low and high intensities of representative putative peptides that are detected at m/z = 966.339 and 1260.474 (Figure 2A). Both peptides are higher in Cirrhosis and HCC sera when compared to normal serum.
Figure 2.

MALDI-MS can detect peptide signatures from immobilized and digested serum proteins. (A) Representative MALDI-MS images of m/z 966.339 (solid line) and 1260.474 (dotted line) are shown with a jet color scheme with 99% quantile. Spectra and images were captured in SCiLs Lab 2022b. (B) Heatmap of top 15 identifiable maximum peak intensities normalized to total ion count showing detectable and relatively quantifiable peptides by rapid MALDI-MS imaging. Rows are centered; unit variance scaling is applied to rows. Both rows and columns are clustered using the correlation distance and average linkage in ClusVis. MALDI MS image is represented in Viridis color scheme in the Supporting Information.
To quantify identifiable peptides, a high scoring (MaxQuant score >70) peptide reference library of 6,534 m/z entries from LC-MS/MS data was used as a first pass to detect and export intensity of peaks from MALDI-MS spectra. Evaluation of the first and last residue of each high scoring, unique peptide sequence shows an initial cleavage site distribution of collagenase with a prevalence of peptides starting with leucine (Figure S2). Figure 2B shows the exported intensities from 15 most intense peptides detected via MALDI MS. Peptides came primarily from fibrinogen alpha chain (3), apolipoprotein 1 (3), and alpha-1-antichymotrypsin (2). The difference in intensities between fibrinogen alpha chain peptides may be due to the different biology of the domains from which each peptide originates (Figure S3). Due to their intensity, three of the top 15 most intense peaks that were identified with a mass error of less than 5 ppm were selected for quantitative evaluation (Figure 3). Representative peptides mapped to fibrinogen alpha chain (m/z 1206.575), apolipoprotein A (m/z 1352.612), and corticosteroid binding steroid (m/z 1487.636) (Figure S4–S6).
Figure 3.
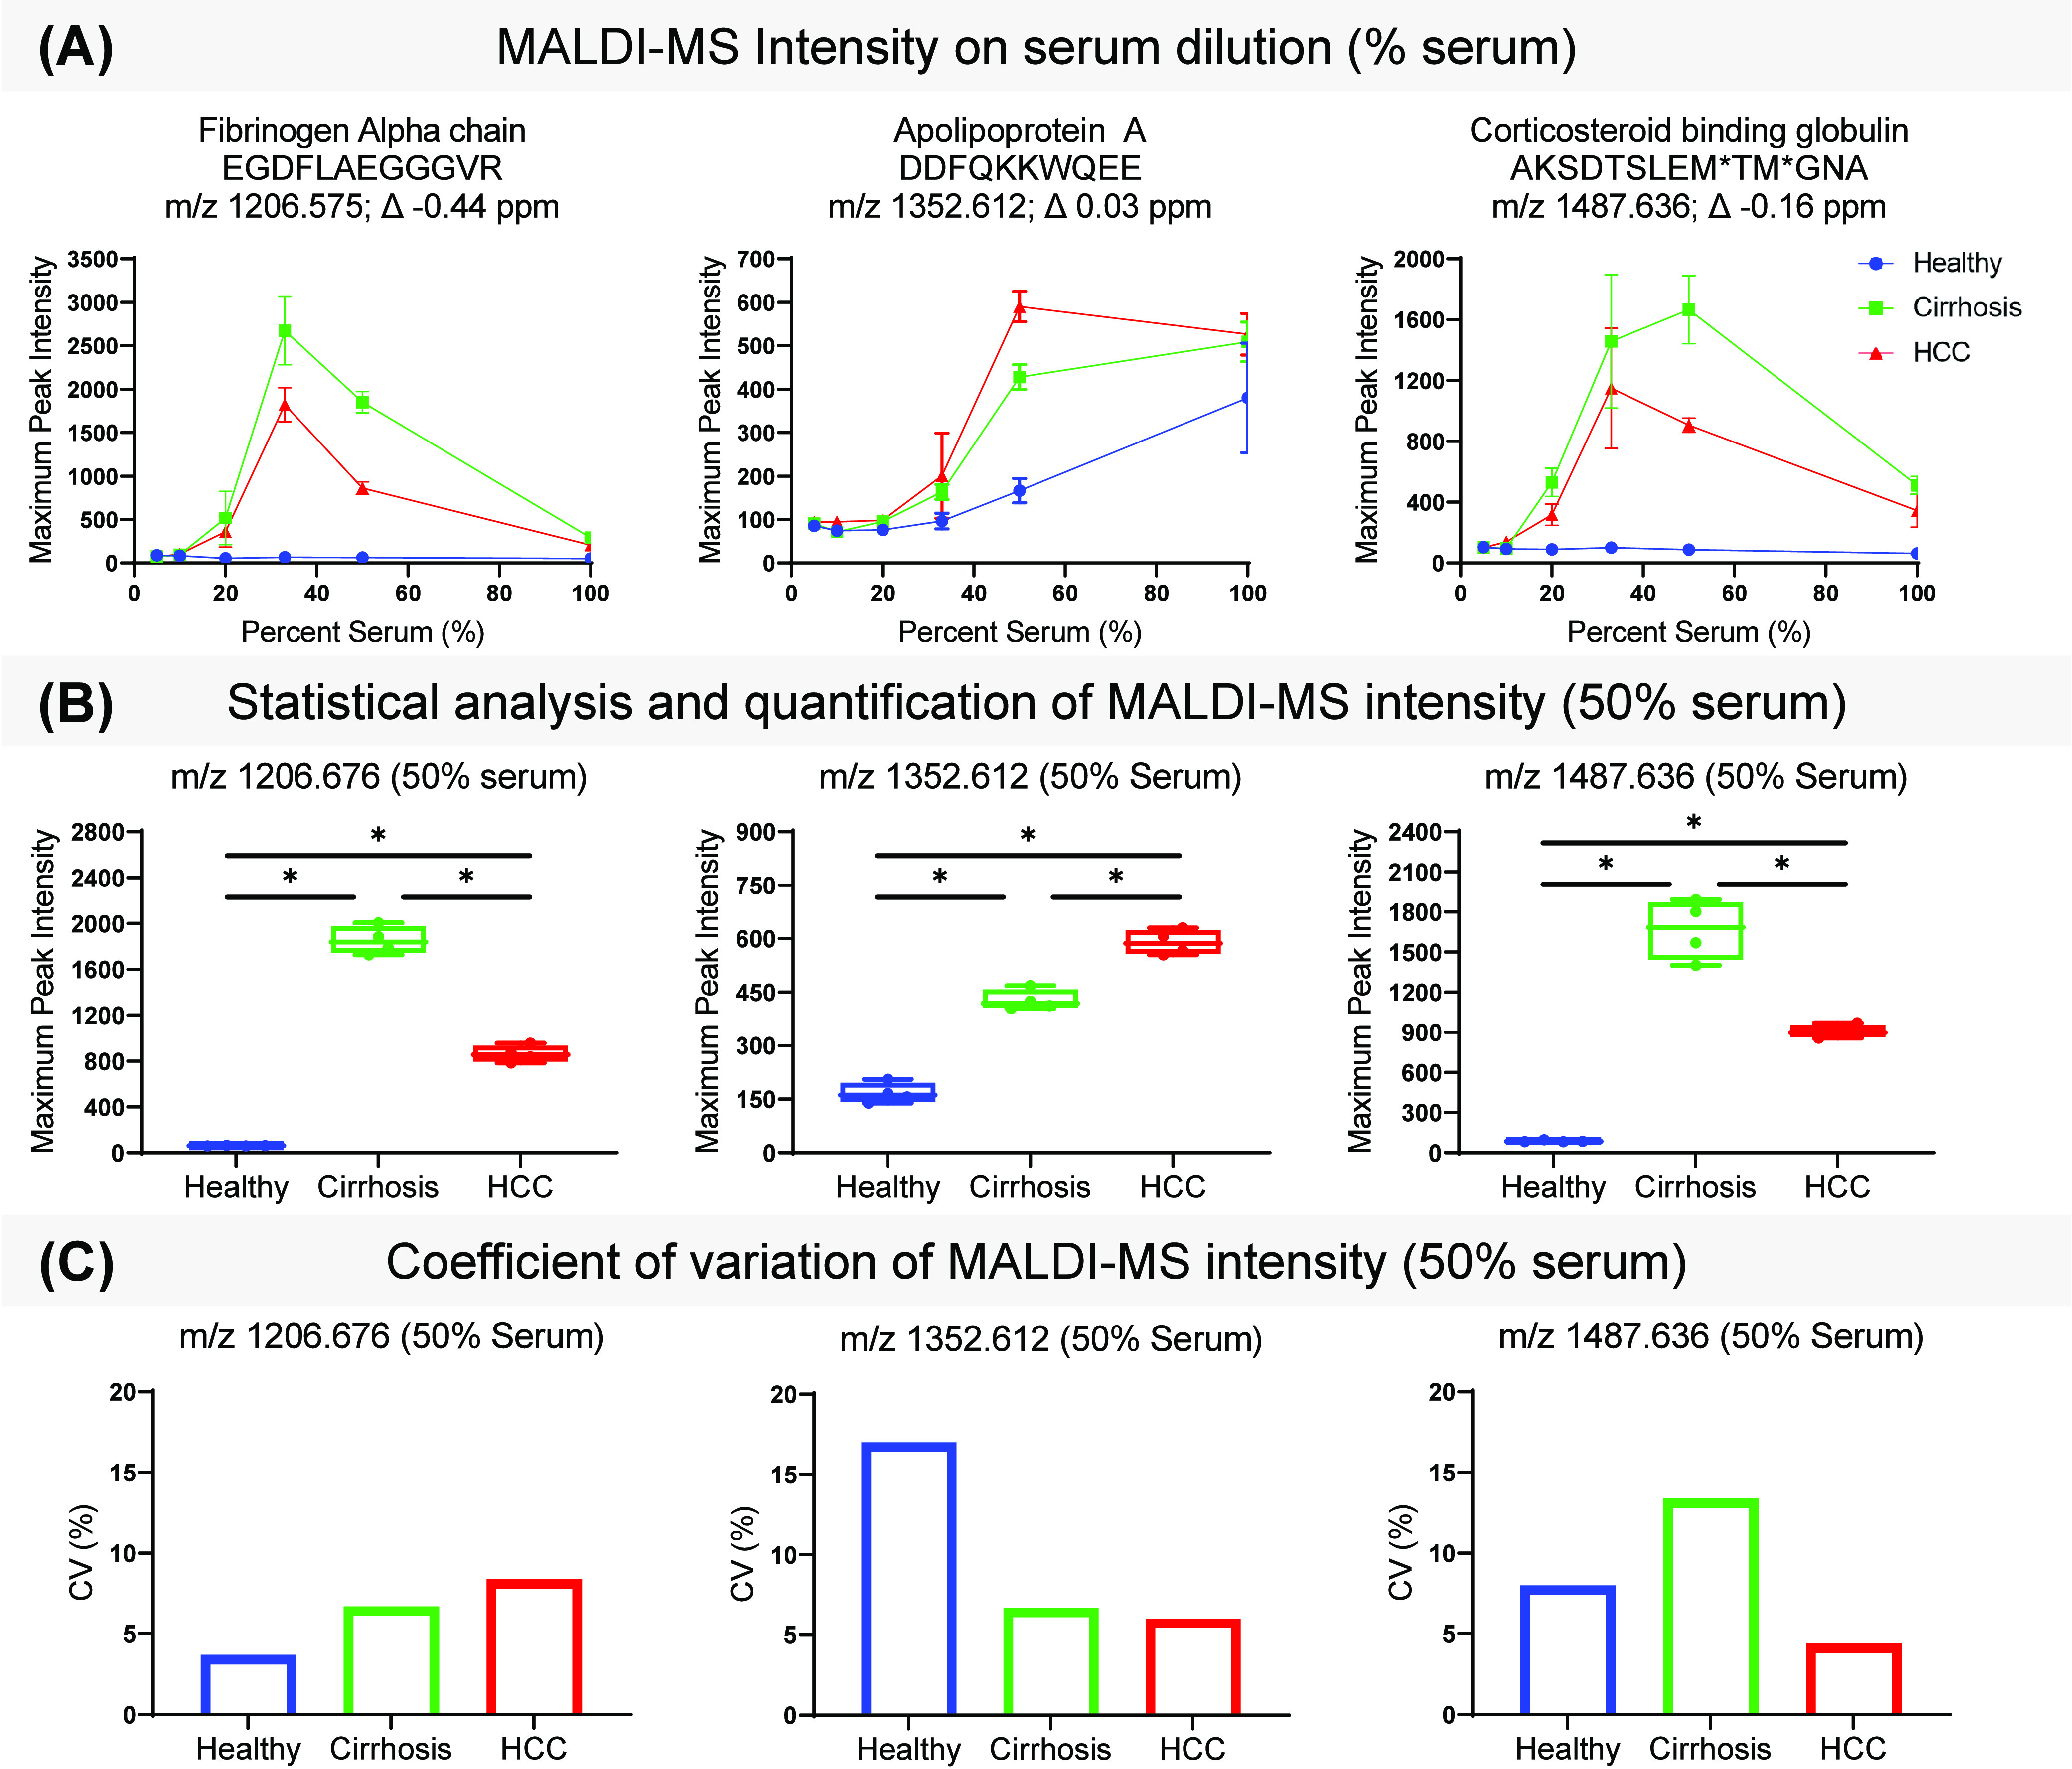
MALDI-MS detection and quantification of immobilized and LC-MS/MS-identified peptides. (A) Maximum peak intensity of fibrinogen alpha chain (left, m/z 1206.5775), apolipoprotein A (middle, m/z 1352.612), and corticosteroid binding globulin (right, m/z 1487.636) peptides on percent serum. Percent serum corresponds to dilution factor as follows: neat (100% serum), 2× (50% serum), 3× (33% serum), 5× (20% serum), 10× (10% serum), and 20× (5% serum). Average and standard deviation of each quadruplicate was plotted for Normal (blue), Cirrhosis (green), and HCC (red) patient sera. (B) Box plots show average, and distribution of maximum peak intensity normalized to total ion count from 2× diluted Normal (blue), Cirrhotic (green), or HCC (red) serum of each peptide. A Mann–Whitney U test in GraphPad Prism 9 was performed to assess significance. (C) Coefficient of variation of each peptide’s maximum peak intensity. *p-value < 0.05.
Dilution studies were performed to obtain optimal intensity for known peptides. Figures 3A and S7 show maximum peak intensity of each representative m/z value on percent serum from patients with cirrhosis, HCC, or normal. Signal intensity across dilution factor varies with each representative peptide; however, 2× (50% serum) and 3× (33% serum) dilutions show the highest intensity across all peptides. For this reason, intensities from 2× dilutions were used for downstream analysis. Since our sample is not depleted, some explanations for why diluted samples show higher intensities include diluting out innate salts, reducing protein–protein interactions, and optimizing analyte-matrix ratios. Quantification of each peptide immobilized after a 2× dilution shows significant higher levels of fibrinogen alpha chain peptide and corticosteroid binding peptide in cirrhotic patient serum and higher levels of apolipoprotein A peptide in HCC patient serum when compared to normal serum (Figure 3A, B). These findings support previous studies that have correlated elevated circulating fibrinogen to worse HCC prognosis.16,62,63 The CV of replicates is below 20% for all groups for representative peptides (Figure 3C). Additional data analysis done on Fourier Transform Ion Cyclotron Resonance mass spectrometry showed similar variation across replicates (data not shown). This data demonstrated a proof-of-concept screening technique for serological ECM proteomics requiring 2 μL per patient resulting in direct readout of DPS-targeted peptides within 2 days. The number of patients screened per experiment depends on MALDI plate size, but with current spot distribution, 24 patients can be screened in quadruplicate with each experiment. However, when comparing with precursor intensity values from LC-MS/MS data, peptides detected by MALDI-MS were abundant, but were complementary to electrospray ionization (ESI) as there were some putative peptides detected by MALDI-MS that were not identifiable by LC-MS/MS (Figures S8 and S9). This is likely due to differences in ionization methods resulting in a different readout of detectable peptides.64 These comparisons highlight the need for more targeted approaches to build a better reference library.
Absolute Quantification of Collagenase-Generated Peptides in Serum
To assess the potential to detect and absolutely quantify collagenase-generated peptides, two peptide standards high in Glycine-Proline (GP) content (Table 3) with or without proline hydroxylation (P*) were prepared as calibration standards and applied as neat solution or spiked on top of 5x diluted normal serum prior to MALDI-MS data acquisition (Figure 4A, B).
Table 3. Theoretical and Measured GP-rich Peptide Standard Massesa.
| Sequence | Theoretical monoisotopic mass | Measured mass | Measured mass error (ppm) |
|---|---|---|---|
| GPAGERGSP | 827.401 | 827.401 | 0 |
| GPAGERGSP* | 843.396 | 843.394 | 2.4 |
| GRPGEVGPP | 865.453 | 865.454 | –1.2 |
| GRP*GEVGPP* | 897.442 | 897.443 | –1.1 |
Peptide standard sequence, theoretical monoisotopic mass, observed mass measured by timsTOF flex, and mass error in ppm. P* represents hydroxylated proline.
Figure 4.

Standard curves of collagenase-generated peptides. Standard curves of collagenase-generated GPAGERGSP (A) and GRPGEVGPP (B) peptide standards plot maximum peak intensity normalized to total ion count on femtomoles of standard. Standards were either unmodified (red) or proline hydroxylated (P*, blue) and spotted on either normal serum (filled circles) or neat (open circles). A standard simple linear regression model was applied using GraphPad Prism 9. (C) Histogram with 5% bin width showing the distribution of coefficient of variances (CV) for serum (left) and neat (right) application.
The coefficient of determination (R2), shown in Table 4, was comparable between serum and neat application for standards GPAGERGSP (0.982 vs 0.976), GPAGERGSP* (0.936 vs 0.969), GRPGEVGPP (0.994 vs 0.982), and GRP*GEVGPP* (0.978 vs 0.976). Simple linear regression model p-values for all application methods were less than or equal to 0.0005, signifying high linearity for the tested concentration range of 25–1000 fmol (Table 4). In general, peptides with hydroxylated proline produced stronger signal when compared to their nonhydroxylated peptide counterparts at the same concentration, suggesting a need for a separate standard curve for each analyte that is being quantified.65 Evaluation of the coefficient of variation (CV) demonstrated that most CVs were between 10% and 15% for both serum and neat applications (Figure 4C). In general, CVs for application on serum were lower than neat application. Initial explorations showed that ground steel produced the best performance. Preliminary studies using polished amine reactive slides produced higher CVs and decreased linearity (data not shown).
Table 4. Standard Curves of GP-Rich Peptide Standards from 25 fmol to 1000 fmola.
| Application | Peptide standard | Linear regression model (intensity on concentration) | R2 coefficient | p-Value |
|---|---|---|---|---|
| Serum | GPAGERGSP | y = 25.5x + 602 | 0.980 | <0.0001 |
| GPAGERGSP* | y = 26.6x + 729 | 0.927 | 0.0005 | |
| GRPGEVGPP | y = 23.9x + 365 | 0.994 | <0.0001 | |
| GRP*GEVGPP* | y = 33.6x + 707 | 0.975 | <0.0001 | |
| Neat | GPAGERGSP | y = 6.48x + 533 | 0.976 | <0.0001 |
| GPAGERGSP* | y = 11.2x + 1100 | 0.970 | <0.0001 | |
| GRPGEVGPP | y = 8.76x + 489 | 0.982 | <0.0001 | |
| GRP*GEVGPP* | y = 11.3x + 1110 | 0.978 | <0.0001 |
Linear regression of standard curve of GPAGERGSP, GPAGERGSP*, GRPGEVGPP, and GRP*GEVGP* peptide standards from concentrations of 25 to 1000 fmol applied neat or on serum.R2 coefficient and p-value were determined using a simple linear regression in GraphPad Prism 9.
Conclusions
Evaluation of ECM in serum provides an alternate source of biomarkers for early detection, therapeutic monitoring, and prognostics of disease. In conventional methods, significant sample preparation is required to measure ECM proteins in serum. This work presents a proof-of-concept leveraging DPS paired with LC-TIMS-MS/MS to obtain a differential serum readout. The current approach using collagenase to digest serum reported a proteomic readout that detected ECM proteins in serum and was comprised of less than 1.2% albumin by average precursor intensity. The circulating ECM and serum proteins detected in this study have been previously detected in normal, cirrhosis, or HCC serum in past literature, validating the approach. A high-throughput scanning method was further evaluated to establish foundational aspects for relative and absolute quantification of serum and ECM peptides by DPS. We additionally propose that generated peptide databases may act as a reference library used in high-throughput scanning approaches. The goal of this work is to develop a noninvasive, high-throughput screening tool for diseases whose early stages involve ECM remodeling.
Acknowledgments
J.K.M. was supported by the Cellular, Biochemical and Molecular Sciences Training Program 5T32GM132055 (NIH/NIGMS). P.M.A. was supported by NIH/NCI R21CA263464, R01CA253460; and in part by pilot research funding, Hollings Cancer Center’s Cancer Center Support Grant P30 CA138313 at the Medical University of South Carolina. Supported in part by MUSC Digestive Disease Research Core Center (P30DK123794) and the Biorepository & Tissue Analysis Shared Resource and the Translational Science Laboratory, Hollings Cancer Center, Medical University of South Carolina. The FT was supported by the provost office and Hollings Cancer Center. Additional support was provided by the South Carolina Centers of Economic Excellence SmartState program to RRD and ASM. The Mass Spectrometry Facility and Redox Proteomics Core is supported by the University and P20GM103542 (NIH/NIGMS) with shared instrumentation S10 OD010731 & S10 OD025126 (NIH/OD) to LEB and S10 0D030212 to PMA. The contents are solely the responsibility of the authors and do not necessarily represent the official views of the NIH or NCATS.
Supporting Information Available
The Supporting Information is available free of charge at https://pubs.acs.org/doi/10.1021/jasms.3c00366.
Comparison of the top 35 proteins by spectral count and intensity from previously published tryptic digests (Vissers et al, Mol Cell Proteomics, 2007; Adkins et al, Mol Cell Proteomics, 2002) and Collagenase Type 3 digests on whole serum without albumin depletion; graph and motif depicting frequency of N-terminal and C-terminal amino acid residues of serum peptide readout after Collagenase Type 3 digest; LC-MS/MS-identified peptides mapped to annotated fibrinogen alpha chain protein sequence; Annotated MS2 spectra and theoretical fragmentation MALDI-MS m/z-matched, LC-MS/MS-identified apolipoprotein A peptide; annotated MS2 spectra and theoretical fragmentation MALDI-MS m/z-matched, LC-MS/MS-identified fibrinogen alpha chain peptide; annotated MS2 spectra and theoretical fragmentation MALDI-MS m/z-matched, LC-MS/MS-identified corticosteroid binding globulin peptide; MALDI-MS images of m/z = 966.339 and 1260.474 in Viridis color scheme; Venn diagram of MALDI-MSI m/z values from MALDI-MS spectra and LC-MS/MS accurate mass values from reference library (PDF)
Author Present Address
† Division of Cardiovascular Medicine, Center for Interdisciplinary Cardiovascular Sciences, Brigham and Women’s Hospital and Harvard Medical School, Boston, Massachusetts, 02115, United States
Author Present Address
‡ Consolidated Safety Services, Inc. contractor for National Oceanic and Atmospheric Administration, National Ocean Service, National Centers for Coastal Ocean Science, Charleston, South Carolina, 29412, United States
Author Contributions
J.K.M. performed experiments and collected data presented in the manuscript. P.M.A. conceived and designed the experiments. J.K.M. and P.M.A. wrote the manuscript. S.C.Z. helped optimize search parameters for LC-TIMS MS/MS experiments. C.L.C. and J.S. performed initial experimental method development. R.R.D. and A.S.M. proofed the written manuscript.
The authors declare no competing financial interest.
Supplementary Material
References
- Karamanos N. K.; Theocharis A. D.; Piperigkou Z.; Manou D.; Passi A.; Skandalis S. S.; Vynios D. H.; Orian-Rousseau V.; Ricard-Blum S.; Schmelzer C. E. H.; et al. A guide to the composition and functions of the extracellular matrix. FEBS journal 2021, 288 (24), 6850–6912. 10.1111/febs.15776. [DOI] [PubMed] [Google Scholar]
- Manou D.; Caon I.; Bouris P.; Triantaphyllidou I.-E.; Giaroni C.; Passi A.; Karamanos N. K.; Vigetti D.; Theocharis A. D. The complex interplay between extracellular matrix and cells in tissues. extracellular matrix: Methods and protocols 2019, 1952, 1–20. 10.1007/978-1-4939-9133-4_1. [DOI] [PubMed] [Google Scholar]
- Winkler J.; Abisoye-Ogunniyan A.; Metcalf K. J.; Werb Z. Concepts of extracellular matrix remodelling in tumour progression and metastasis. Nat. Commun. 2020, 11 (1), 5120. 10.1038/s41467-020-18794-x. [DOI] [PMC free article] [PubMed] [Google Scholar]
- Cox T. R. The matrix in cancer. Nature Reviews Cancer 2021, 21 (4), 217–238. 10.1038/s41568-020-00329-7. [DOI] [PubMed] [Google Scholar]
- Eble J. A.; Niland S. The extracellular matrix in tumor progression and metastasis. Clinical & experimental metastasis 2019, 36 (3), 171–198. 10.1007/s10585-019-09966-1. [DOI] [PubMed] [Google Scholar]
- Lehmann J.; Praktiknjo M.; Nielsen M. J.; Schierwagen R.; Meyer C.; Thomas D.; Violi F.; Strassburg C. P.; Bendtsen F.; Moller S.; Krag A.; Karsdal M. A.; Leeming D. J.; Trebicka J. Collagen type IV remodelling gender-specifically predicts mortality in decompensated cirrhosis. Liver Int. 2019, 39 (5), 885–893. 10.1111/liv.14070. [DOI] [PMC free article] [PubMed] [Google Scholar]
- Leeming D.; He Y.; Veidal S.; Nguyen Q.; Larsen D.; Koizumi M.; Segovia-Silvestre T.; Zhang C.; Zheng Q.; Sun S.; Cao Y.; Barkholt V.; Hagglund P.; Bay-Jensen A.; Qvist P.; Karsdal M. A novel marker for assessment of liver matrix remodeling: an enzyme-linked immunosorbent assay (ELISA) detecting a MMP generated type I collagen neo-epitope (C1M). Biomarkers 2011, 16 (7), 616–28. 10.3109/1354750X.2011.620628. [DOI] [PubMed] [Google Scholar]
- Giussani M.; Triulzi T.; Sozzi G.; Tagliabue E. Tumor extracellular matrix remodeling: new perspectives as a circulating tool in the diagnosis and prognosis of solid tumors. Cells 2019, 8 (2), 81. 10.3390/cells8020081. [DOI] [PMC free article] [PubMed] [Google Scholar]
- Lipton A.; Leitzel K.; Ali S. M.; Polimera H. V.; Nagabhairu V.; Marks E.; Richardson A. E.; Krecko L.; Ali A.; Koestler W.; Esteva F. J.; Leeming D. J.; Karsdal M. A.; Willumsen N. High turnover of extracellular matrix reflected by specific protein fragments measured in serum is associated with poor outcomes in two metastatic breast cancer cohorts. Int. J. Cancer 2018, 143 (11), 3027–3034. 10.1002/ijc.31627. [DOI] [PubMed] [Google Scholar]
- Bager C. L.; Willumsen N.; Leeming D. J.; Smith V.; Karsdal M. A.; Dornan D.; Bay-Jensen A. C. Collagen degradation products measured in serum can separate ovarian and breast cancer patients from healthy controls: A preliminary study. Cancer Biomark 2015, 15 (6), 783–8. 10.3233/CBM-150520. [DOI] [PubMed] [Google Scholar]
- Willumsen N.; Ali S. M.; Leitzel K.; Drabick J. J.; Yee N.; Polimera H. V.; Nagabhairu V.; Krecko L.; Ali A.; Maddukuri A.; Moku P.; Ali A.; Poulose J.; Menon H.; Pancholy N.; Costa L.; Karsdal M. A.; Lipton A. Collagen fragments quantified in serum as measures of desmoplasia associate with survival outcome in patients with advanced pancreatic cancer. Sci. Rep 2019, 9 (1), 19761. 10.1038/s41598-019-56268-3. [DOI] [PMC free article] [PubMed] [Google Scholar]
- Zou X.; Feng B.; Dong T.; Yan G.; Tan B.; Shen H.; Huang A.; Zhang X.; Zhang M.; Yang P.; Zheng M.; Zhang Y. Up-regulation of type I collagen during tumorigenesis of colorectal cancer revealed by quantitative proteomic analysis. J. Proteomics 2013, 94, 473–85. 10.1016/j.jprot.2013.10.020. [DOI] [PubMed] [Google Scholar]
- Choi J.; Kim G. A.; Han S.; Lee W.; Chun S.; Lim Y. S. Longitudinal Assessment of Three Serum Biomarkers to Detect Very Early-Stage Hepatocellular Carcinoma. Hepatology 2019, 69 (5), 1983–1994. 10.1002/hep.30233. [DOI] [PubMed] [Google Scholar]
- Borges K. A.; Dai J.; Parikh N. D.; Schwartz M.; Nguyen M. H.; Roberts L. R.; Befeler A. S.; Srivastava S.; Rinaudo J. A.; Feng Z.; Marrero J. A.; Reddy K. R. Rationale and design of the Hepatocellular carcinoma Early Detection Strategy study: A multi-center longitudinal initiative of the National Cancer Institute’s Early Detection Research Network. Contemp Clin Trials 2019, 76, 49–54. 10.1016/j.cct.2018.11.008. [DOI] [PMC free article] [PubMed] [Google Scholar]
- Jensen C.; Nissen N. I.; Von Arenstorff C. S.; Karsdal M. A.; Willumsen N. Serological assessment of collagen fragments and tumor fibrosis may guide immune checkpoint inhibitor therapy. J. Exp Clin Cancer Res. 2021, 40 (1), 326. 10.1186/s13046-021-02133-z. [DOI] [PMC free article] [PubMed] [Google Scholar]
- Dai T.; Peng L.; Lin G.; Li Y.; Yao J.; Deng Y.; Li H.; Wang G.; Liu W.; Yang Y.; Chen G.; Wang G. Preoperative elevated plasma fibrinogen level predicts tumor recurrence and poor prognosis in patients with hepatocellular carcinoma. J. Gastrointest Oncol 2019, 10 (6), 1049–1063. 10.21037/jgo.2019.09.11. [DOI] [PMC free article] [PubMed] [Google Scholar]
- Jensen C.; Madsen D. H.; Hansen M.; Schmidt H.; Svane I. M.; Karsdal M. A.; Willumsen N. Non-invasive biomarkers derived from the extracellular matrix associate with response to immune checkpoint blockade (anti-CTLA-4) in metastatic melanoma patients. J. Immunother Cancer 2018, 6 (1), 152. 10.1186/s40425-018-0474-z. [DOI] [PMC free article] [PubMed] [Google Scholar]
- Jensen C.; Holm Nielsen S.; Eslam M.; Genovese F.; Nielsen M. J.; Vongsuvanh R.; Uchila R.; van der Poorten D.; George J.; Karsdal M. A.; Leeming D. J.; Willumsen N. Cross-Linked Multimeric Pro-Peptides of Type III Collagen (PC3X) in Hepatocellular Carcinoma - A Biomarker That Provides Additional Prognostic Value in AFP Positive Patients. J. Hepatocell Carcinoma 2020, 7, 301–313. 10.2147/JHC.S275008. [DOI] [PMC free article] [PubMed] [Google Scholar]
- Thorlacius-Ussing J.; Jensen C.; Madsen E. A.; Nissen N. I.; Manon-Jensen T.; Chen I. M.; Johansen J. S.; Diab H. M. H.; Jorgensen L. N.; Karsdal M. A.; Willumsen N. Type XX Collagen Is Elevated in Circulation of Patients with Solid Tumors. Int. J. Mol. Sci. 2022, 23 (8), 4144. 10.3390/ijms23084144. [DOI] [PMC free article] [PubMed] [Google Scholar]
- Wang S.; Bager C. L.; Karsdal M. A.; Chondros D.; Taverna D.; Willumsen N. Blood-based extracellular matrix biomarkers as predictors of survival in patients with metastatic pancreatic ductal adenocarcinoma receiving pegvorhyaluronidase alfa. J. Transl Med. 2021, 19 (1), 39. 10.1186/s12967-021-02701-z. [DOI] [PMC free article] [PubMed] [Google Scholar]
- Wang H.; Hong M.; Ding L.; Song B. Serum cross-linked N-telopeptide of type I collagen as a potential diagnostic marker for bone metastasis in lung cancer: An updated meta-analysis. Thorac Cancer 2023, 14, 787. 10.1111/1759-7714.14808. [DOI] [PMC free article] [PubMed] [Google Scholar]
- Willumsen N.; Bager C. L.; Leeming D. J.; Smith V.; Christiansen C.; Karsdal M. A.; Dornan D.; Bay-Jensen A. C. Serum biomarkers reflecting specific tumor tissue remodeling processes are valuable diagnostic tools for lung cancer. Cancer Med. 2014, 3 (5), 1136–45. 10.1002/cam4.303. [DOI] [PMC free article] [PubMed] [Google Scholar]
- Chen I. M.; Willumsen N.; Dehlendorff C.; Johansen A. Z.; Jensen B. V.; Hansen C. P.; Hasselby J. P.; Bojesen S. E.; Pfeiffer P.; Nielsen S. E.; Hollander N. H.; Yilmaz M. K.; Karsdal M.; Johansen J. S. Clinical value of serum hyaluronan and propeptide of type III collagen in patients with pancreatic cancer. Int. J. Cancer 2020, 146 (10), 2913–2922. 10.1002/ijc.32751. [DOI] [PubMed] [Google Scholar]
- Andriani F.; Landoni E.; Mensah M.; Facchinetti F.; Miceli R.; Tagliabue E.; Giussani M.; Callari M.; De Cecco L.; Colombo M. P.; Roz L.; Pastorino U.; Sozzi G. Diagnostic role of circulating extracellular matrix-related proteins in non-small cell lung cancer. BMC Cancer 2018, 18 (1), 899. 10.1186/s12885-018-4772-0. [DOI] [PMC free article] [PubMed] [Google Scholar]
- Thorlacius-Ussing J.; Jensen C.; Nissen N. I.; Cox T. R.; Kalluri R.; Karsdal M.; Willumsen N. The collagen landscape in cancer: profiling collagens in tumors and in circulation reveals novel markers of cancer-associated fibroblast subtypes. J. Pathol 2024, 262, 22. 10.1002/path.6207. [DOI] [PubMed] [Google Scholar]
- Jensen C.; Sinkeviciute D.; Madsen D. H.; Onnerfjord P.; Hansen M.; Schmidt H.; Karsdal M. A.; Svane I. M.; Willumsen N. Granzyme B Degraded Type IV Collagen Products in Serum Identify Melanoma Patients Responding to Immune Checkpoint Blockade. Cancers (Basel) 2020, 12 (10), 2786. 10.3390/cancers12102786. [DOI] [PMC free article] [PubMed] [Google Scholar]
- Barascuk N.; Veidal S. S.; Larsen L.; Larsen D. V.; Larsen M. R.; Wang J.; Zheng Q.; Xing R.; Cao Y.; Rasmussen L. M.; Karsdal M. A. A novel assay for extracellular matrix remodeling associated with liver fibrosis: An enzyme-linked immunosorbent assay (ELISA) for a MMP-9 proteolytically revealed neo-epitope of type III collagen. Clin Biochem 2010, 43 (10–11), 899–904. 10.1016/j.clinbiochem.2010.03.012. [DOI] [PubMed] [Google Scholar]
- Bellei E.; Bergamini S.; Monari E.; Fantoni L. I.; Cuoghi A.; Ozben T.; Tomasi A. High-abundance proteins depletion for serum proteomic analysis: concomitant removal of non-targeted proteins. Amino Acids 2011, 40 (1), 145–56. 10.1007/s00726-010-0628-x. [DOI] [PubMed] [Google Scholar]
- Zolotarjova N.; Martosella J.; Nicol G.; Bailey J.; Boyes B. E.; Barrett W. C. Differences among techniques for high-abundant protein depletion. Proteomics 2005, 5 (13), 3304–13. 10.1002/pmic.200402021. [DOI] [PubMed] [Google Scholar]
- Pieper R.; Gatlin C. L.; Makusky A. J.; Russo P. S.; Schatz C. R.; Miller S. S.; Su Q.; McGrath A. M.; Estock M. A.; Parmar P. P.; Zhao M.; Huang S. T.; Zhou J.; Wang F.; Esquer-Blasco R.; Anderson N. L.; Taylor J.; Steiner S. The human serum proteome: display of nearly 3700 chromatographically separated protein spots on two-dimensional electrophoresis gels and identification of 325 distinct proteins. Proteomics 2003, 3 (7), 1345–64. 10.1002/pmic.200300449. [DOI] [PubMed] [Google Scholar]
- Adkins J. N.; Varnum S. M.; Auberry K. J.; Moore R. J.; Angell N. H.; Smith R. D.; Springer D. L.; Pounds J. G. Toward a human blood serum proteome: analysis by multidimensional separation coupled with mass spectrometry. Mol. Cell Proteomics 2002, 1 (12), 947–55. 10.1074/mcp.M200066-MCP200. [DOI] [PubMed] [Google Scholar]
- Faca V.; Pitteri S. J.; Newcomb L.; Glukhova V.; Phanstiel D.; Krasnoselsky A.; Zhang Q.; Struthers J.; Wang H.; Eng J.; Fitzgibbon M.; McIntosh M.; Hanas S. Contribution of Protein Fractionation to Depth of Analysis of theSerum and Plasma Proteomes. J. Proteome Res. 2007, 6 (9), 3558. 10.1021/pr070233q. [DOI] [PubMed] [Google Scholar]
- Sarihan M.; Bal Albayrak M. G.; Kasap M.; Akpinar G.; Kocyigit E. An experimental workflow for enrichment of low abundant proteins from human serum for the discovery of serum biomarkers. J. Biol. Methods 2023, 10, e99010001 10.14440/jbm.2023.394. [DOI] [PMC free article] [PubMed] [Google Scholar]
- Angel P. M.; Comte-Walters S.; Ball L. E.; Talbot K.; Mehta A.; Brockbank K. G. M.; Drake R. R. Mapping Extracellular Matrix Proteins in Formalin-Fixed, Paraffin-Embedded Tissues by MALDI Imaging Mass Spectrometry. J. Proteome Res. 2018, 17, 635–646. 10.1021/acs.jproteome.7b00713. [DOI] [PMC free article] [PubMed] [Google Scholar]
- Eckhard U.; Huesgen P. F.; Brandstetter H.; Overall C. M. Proteomic protease specificity profiling of clostridial collagenases reveals their intrinsic nature as dedicated degraders of collagen. Journal of proteomics 2014, 100, 102. 10.1016/j.jprot.2013.10.004. [DOI] [PMC free article] [PubMed] [Google Scholar]
- Wang M.; Comunale M. A.; Herrera H.; Betesh L.; Kono Y.; Mehta A. Identification of IgM as a contaminant in lectin-FLISA assays for HCC detection. Biochem. Biophys. Res. Commun. 2016, 476 (3), 140–5. 10.1016/j.bbrc.2016.05.027. [DOI] [PMC free article] [PubMed] [Google Scholar]
- Clift C. L.; Drake R. R.; Mehta A.; Angel P. M. Multiplexed imaging mass spectrometry of the extracellular matrix using serial enzyme digests from formalin-fixed paraffin-embedded tissue sections. Anal Bioanal Chem. 2021, 413 (10), 2709–2719. 10.1007/s00216-020-03047-z. [DOI] [PMC free article] [PubMed] [Google Scholar]
- Keller A.; Nesvizhskii A. I.; Kolker E.; Aebersold R. Empirical Statistical Model To Estimate theAccuracy of Peptide Identifications Made byMS/MS and Database Search. Anal. Chem. 2002, 74, 5383. 10.1021/ac025747h. [DOI] [PubMed] [Google Scholar]
- Nesvizhskii A. I.; Keller A.; Kolker E.; Aebersold R. A Statistical Model for Identifying Proteins byTandem Mass Spectrometry. Anal. Chem. 2003, 75, 4646. 10.1021/ac0341261. [DOI] [PubMed] [Google Scholar]
- Zhu X.; Papayannopoulos I. A. Improvement in the detection of low concentration protein digests on a MALDI TOF/TOF workstation by reducing alpha-cyano-4-hydroxycinnamic acid adduct ions. Journal of biomolecular techniques 2003, 14 (4), 9. [PMC free article] [PubMed] [Google Scholar]
- Smirnov I. P.; Zhu X.; Taylor T.; Huang Y.; Ross P.; Papayanopoulos I. A.; Martin S. A.; Pappin D. J. Suppression of alpha-cyano-4-hydroxycinnamic acid matrix clusters and reduction of chemical noise in MALDI-TOF mass spectrometry. Anal. Chem. 2004, 76 (10), 2958. 10.1021/ac035331j. [DOI] [PubMed] [Google Scholar]
- Black A. P.; Angel P. M.; Drake R. R.; Mehta A. S. Antibody Panel Based N-Glycan Imaging for N-Glycoprotein Biomarker Discovery. Current Protocols in Protein Science 2019, 98 (1), e99 10.1002/cpps.99. [DOI] [PMC free article] [PubMed] [Google Scholar]
- Blaschke C. R. K.; Black A. P.; Mehta A. S.; Angel P. M.; Drake R. R. Rapid N-Glycan Profiling of Serum and Plasma by a Novel Slide-Based Imaging Mass Spectrometry Workflow. J. Am. Soc. Mass Spectrom. 2020, 31 (12), 2511–2520. 10.1021/jasms.0c00213. [DOI] [PMC free article] [PubMed] [Google Scholar]
- Angel P. M.; Comte-Walters S.; Ball L. E.; Talbot K.; Mehta A.; Brockbank K. G. M.; Drake R. R. Mapping Extracellular Matrix Proteins in Formalin-Fixed, Paraffin-Embedded Tissues by MALDI Imaging Mass Spectrometry. J. Proteome Res. 2018, 17 (1), 635–646. 10.1021/acs.jproteome.7b00713. [DOI] [PMC free article] [PubMed] [Google Scholar]
- Vissers J. P.; Langridge J. I.; Aerts J. M. Analysis and quantification of diagnostic serum markers and protein signatures for Gaucher disease. Mol. Cell Proteomics 2007, 6 (5), 755–66. 10.1074/mcp.M600303-MCP200. [DOI] [PubMed] [Google Scholar]
- Wu J. L.; Su T. H.; Chen P. J.; Chen Y. R. Acute-phase serum amyloid A for early detection of hepatocellular carcinoma in cirrhotic patients with low AFP level. Sci. Rep 2022, 12 (1), 5799. 10.1038/s41598-022-09713-9. [DOI] [PMC free article] [PubMed] [Google Scholar]
- Li G.; Shen Q.; Xu H.; Zhou Y.; Li C.; Li Y.; He M. SAA1 identified as a potential prediction biomarker for metastasis of hepatocellular carcinoma via multi-omics approaches. Front Oncol 2023, 13, 1138995 10.3389/fonc.2023.1138995. [DOI] [PMC free article] [PubMed] [Google Scholar]
- Chuaypen N.; Sriphoosanaphan S.; Vorasittha A.; Pinjaroen N.; Thongboonkerd V.; Tangkijvanich P.; Sirichindakul P. Targeted Proteins Reveal Cathepsin D as a Novel Biomarker in Differentiating Hepatocellular Carcinoma from Cirrhosis and Other Liver Cancers. Asian Pac J. Cancer Prev 2022, 23 (6), 2017–2025. 10.31557/APJCP.2022.23.6.2017. [DOI] [PMC free article] [PubMed] [Google Scholar]
- Malapeira J.; Esselens C.; Bech-Serra J. J.; Canals F.; Arribas J. ADAM17 (TACE) regulates TGFbeta signaling through the cleavage of vasorin. Oncogene 2011, 30 (16), 1912–22. 10.1038/onc.2010.565. [DOI] [PubMed] [Google Scholar]
- Yang L.; Cheng X.; Shi W.; Li H.; Zhang Q.; Huang S.; Huang X.; Wen S.; Gan J.; Liao Z.; et al. Vasorin Deletion in C57BL/6J Mice Induces Hepatocyte Autophagy through Glycogen-Mediated mTOR Regulation. Nutrients 2022, 14 (17), 3600. 10.3390/nu14173600. [DOI] [PMC free article] [PubMed] [Google Scholar]
- Ikeda Y.; Imai Y.; Kumagai H.; Nosaka T.; Morikawa Y.; Hisaoka T.; Manabe I.; Maemura K.; Nakaoka T.; Imamura T.; et al. Vasorin, a transforming growth factor β-binding protein expressed in vascular smooth muscle cells, modulates the arterial response to injury in vivo. Proc. Natl. Acad. Sci. U. S. A. 2004, 101 (29), 10732–10737. 10.1073/pnas.0404117101. [DOI] [PMC free article] [PubMed] [Google Scholar]
- Fagerberg L.; Hallström B. M.; Oksvold P.; Kampf C.; Djureinovic D.; Odeberg J.; Habuka M.; Tahmasebpoor S.; Danielsson A.; Edlund K.; et al. Analysis of the human tissue-specific expression by genome-wide integration of transcriptomics and antibody-based proteomics. Molecular Cellular Proteomics 2014, 13 (2), 397–406. 10.1074/mcp.M113.035600. [DOI] [PMC free article] [PubMed] [Google Scholar]
- Chalasani N.; Vuppalanchi R.; Raikwar N. S.; Deeg M. A. Glycosylphosphatidylinositol-specific phospholipase d in nonalcoholic Fatty liver disease: A preliminary study. Journal of Clinical Endocrinology & Metabolism 2006, 91 (6), 2279–2285. 10.1210/jc.2006-0075. [DOI] [PubMed] [Google Scholar]
- Cao J.; Zhou A.; Zhou Z.; Liu H.; Jia S. The role of GPLD1 in chronic diseases. Journal of Cellular Physiology 2023, 238 (7), 1407. 10.1002/jcp.31041. [DOI] [PubMed] [Google Scholar]
- Jian-Hua T.; Wang-Jiao H.; He H.; Chao-Chao T.; Qiong D.; Kai-Jia W.; Xian-Yu Y.; Xu-Jin Z. Important roles of glycosylphosphatidylinositol (GPI)-specific phospholipase D and some GPI-anchored proteins in the pathogenesis of hepatocellular carcinoma. Clinical biochemistry 2009, 42 (4–5), 400–407. 10.1016/j.clinbiochem.2008.11.019. [DOI] [PubMed] [Google Scholar]
- Krishnan A.; Li X.; Kao W.-Y.; Viker K.; Butters K.; Masuoka H.; Knudsen B.; Gores G.; Charlton M. Lumican, an extracellular matrix proteoglycan, is a novel requisite for hepatic fibrosis. Laboratory Investigation 2012, 92 (12), 1712–1725. 10.1038/labinvest.2012.121. [DOI] [PMC free article] [PubMed] [Google Scholar]
- Karamfilova V.; Gateva A.; Assyov Y.; Nedeva I.; Velikova T.; Cherkezov N.; Mateva L.; Kamenov Z. Lumican in obese patients with nonalcoholic fatty liver disease with or without prediabetes. Metabolic Syndrome and Related Disorders 2020, 18 (9), 443–448. 10.1089/met.2020.0001. [DOI] [PubMed] [Google Scholar]
- Decaris M. L.; Li K. W.; Emson C. L.; Gatmaitan M.; Liu S.; Wang Y.; Nyangau E.; Colangelo M.; Angel T. E.; Beysen C.; et al. Identifying nonalcoholic fatty liver disease patients with active fibrosis by measuring extracellular matrix remodeling rates in tissue and blood. Hepatology 2017, 65 (1), 78–88. 10.1002/hep.28860. [DOI] [PMC free article] [PubMed] [Google Scholar]
- Ochoa-Rios S.; Blaschke C. R. K.; Wang M.; Peterson K. D.; DelaCourt A.; Grauzam S. E.; Lewin D.; Angel P.; Roberts L. R.; Drake R.; et al. Analysis of n-linked glycan alterations in tissue and serum reveals promising biomarkers for intrahepatic cholangiocarcinoma. Cancer Research Communications 2023, 3 (3), 383–394. 10.1158/2767-9764.CRC-22-0422. [DOI] [PMC free article] [PubMed] [Google Scholar]
- Scott D. A.; Wang M.; Grauzam S.; Pippin S.; Black A.; Angel P. M.; Drake R. R.; Castellino S.; Kono Y.; Rockey D. C.; et al. GlycoFibroTyper: A novel method for the glycan analysis of IgG and the development of a biomarker signature of liver fibrosis. Frontiers in Immunology 2022, 13, 233. 10.3389/fimmu.2022.797460. [DOI] [PMC free article] [PubMed] [Google Scholar]
- McQuiston A.; Scott D.; Nord D.; Langerude L.; Pelaez A.; Machuca T.; Mehta A.; Drake R. R.; Christie J. D.; Angel P.; et al. Pro-inflammatory IgG1 N-glycan signature correlates with primary graft dysfunction onset in COPD patients. Transplant Immunology 2022, 71, 101491 10.1016/j.trim.2021.101491. [DOI] [PubMed] [Google Scholar]
- Huang G.; Jiang H.; Lin Y.; Wu Y.; Cai W.; Shi B.; Luo Y.; Jian Z.; Zhou X. Prognostic value of plasma fibrinogen in hepatocellular carcinoma: a meta-analysis. Cancer Manag Res. 2018, 10, 5027–5041. 10.2147/CMAR.S175780. [DOI] [PMC free article] [PubMed] [Google Scholar]
- Zhang X.; Long Q. Elevated serum plasma fibrinogen is associated with advanced tumor stage and poor survival in hepatocellular carcinoma patients. Medicine (Baltimore) 2017, 96 (17), e6694 10.1097/MD.0000000000006694. [DOI] [PMC free article] [PubMed] [Google Scholar]
- Nadler W. M.; Waidelich D.; Kerner A.; Hanke S.; Berg R.; Trumpp A.; Rosli C. MALDI versus ESI: The Impact of the Ion Source on Peptide Identification. J. Proteome Res. 2017, 16 (3), 1207–1215. 10.1021/acs.jproteome.6b00805. [DOI] [PubMed] [Google Scholar]
- Prentice B. M.; Chumbley C. W.; Caprioli R. M. Absolute quantification of rifampicin by MALDI Imaging mass spectrometry using multiple TOF/TOF events in a single laser shot. J. Am. Soc. Mass Spectrom. 2017, 28 (1), 136–144. 10.1007/s13361-016-1501-2. [DOI] [PMC free article] [PubMed] [Google Scholar]
Associated Data
This section collects any data citations, data availability statements, or supplementary materials included in this article.