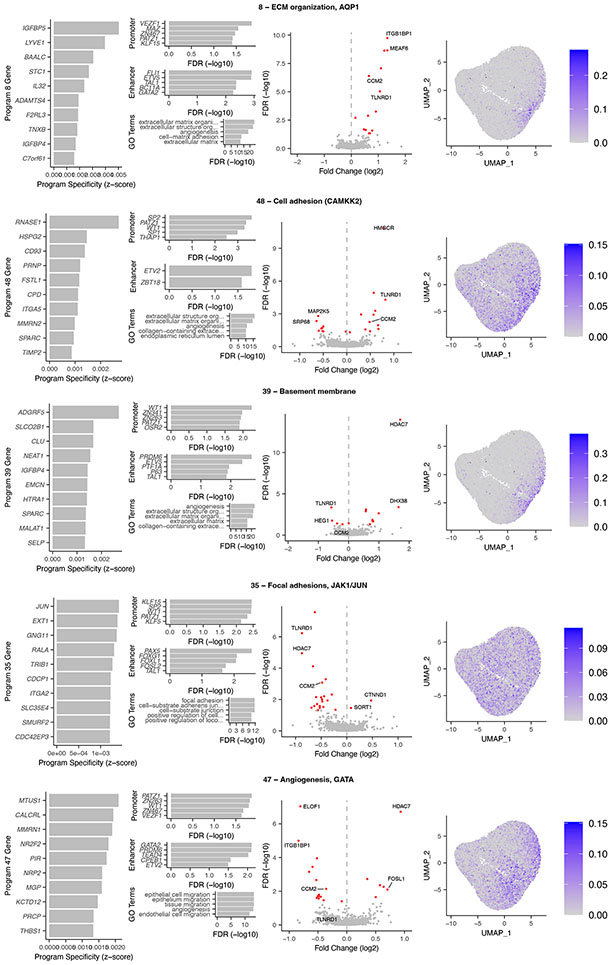
Extended Data Fig. 4. Annotations for CAD-associated programs: 8, 35, 39, 47, 48.
Left panels. Top 10 program co-regulated genes. Program Specificity z-scores are the cNMF marker gene coefficients, indicating how specific this gene is to this program, relative to other programs (see Methods).
Middle left panels. Top: Top 5 motifs enriched in the promoters or enhancers of the program co-regulated genes. Bottom: Top 5 GO terms enriched in program co-regulated genes.
Middle right panels. Regulators of the program. Volcano plot shows effects of all perturbed genes on program expression. Red: FDR < 0.05. Labeled: top 2 significant regulators in each direction, plus CCM2 and TLNRD1.
Right panels. UMAP of program expression in a subset of cells (24,000, randomly selected).

