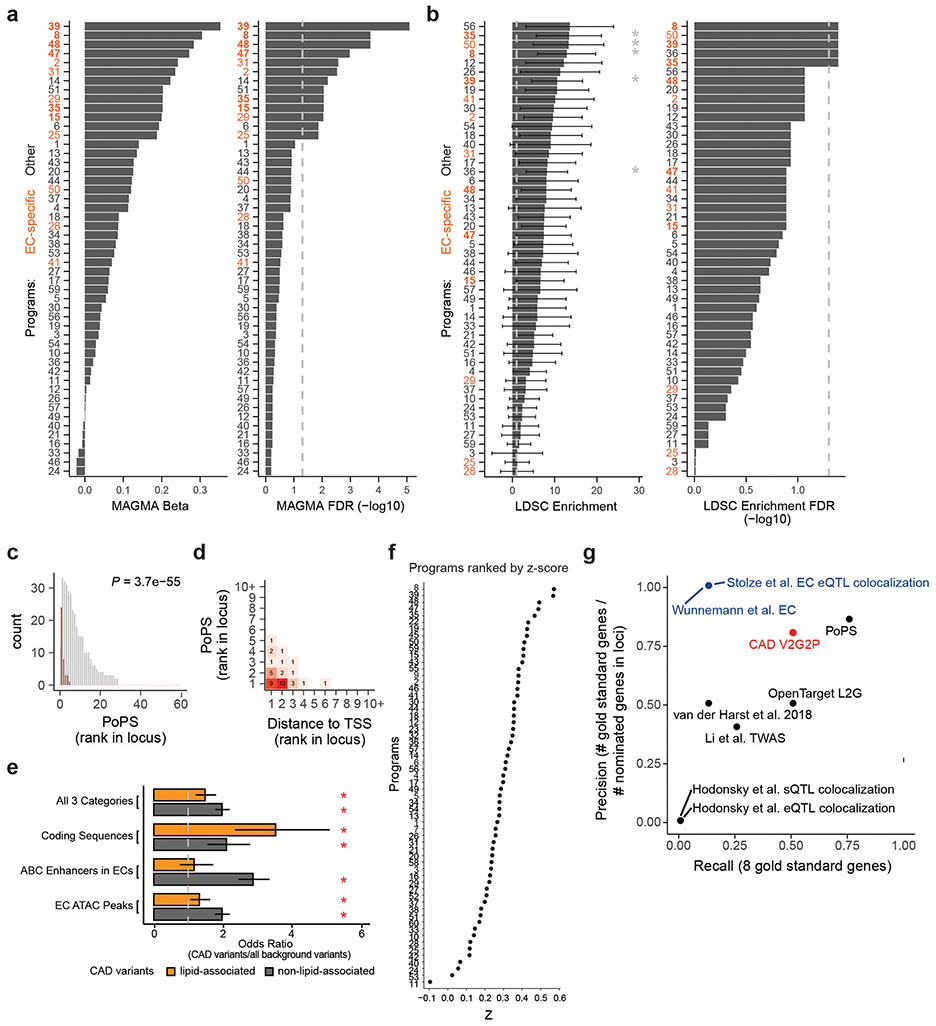
Extended Data Fig. 5. Prioritization of CAD-associated programs and candidate CAD genes.
a. Using MAGMA to prioritize gene programs enriched for CAD heritability (linking variants to program genes and 50kb of flanking sequence, see Methods). Barplots show beta regression coefficient (left) and −log10 FDR (Benjamini-Hochberg adjusted enrichment p-value, right). Programs are ordered separately by beta or FDR value. Dotted line: FDR = 0.05.
b. Using S-LDSC to prioritize gene programs enriched for CAD heritability (linking variants in endothelial cell chromatin accessible regions to genes within 50 Kb, see Methods). Barplots show enrichment (left) and −log10 FDR (Benjamini-Hochberg adjusted enrichment p-value, right). N = 300 (co-regulated program genes ranked by z-score coefficient, for each program). Error bars: standard error around the enrichment estimate, calculated by S-LDSC using jackknife (which resamples the data used for calculating heritability enrichment). P.values were calculated using the S-LDSC method28, and FDR by the Benjamini-Hochberg method. *: FDR<0.05. Dotted lines: 1 fold enrichment (left), or FDR 0.05 (right).
c. CAD-associated V2G2P genes are ranked highly by an independent gene prioritization method, the Polygenic priority score (PoPS). For each of the 43 CAD GWAS signals including a CAD-associated V2G2P gene, we ranked nearby genes based on their PoPS scores. Red: 39 CAD-associated V2G2P genes (2 genes, EXOC3L2 and PECAM1, were not assigned scores by PoPS). Gray: all other nearby genes. p-value: two-sided Mann-Whitney U-test.
d. Contingency table of PoPS and distance-to-TSS ranks for the 39 CAD-associated V2G2P genes. (2 CAD-associated V2G2P genes were not assigned scores by PoPS).
e. Odds ratios of variants in lipid-associated (N=1,181) or non-lipid-associated (N=3,313) CAD GWAS signals in (i) ATAC peaks in endothelial cells (N=373,630 unique non-overlapping non-promoter features from 11 epigenomic datasets in ECs, see Methods), (ii) ABC enhancers in endothelial cells (N=47,112 unique non-overlapping non-promoter features from 11 epigenomic datasets in ECs), (iii) coding sequences (N=189,232 unique non-overlapping non-promoter features), or (iv) all three categories combined (N=519,046 unique non-overlapping non-promoter features), compared to background variants (all SNPs from 1000 Genomes, excluding lipid-associated or non-lipid associated CAD GWAS variants, N=9,955,2088 or N=9,953,076, respectively, see Methods). Odds ratios were calculated as ((CAD variants within the indicated genomic features)/(all background variants within these features))/((CAD variants outside of these features)/(all background variants outside of these features), and significance assessed by application of a two-sided Fisher’s exact test to the contingency table of this data, with columns=CAD variants v. background variants and rows=inside features v. outside features. Error bars: 95% confidence interval. *: FDR < 0.05. Specific FDR values, from top to bottom, were 1.1e-4, 3.3e-33, 1.5e-8, 3.2e-6, 0.39, 6.0e-32, 0.011, 7.5e-31. Dotted line: odds ratio of 1.
f. sc-linker prioritization for 60 EC Perturb-seq gene programs, ranked by z-score. The ranking of programs was similar to V2G2P analysis, but none of the programs reached significance.
g. Precision/Recall (PR) plot for V2G2P and seven prior approaches to prioritize CAD locus genes. Recall: the fraction of the 8 “gold standard” genes (with strong prior evidence for endothelial cell-specific roles in CAD) detected by each method. Precision: [number of “gold standard” genes called] / [number of genes called within these gold standard loci]. Red: V2G2P. Blue: Other studies that prioritized CAD GWAS genes in endothelial cells.

